
~71 % of Earth’s surface
Ocean of Earth’s surface
IPCC SROCC · IPCC SROCC 2019
World Ocean
Sourced figures. Ocean heat is not SST; pH is chemistry; a plastic flow is not the stock in a gyre.
~71 % of Earth’s surface
IPCC SROCC · IPCC SROCC 2019
~90 % of excess heat
IPCC AR6 WG1 · IPCC AR6 2021
3.7 mm / year
IPCC AR6 WG1 · 2006-2018
~0.1 pH units since ~1750
IPCC AR6; NOAA PMEL · IPCC AR6 / NOAA PMEL
0.5-3.3 % O₂, upper 1000 m
IPCC SROCC · 1970-2010
4.8-12.7 million tonnes / year
Jambeck et al. 2015 · 2010, Jambeck 2015
35.5 % of stocks
FAO marine stocks 2025 · FAO 2025 (2021 status)
~14 % of coral, 2009-18
GCRMN 2020 · 2009-2018
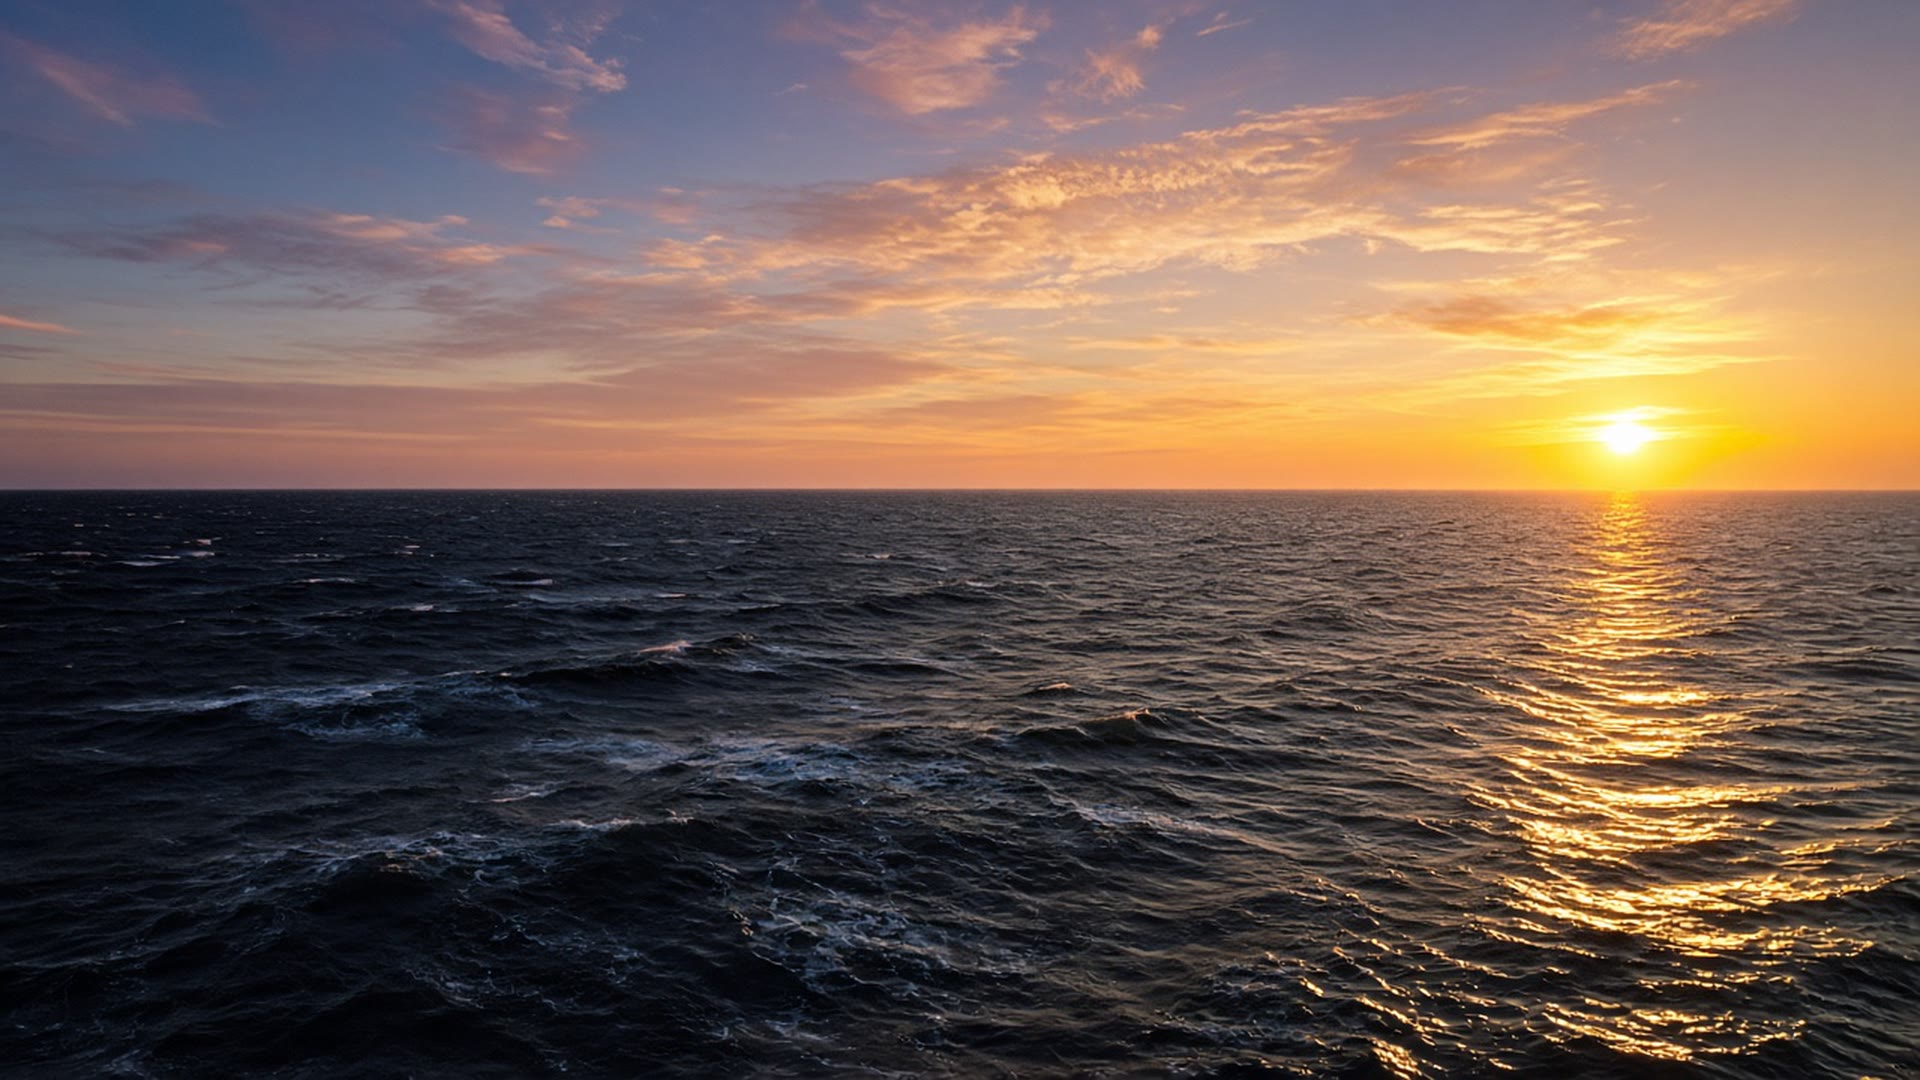
Photo: founder-supplied sunset over the open ocean.
Mangroves, seagrass meadows, salt marshes and kelp forests are coastal ecosystems that shelter shores, support fish and store carbon. These pages show how much of each has been mapped and how it has changed, and a fifth page explains blue carbon, the carbon these habitats hold.
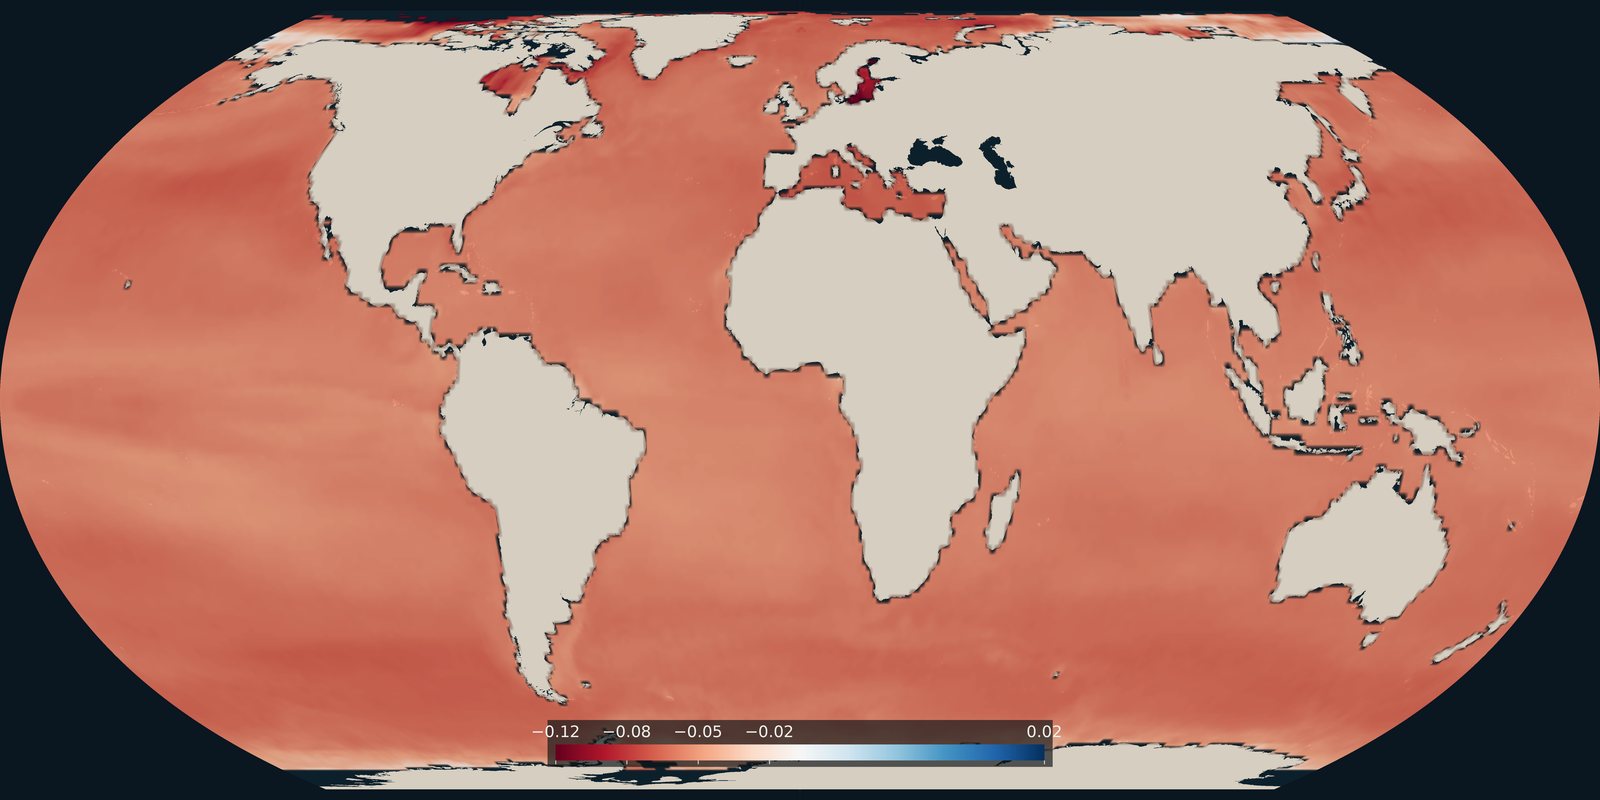
How much surface-ocean pH changed from the late 1980s to the early 2020s. A carbonate-chemistry trend, not temperature and not a pollution map.
Read the card →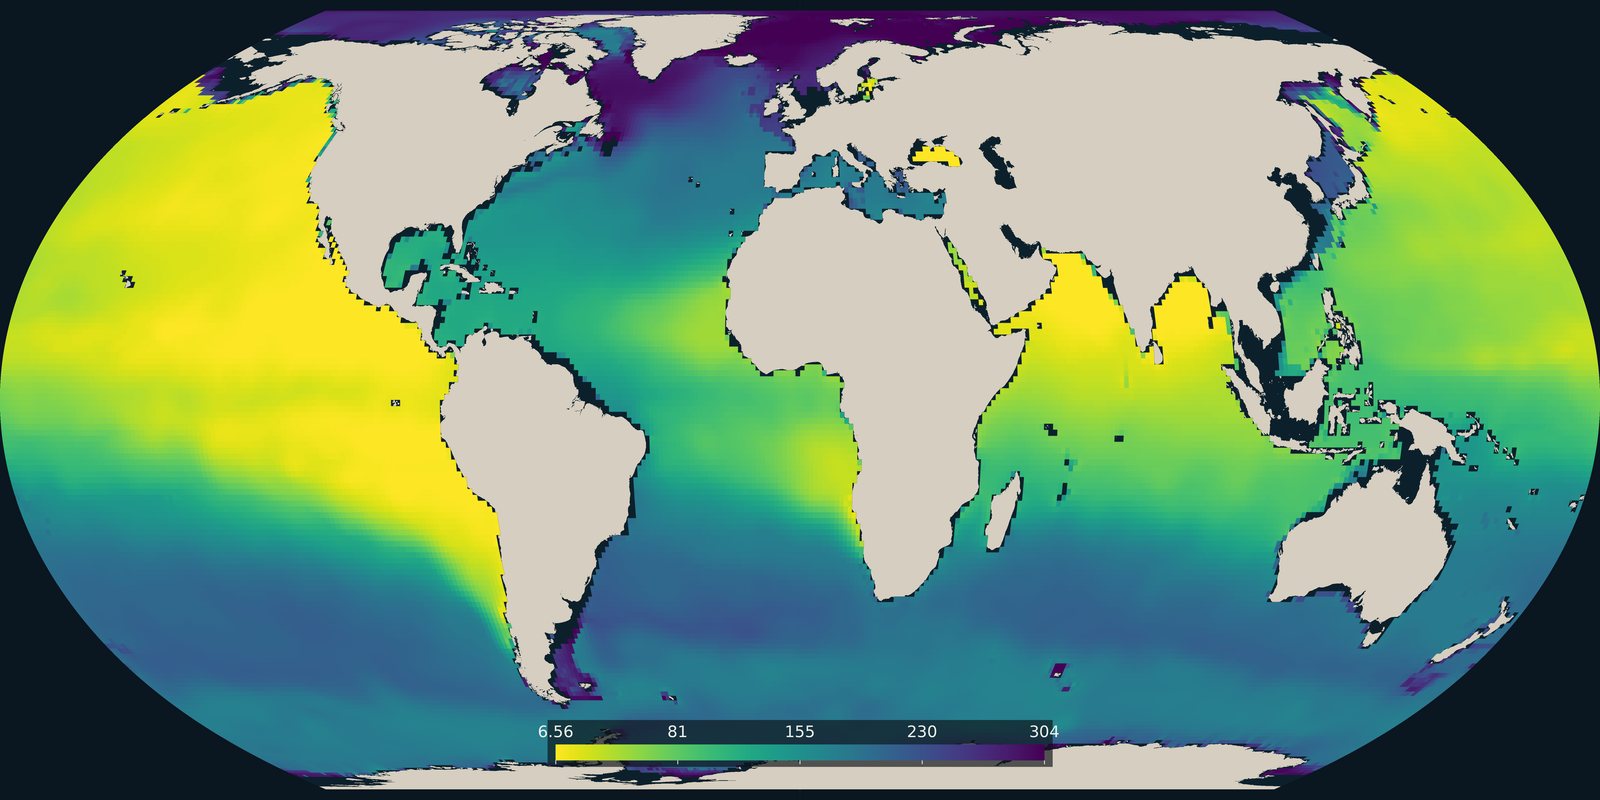
The lowest dissolved oxygen between 100 and 1000 metres in the World Ocean Atlas 2023 climatology. Open-ocean oxygen, not the coastal dead-zone pins on Pollution.
Read the card →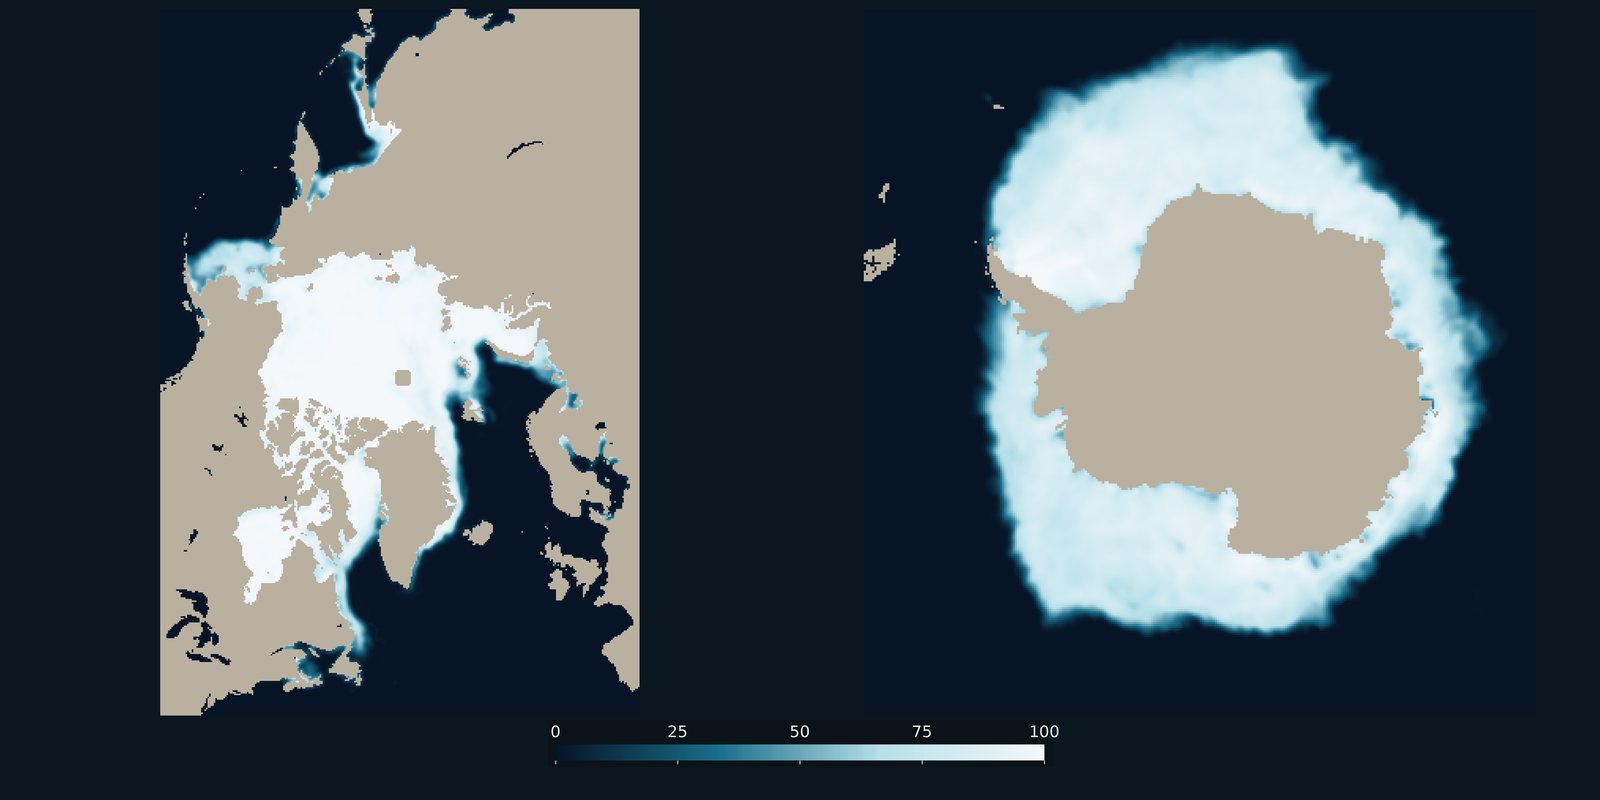
Sea-ice concentration for a recent Arctic March and Antarctic September, side by side. Frozen ocean cover, not surface temperature and not land ice.
Read the card →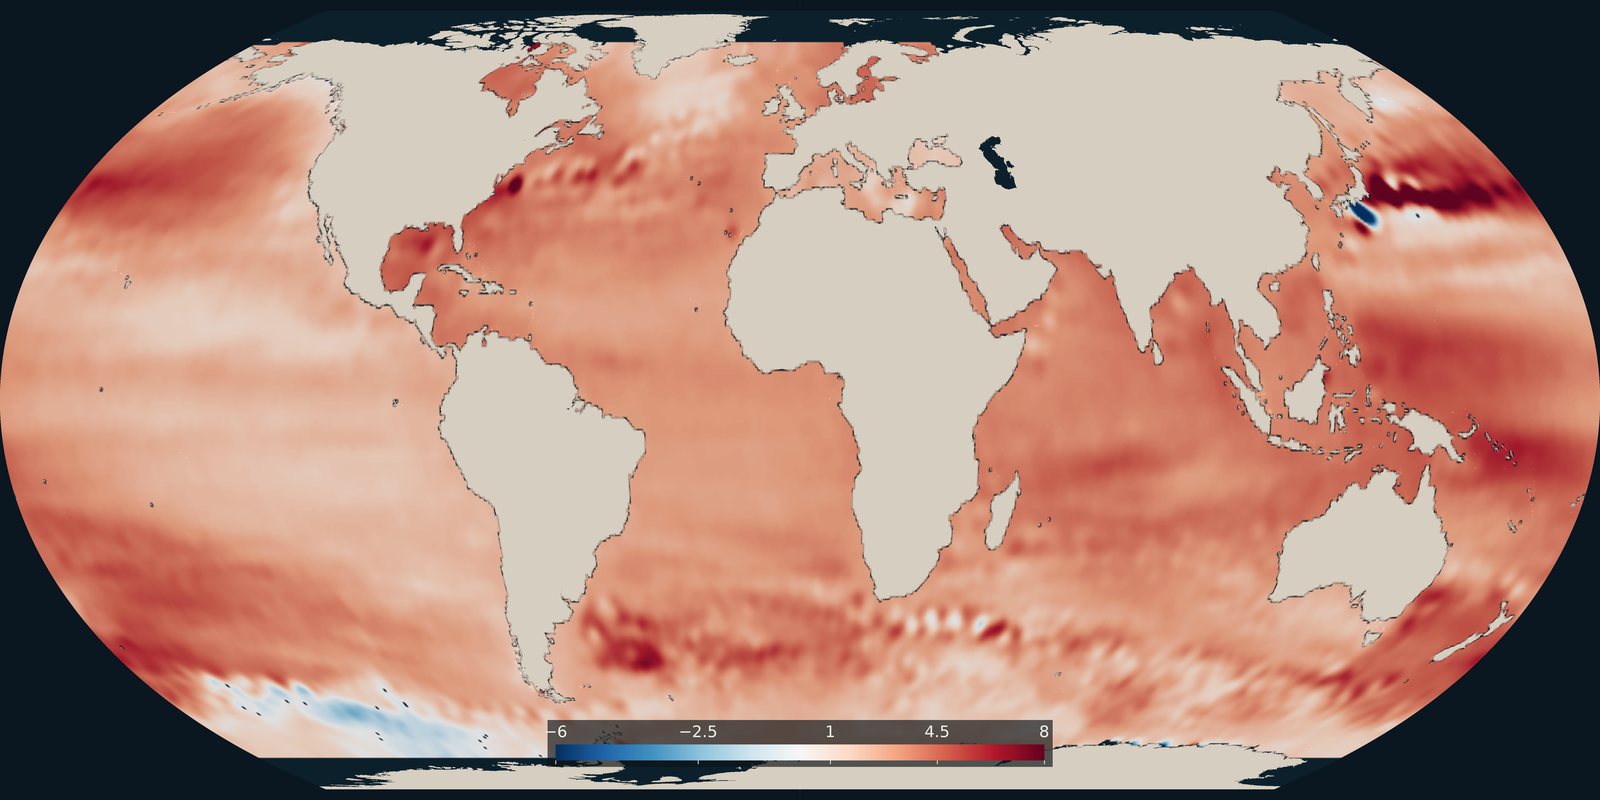
Where the ocean surface is rising faster or more slowly, in millimetres per year. The global average cited on this site comes from the NASA Sea Level Change Portal.
Read the card →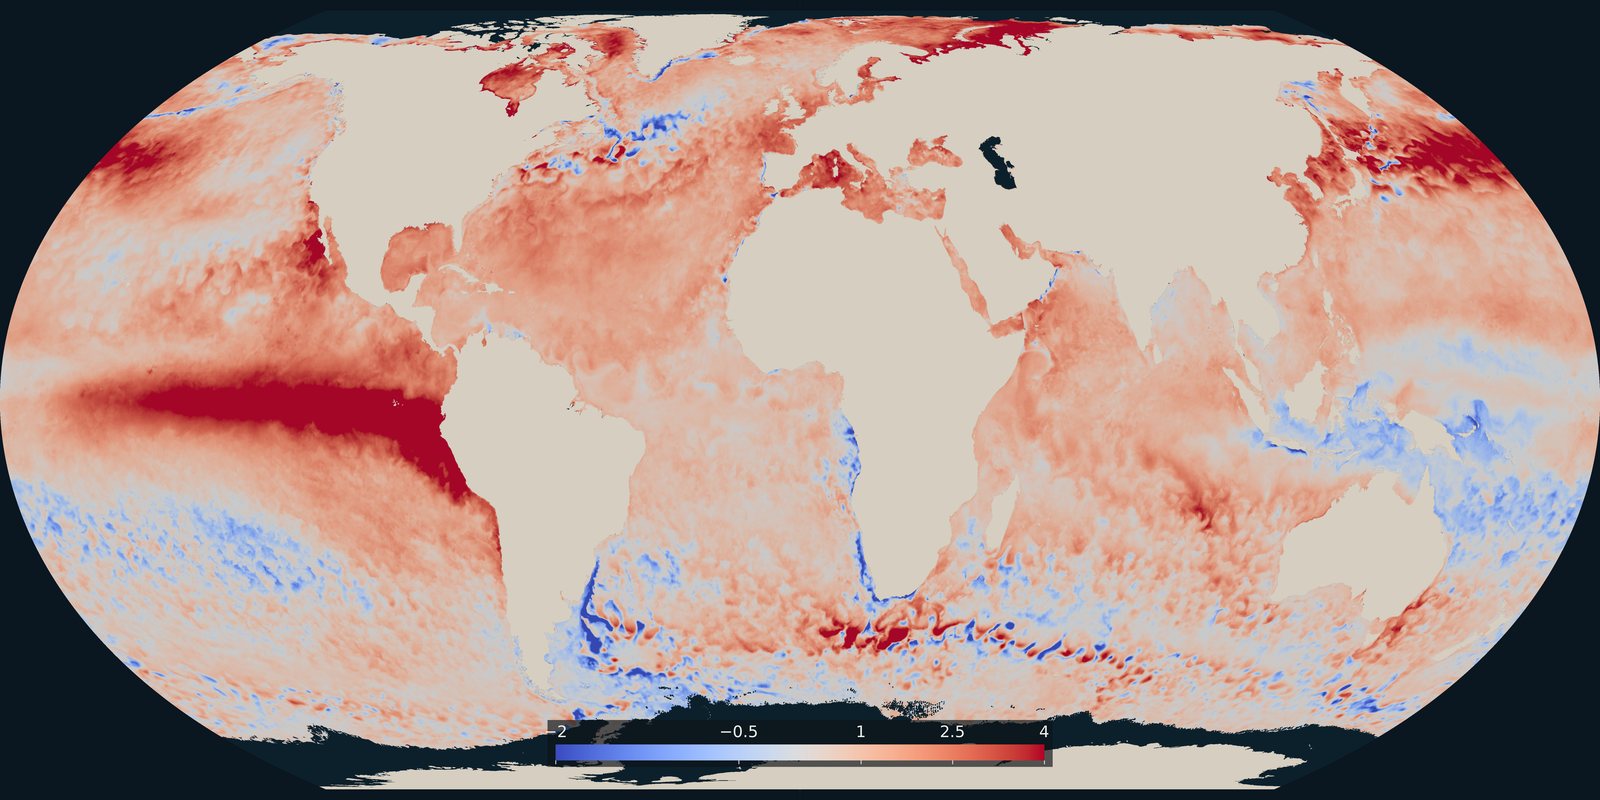
Where the sea surface was warmer or cooler than usual on 25 September 2026. A temperature anomaly from NOAA Coral Reef Watch, not a classified heatwave category.
Read the card →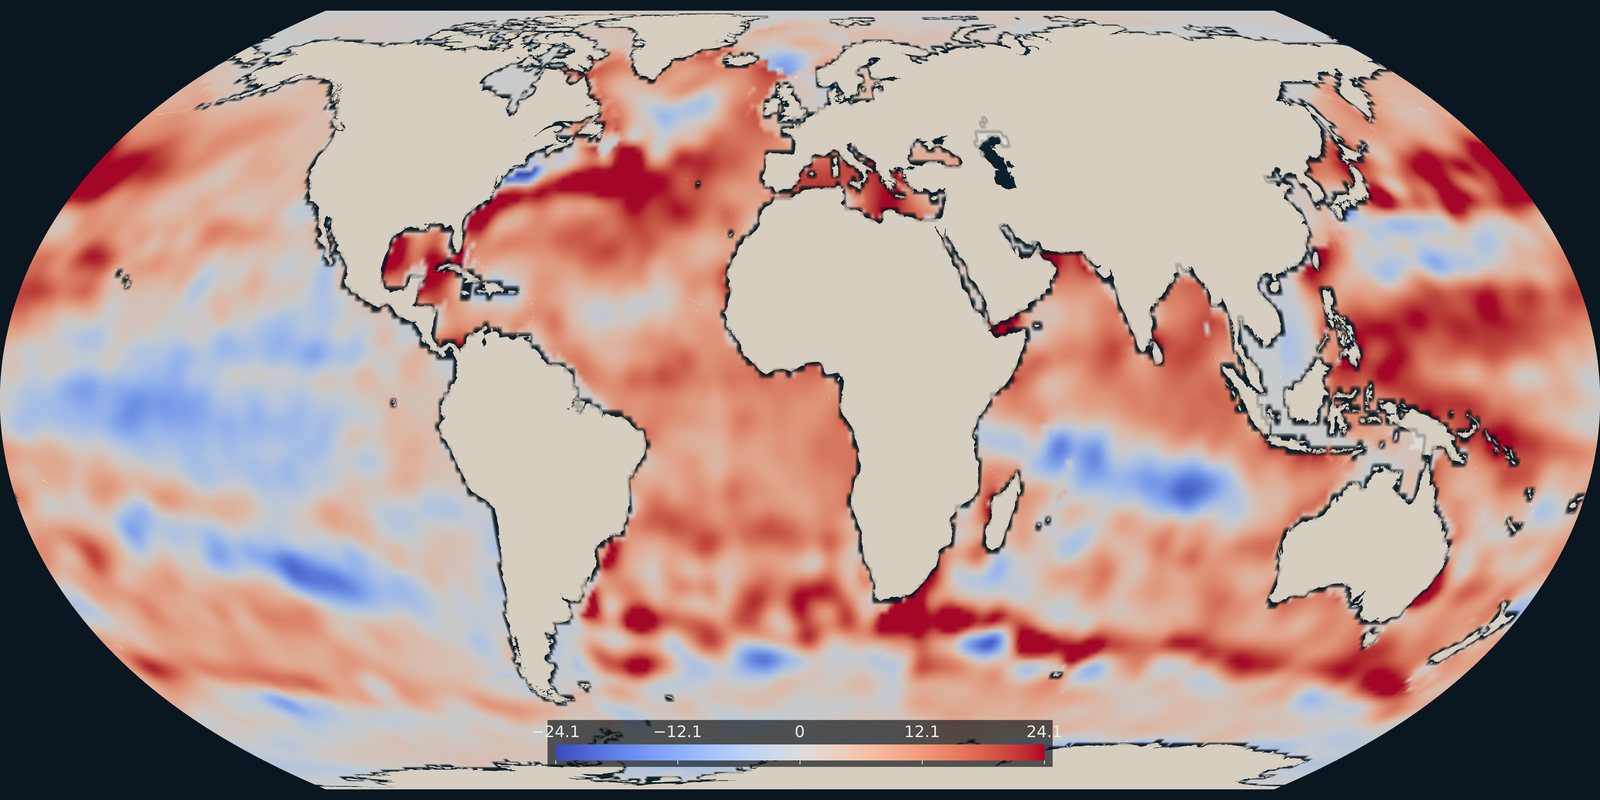
Heat stored in the upper 700 metres in 2025, as an anomaly in each 1° cell, from NOAA NCEI.
Read the card →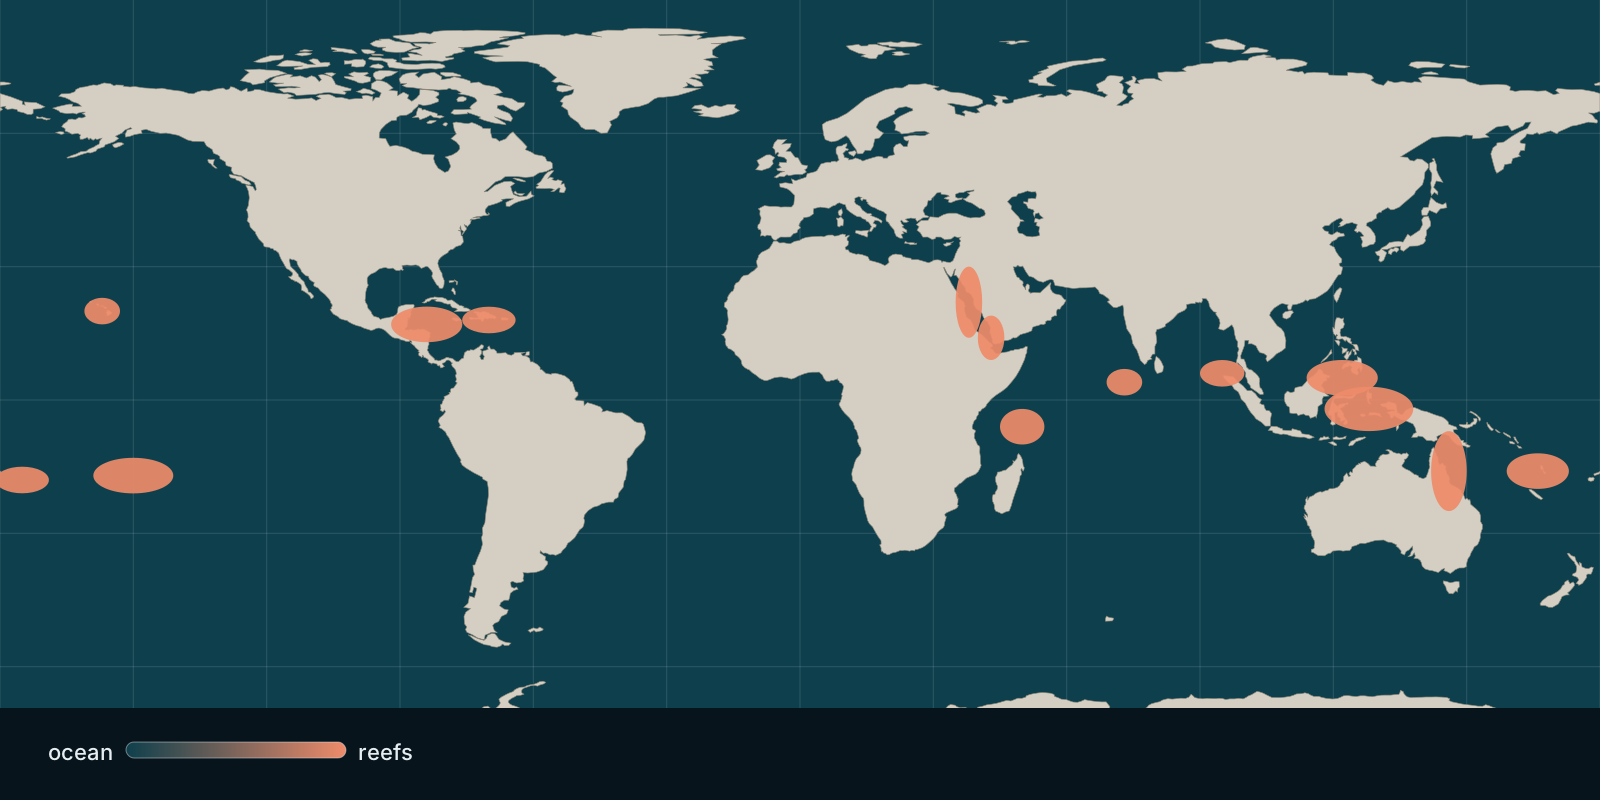 Fix Planet overview
Where hard coral cover stands today and how heat stress bleaches reefs, based on global monitoring and satellite observations.
Read the card →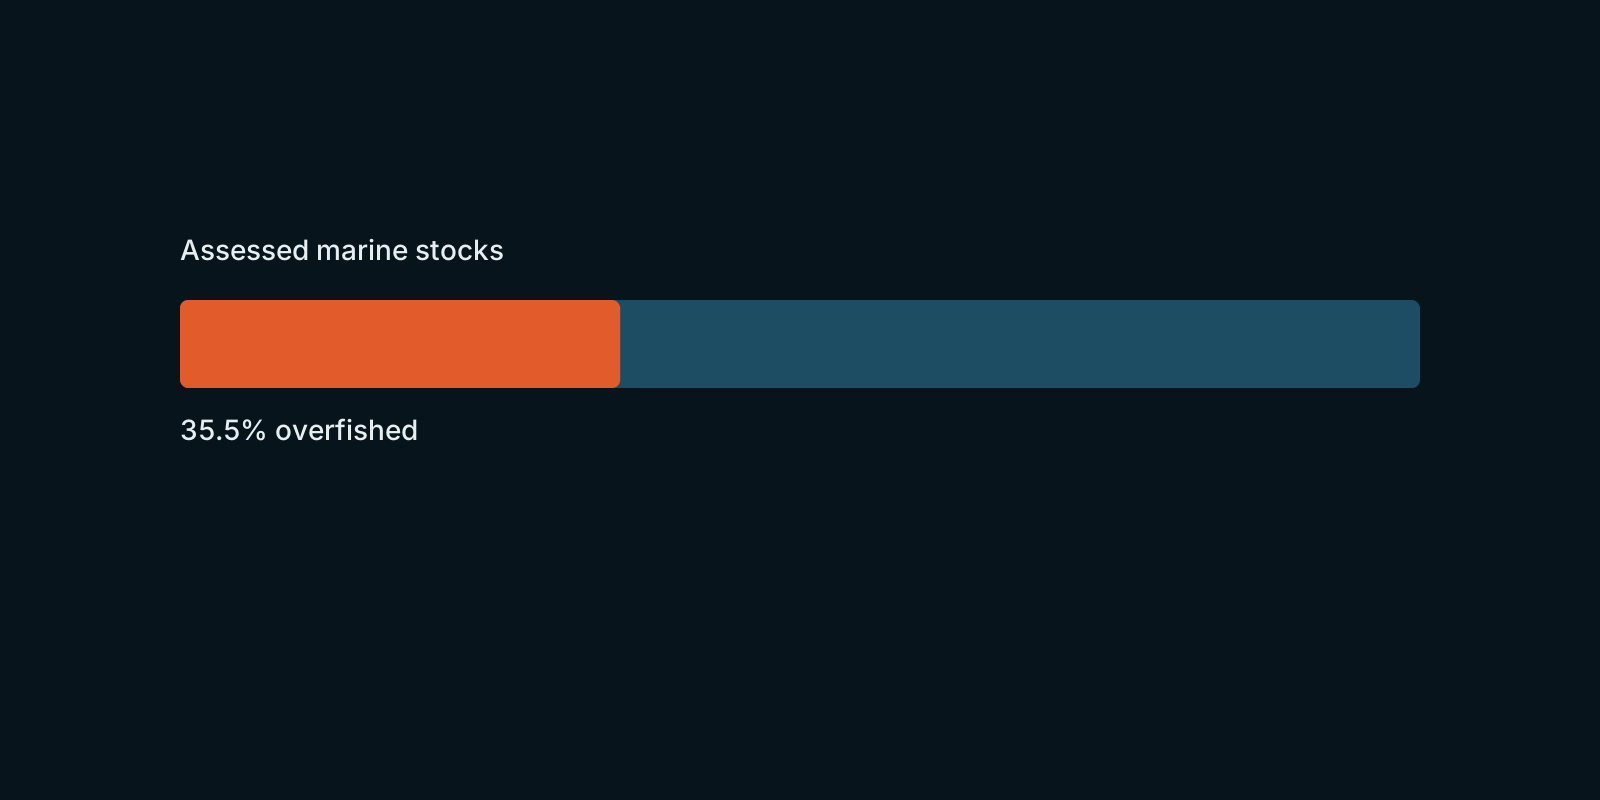 Fix Planet overview
How assessed marine fish stocks are doing worldwide, according to FAO’s global stock-status figures.
Read the card →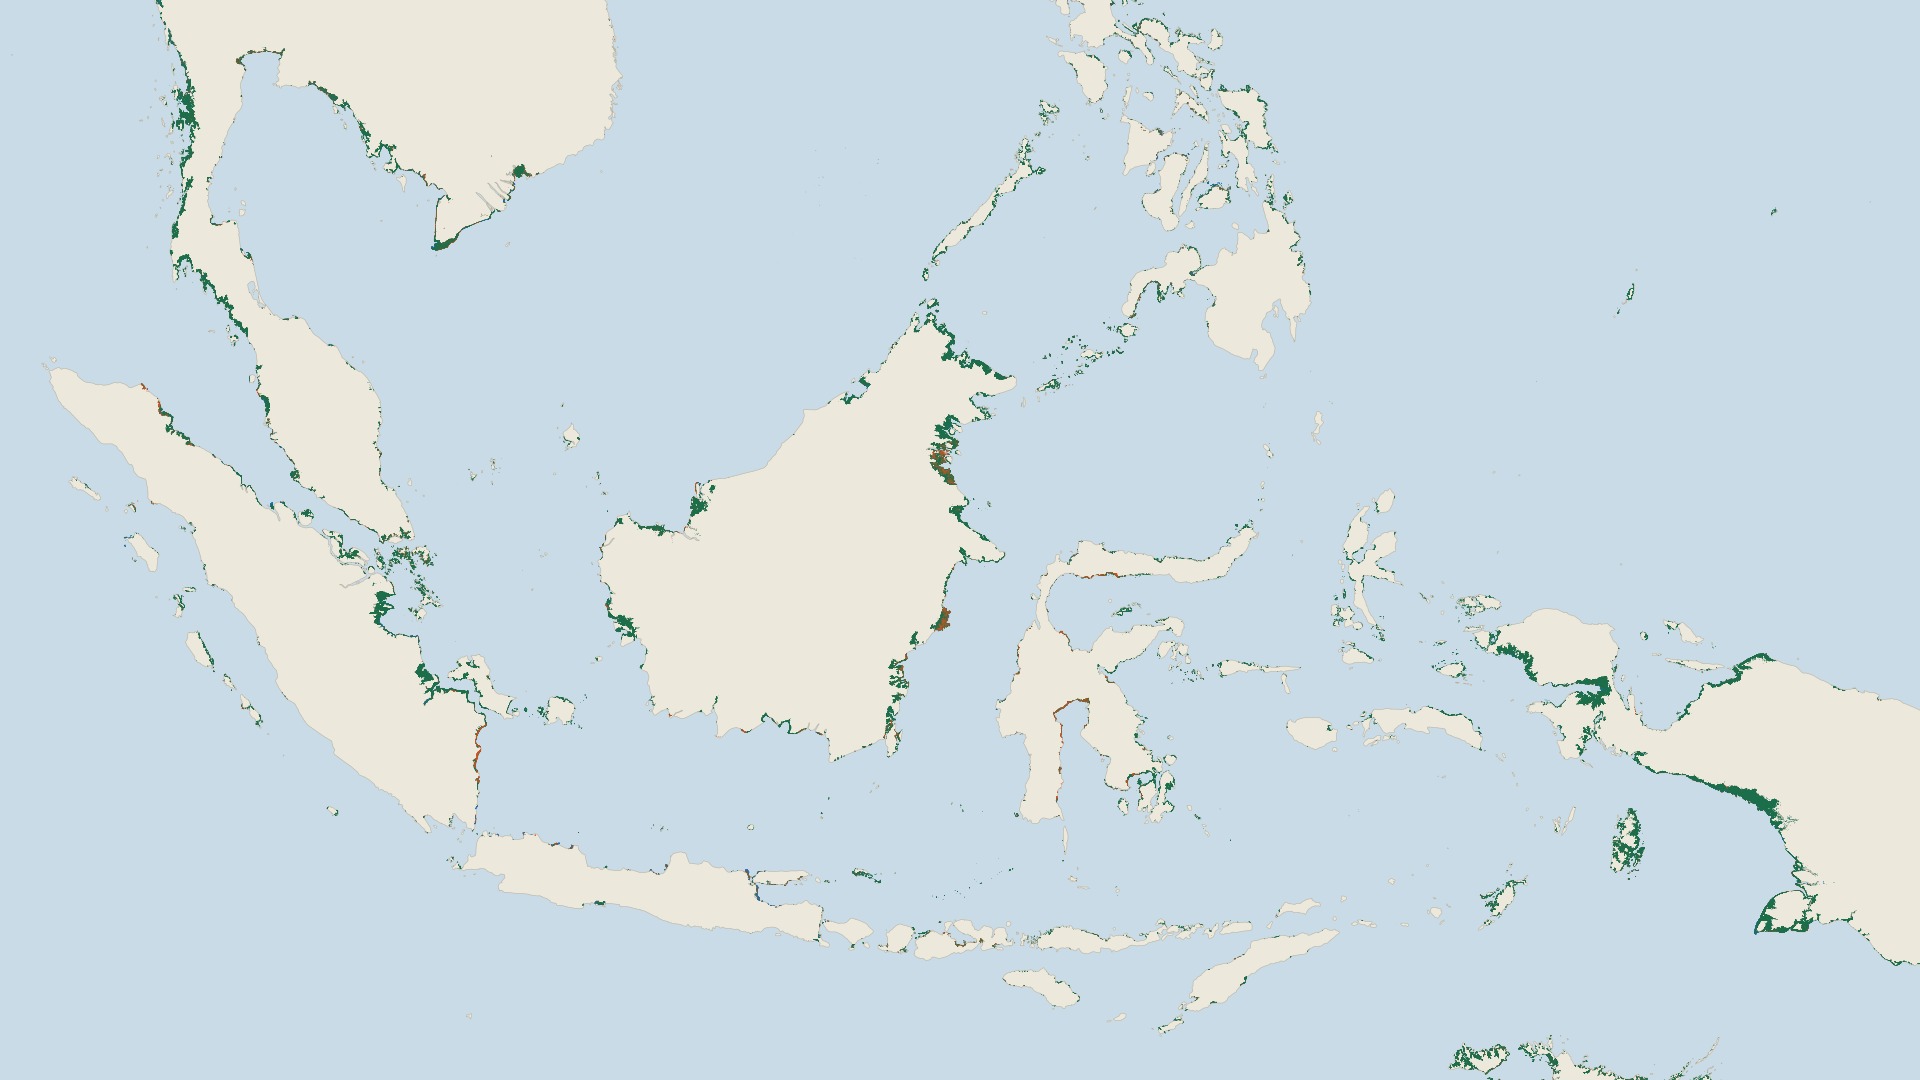
Where mangrove forests grow along tropical coasts and how their area has changed over four decades. Global Mangrove Watch reports a net gain of 47,707 hectares worldwide from 1985 to 2025, with large losses in some countries and gains in others.
Read the card →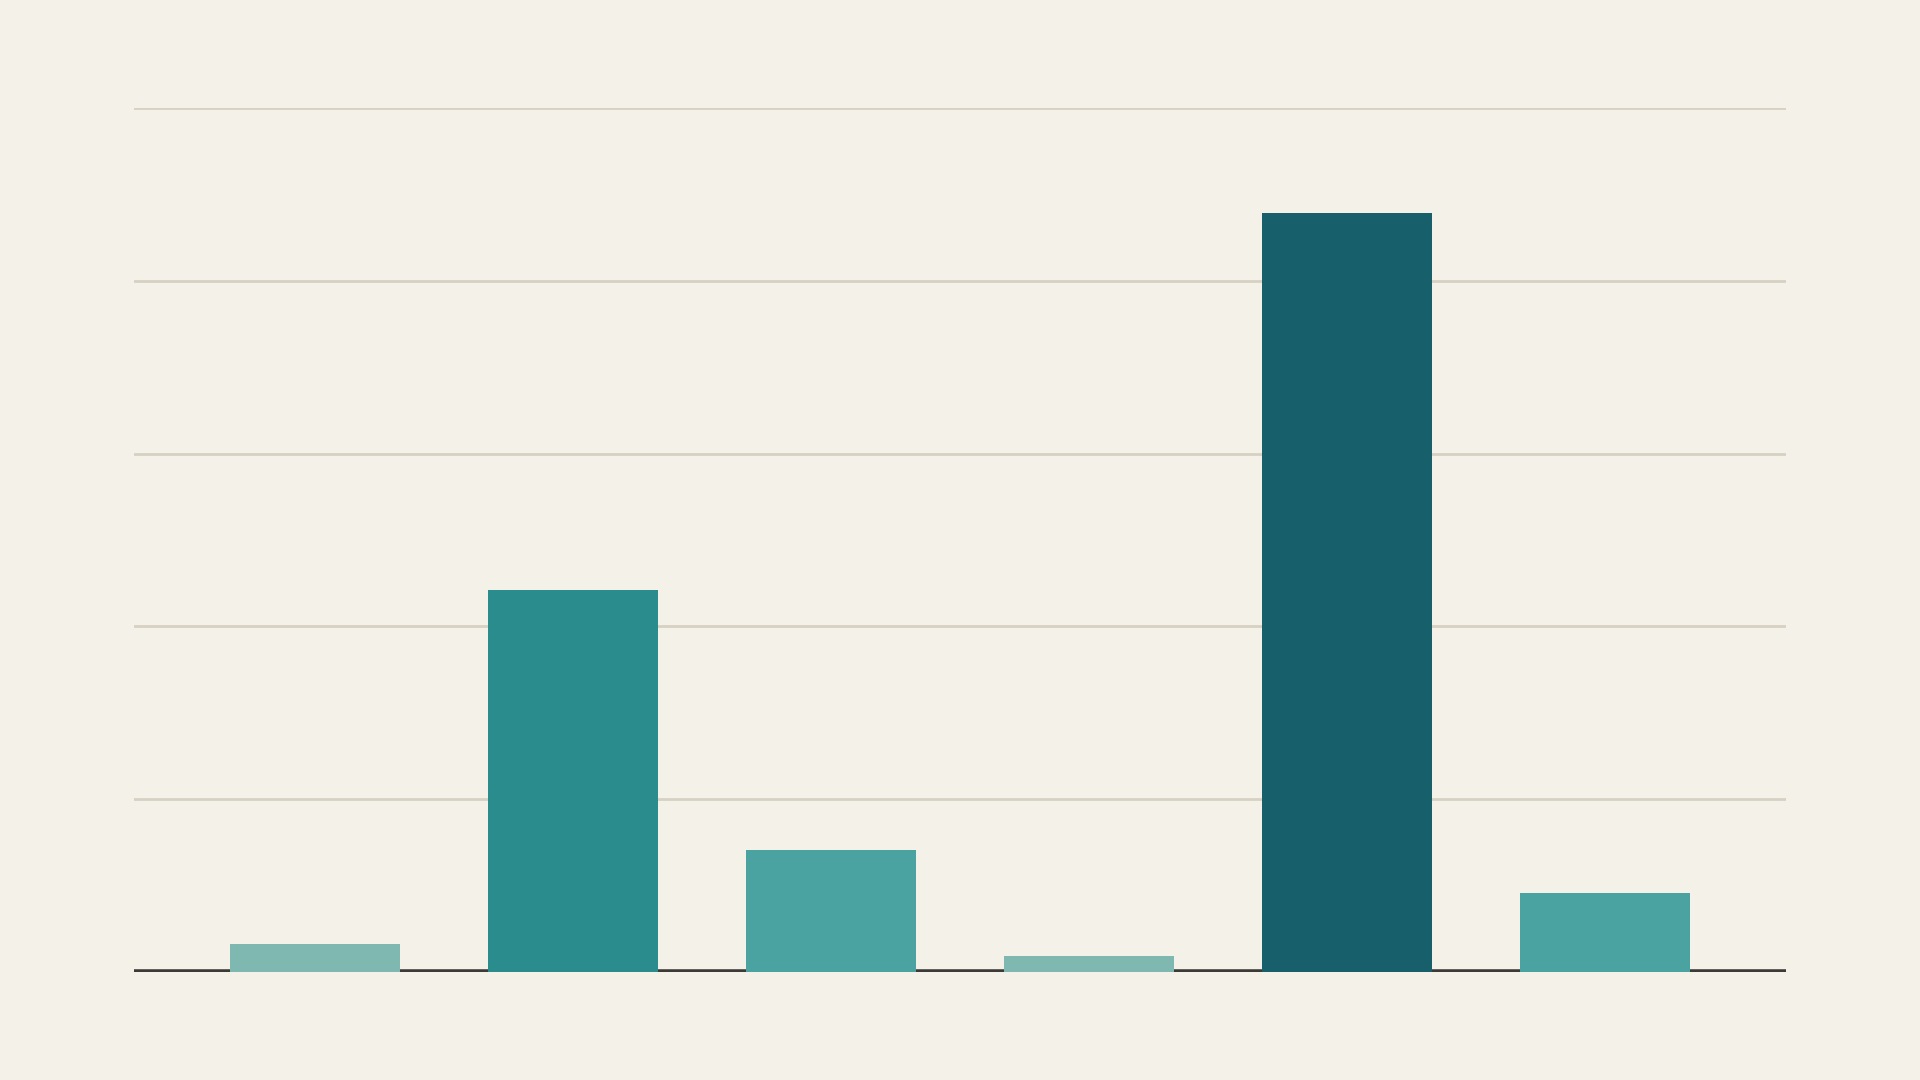
Where seagrass meadows have been mapped along the world’s coasts and how large the mapped area is. A 2020 global assessment found 160,387 km² mapped with moderate to high confidence, in 103 countries and territories.
Read the card →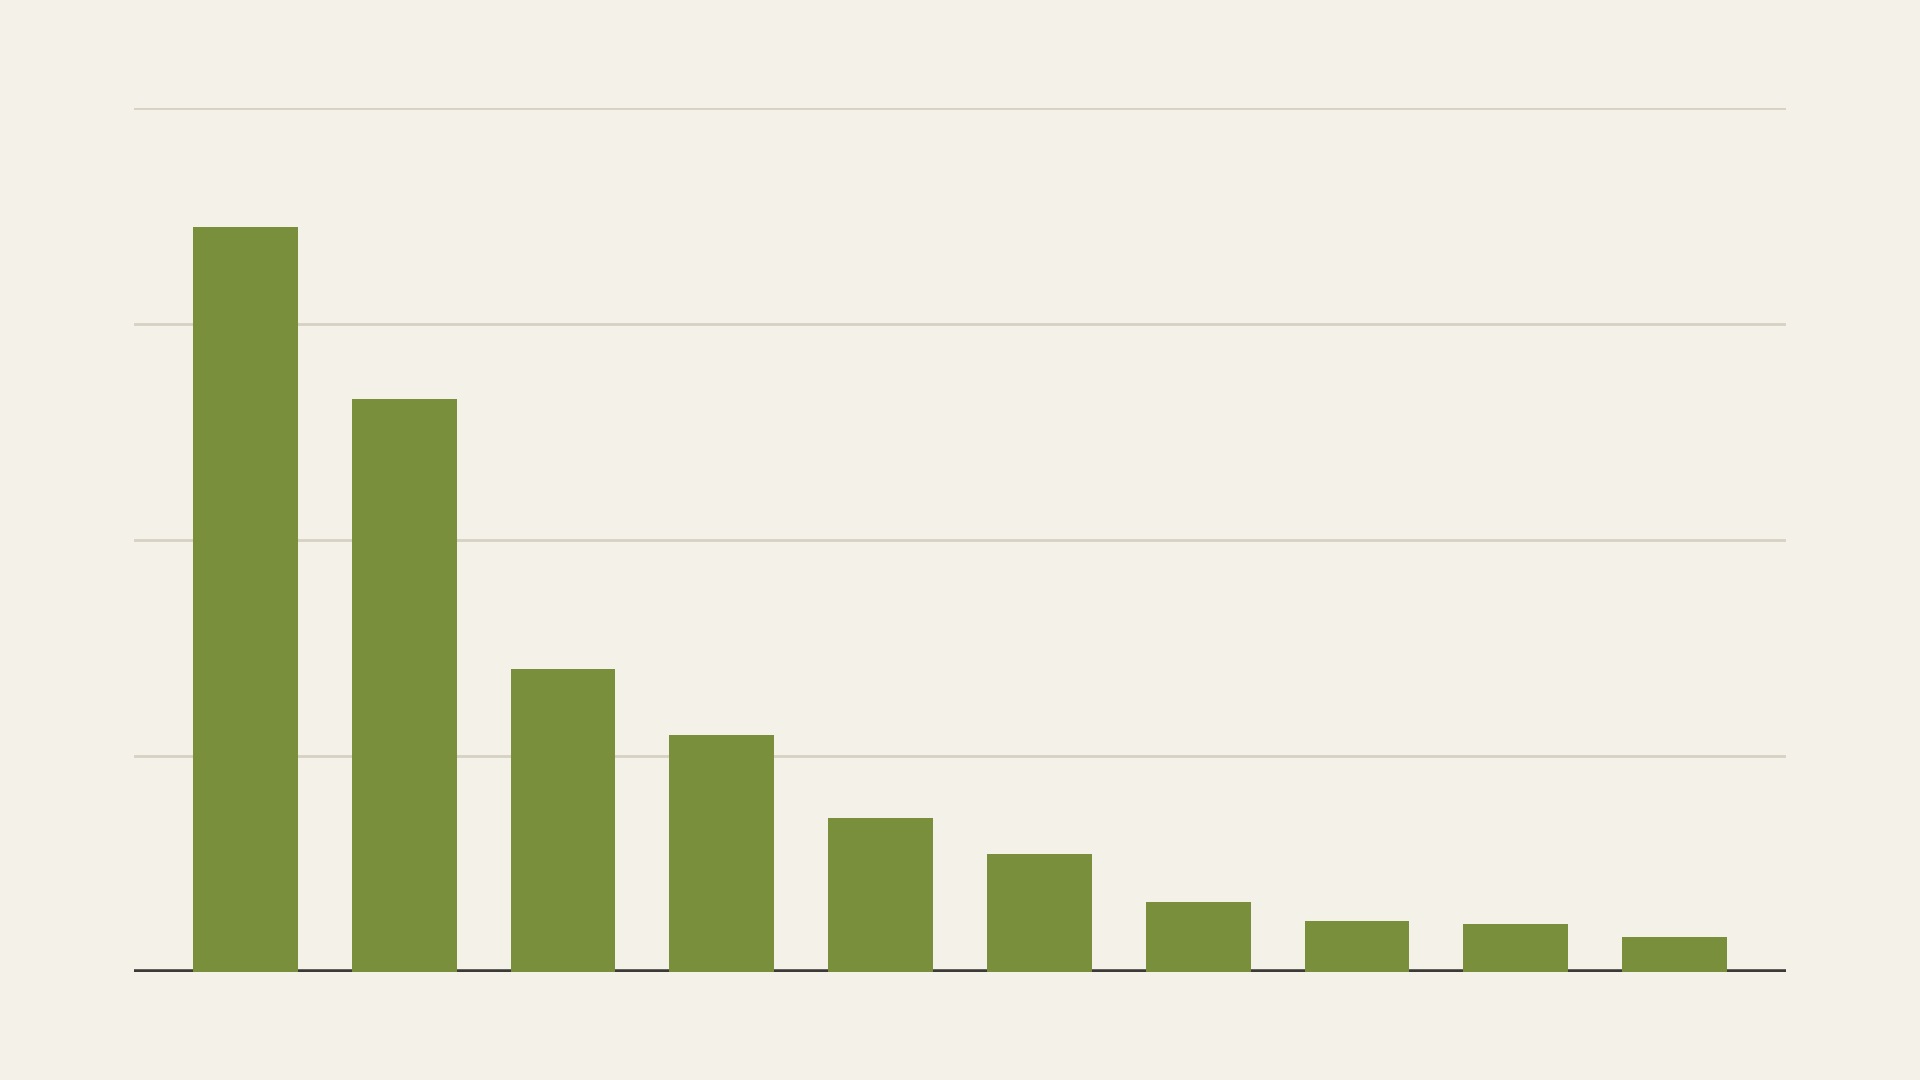
How much tidal salt marsh has been mapped worldwide. A 2017 global map records 5,495,089 hectares of salt marsh in 43 countries and territories, and notes occurrences in 99 countries.
Read the card →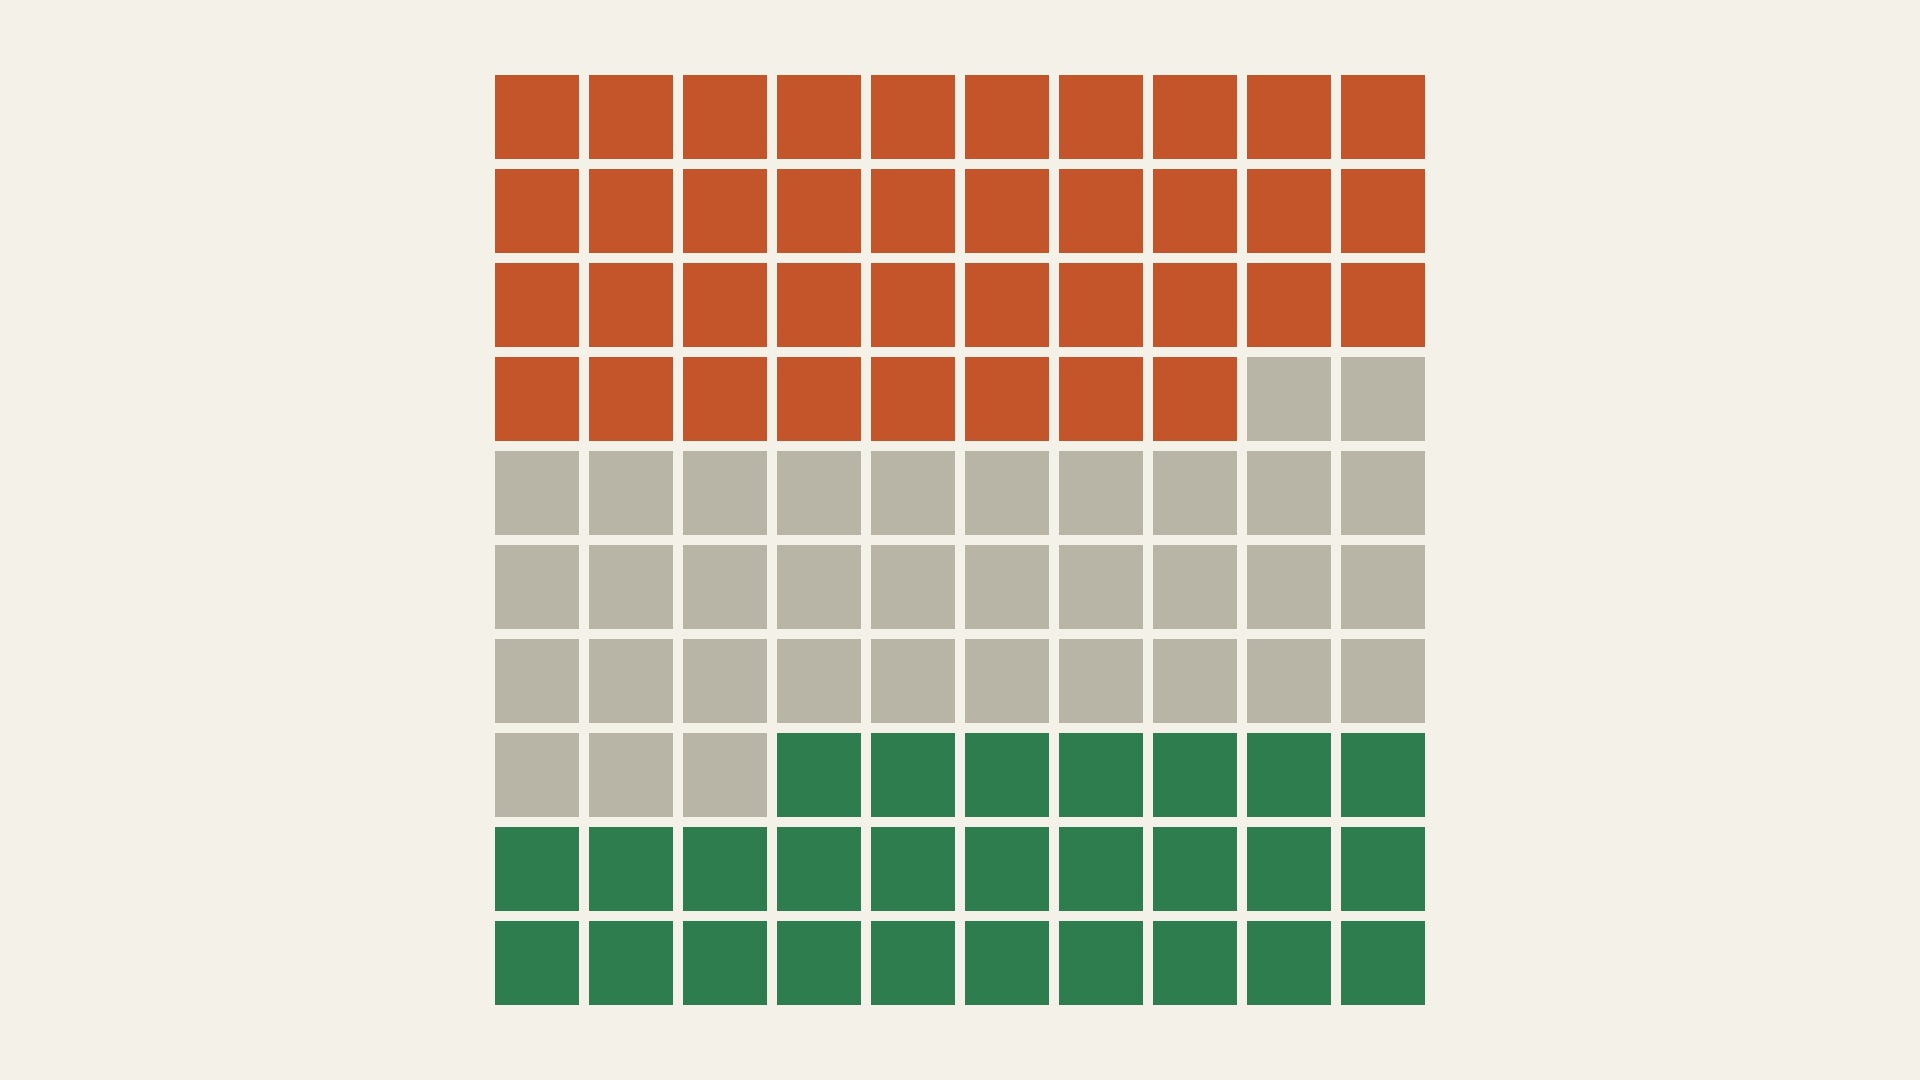
How kelp forests have changed at 1,138 monitored sites between 1952 and 2015. A 2016 global synthesis found a small average decline, with falls in 38 percent of ecoregions with data, rises in 27 percent and no detectable change in 35 percent.
Read the card →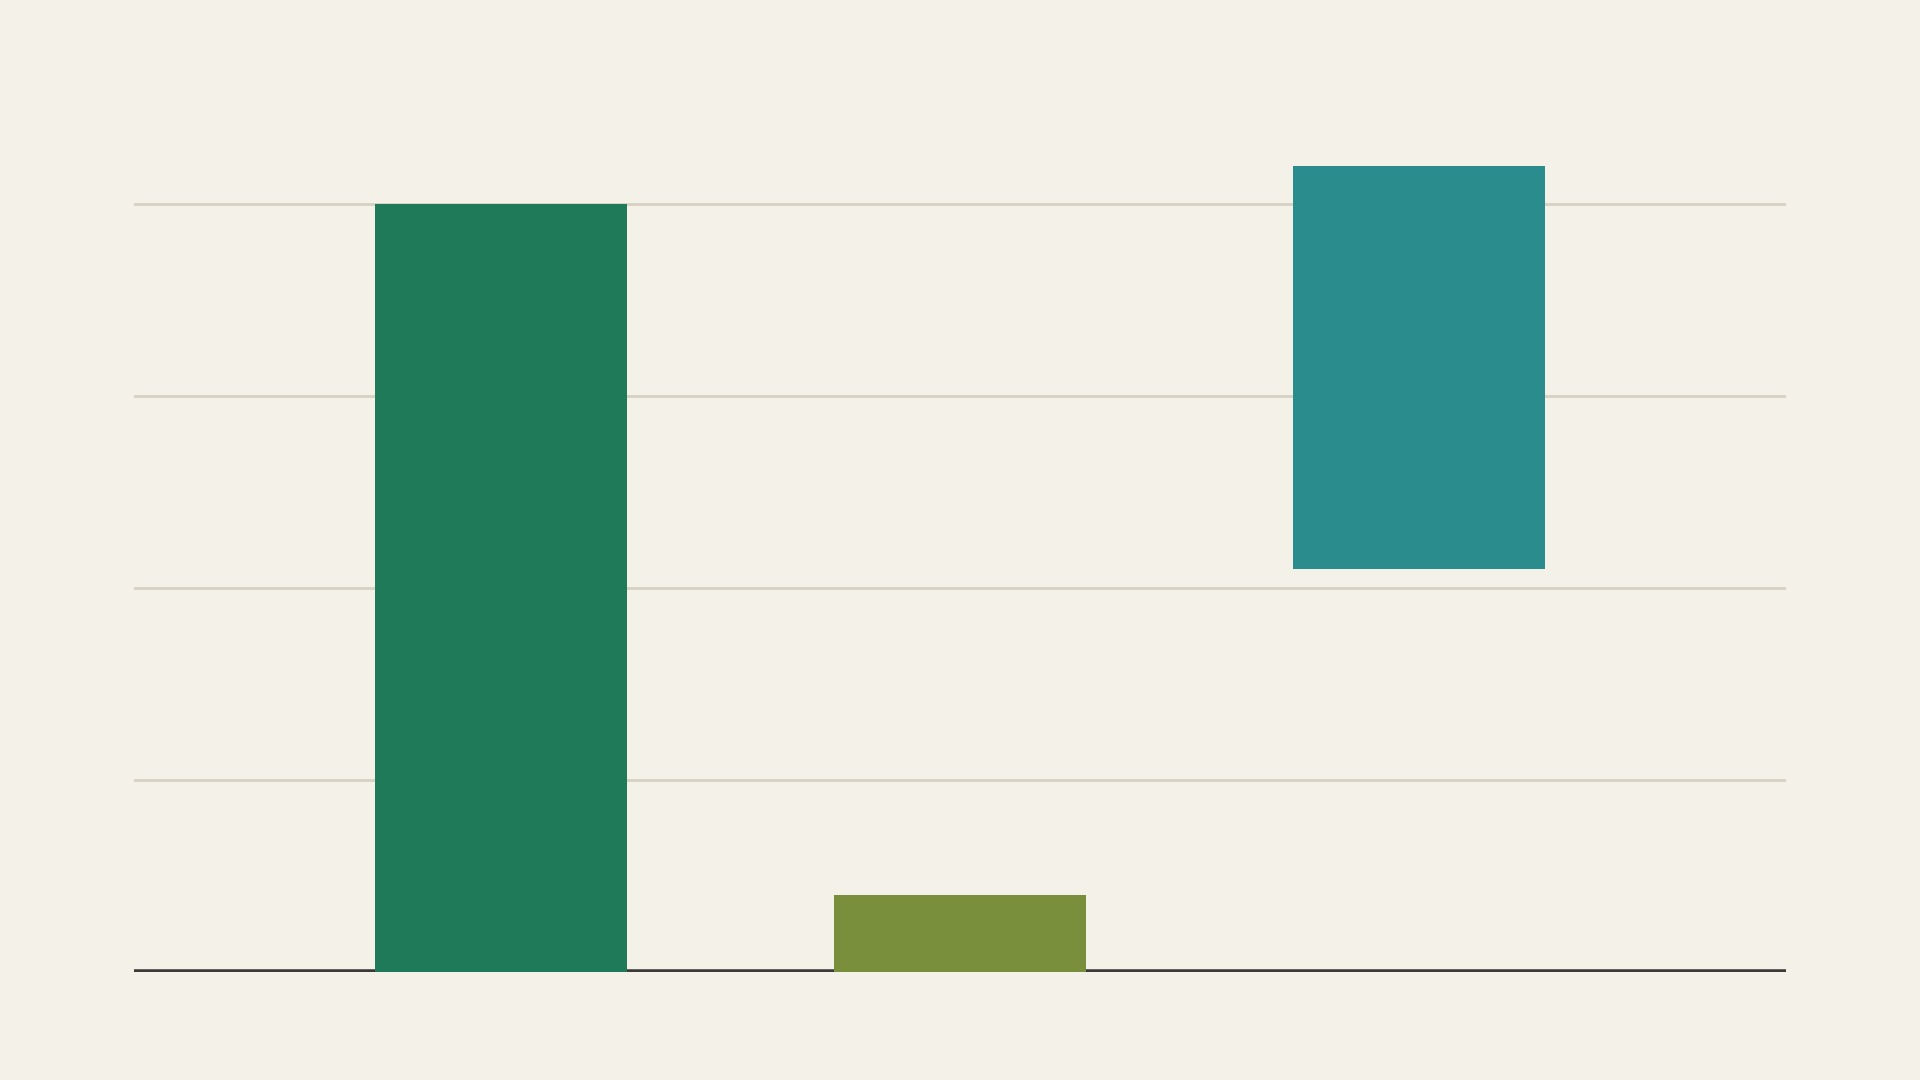
How much carbon mangroves, tidal salt marshes and seagrass meadows hold. The Intergovernmental Panel on Climate Change quotes about 8 billion tonnes of carbon in mangroves, about 0.8 billion in tidal marshes and from 4.2 to 8.4 billion in seagrass meadows.
Read the card →