← Oceans

Pollution

The ocean is polluted in several different ways: persistent plastics, oil from wells and ships, extra nutrients that fuel algal blooms, and the hypoxia that follows when that organic matter decays.

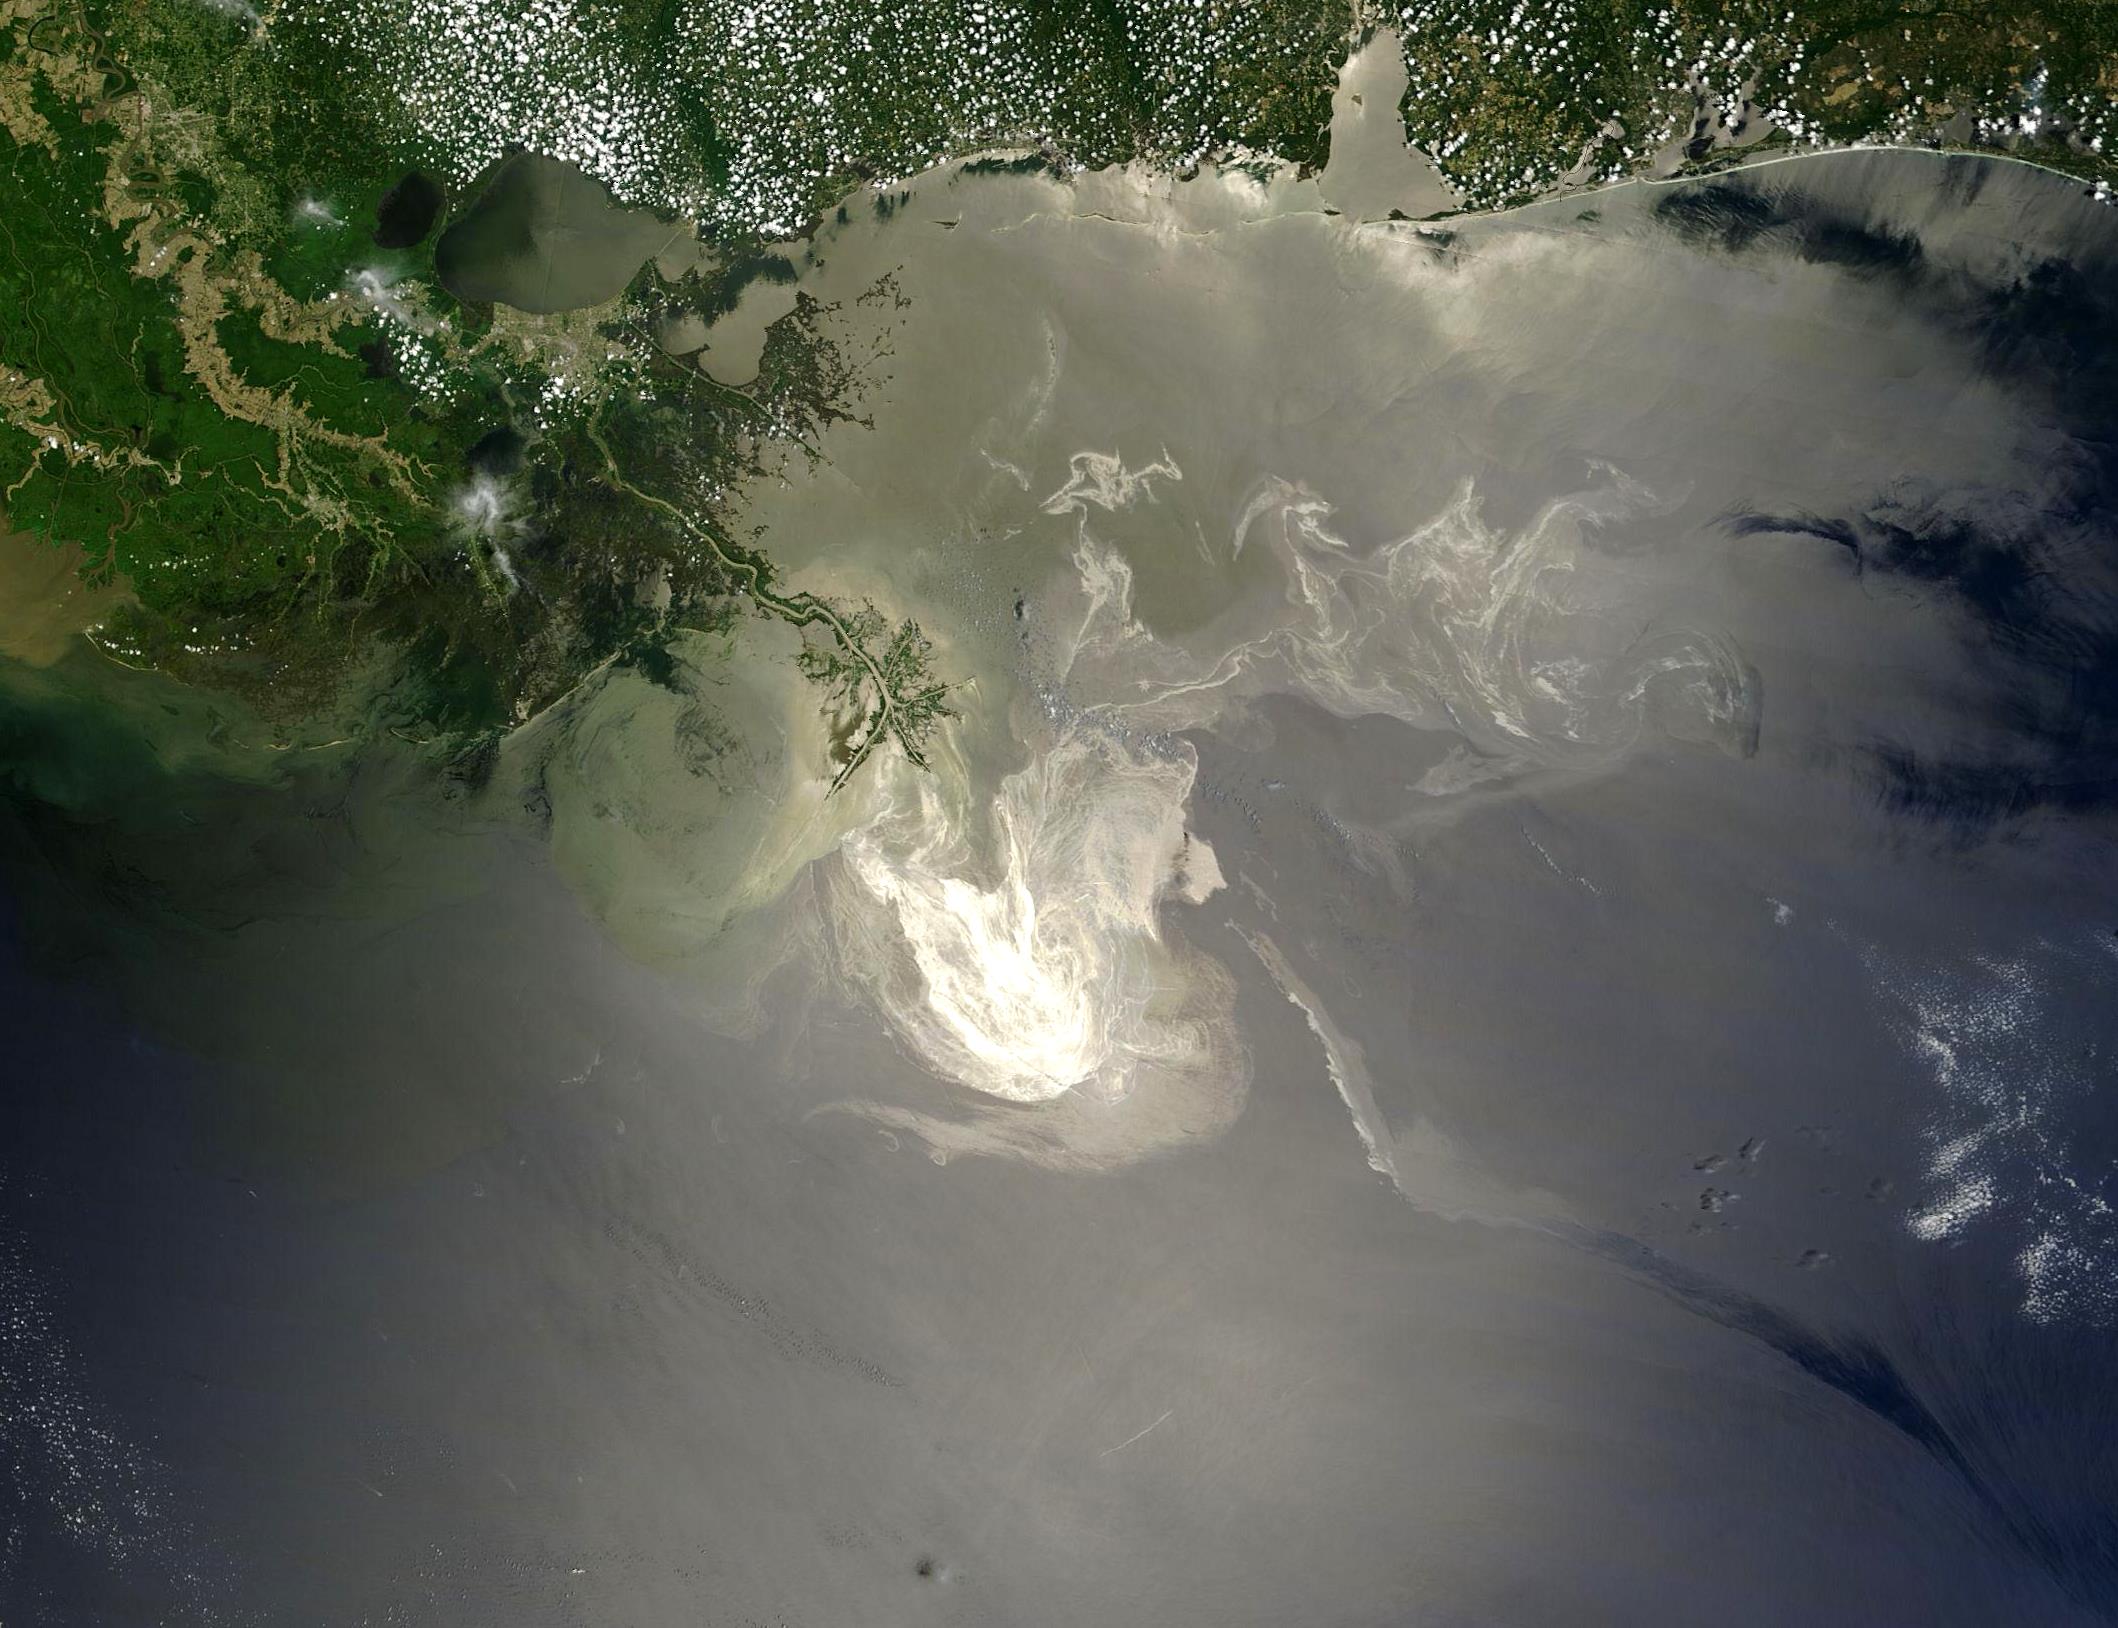
No single map shows all of that. The figures below are separate datasets. The first answers a common question: there are five major subtropical garbage patches: zones of higher plastic concentration in the great gyres, not floating islands. Then a closer North Pacific model, one observed oil spill, a chlorophyll-a composite, and a compilation of coastal dead zones.

Five figures: five-gyre plastics (Eriksen 2014), North Pacific model (Lebreton 2018), one oil spill, chlorophyll-a, compiled hypoxia.

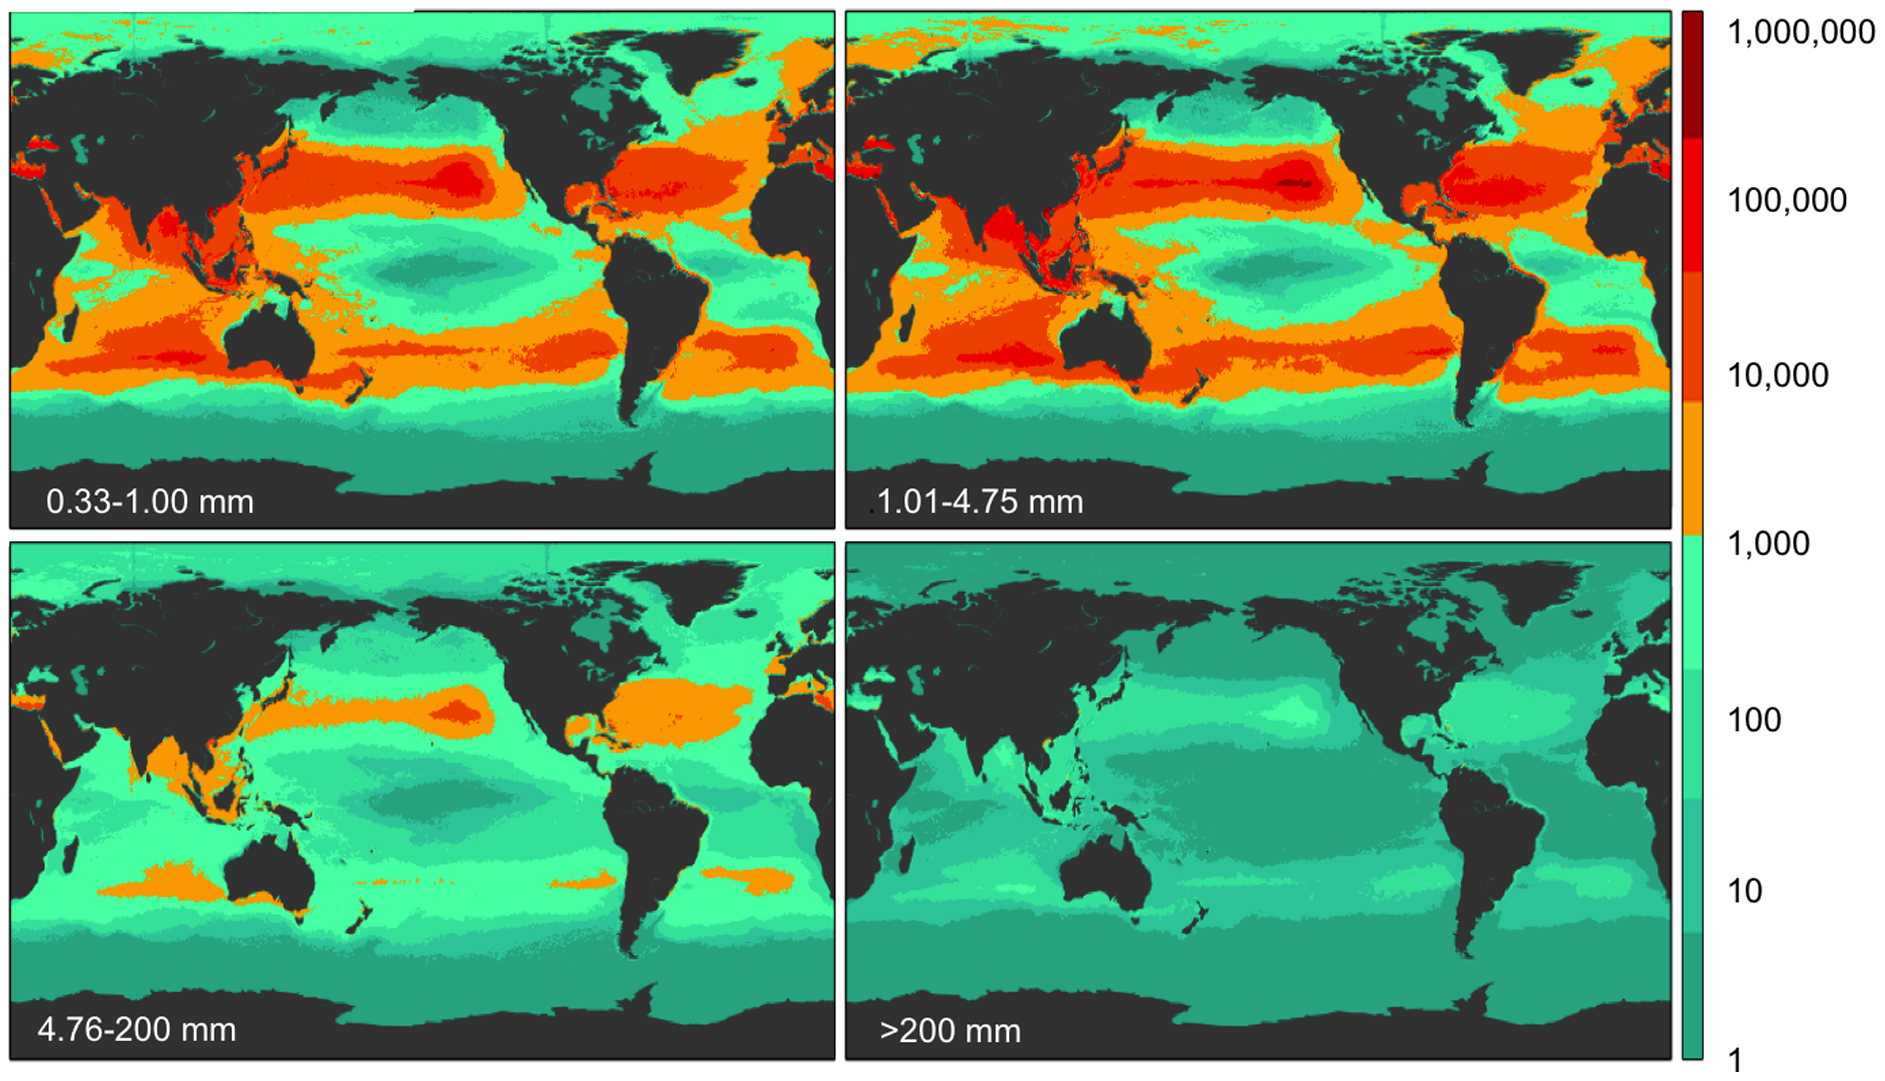
Four world maps of modelled floating-plastic count density in four size classes, orange-red accumulations in five subtropical gyres
Eriksen et al. 2014, PLOS ONE. Modelled count density (pieces/km²) in four size classes. CC0. Sampling 2007-2013; not a satellite photo of trash islands. NOAA education materials describe the same five subtropical gyres.
Eriksen et al. 2014 2007-2013 surveys; 2014 model

Five garbage patches

There are five major subtropical gyres with elevated floating plastic: North Pacific, South Pacific, North Atlantic, South Atlantic, and Indian Ocean. A garbage patch is a zone of higher concentration of mostly small fragments, not a solid floating island. The maps are Eriksen et al. 2014: modelled count density (pieces/km²) by size class, from net tows and visual surveys across all five gyres. The North Pacific patch is the best studied; a western buildup near Japan is part of that same gyre, not a sixth subtropical patch. Arctic and Barents concentrations are sometimes discussed separately and are not one of these five.

Great Pacific Garbage Patch: North Pacific model ↓

https://doi.org/10.1371/journal.pone.0111913
License: CC0 1.0
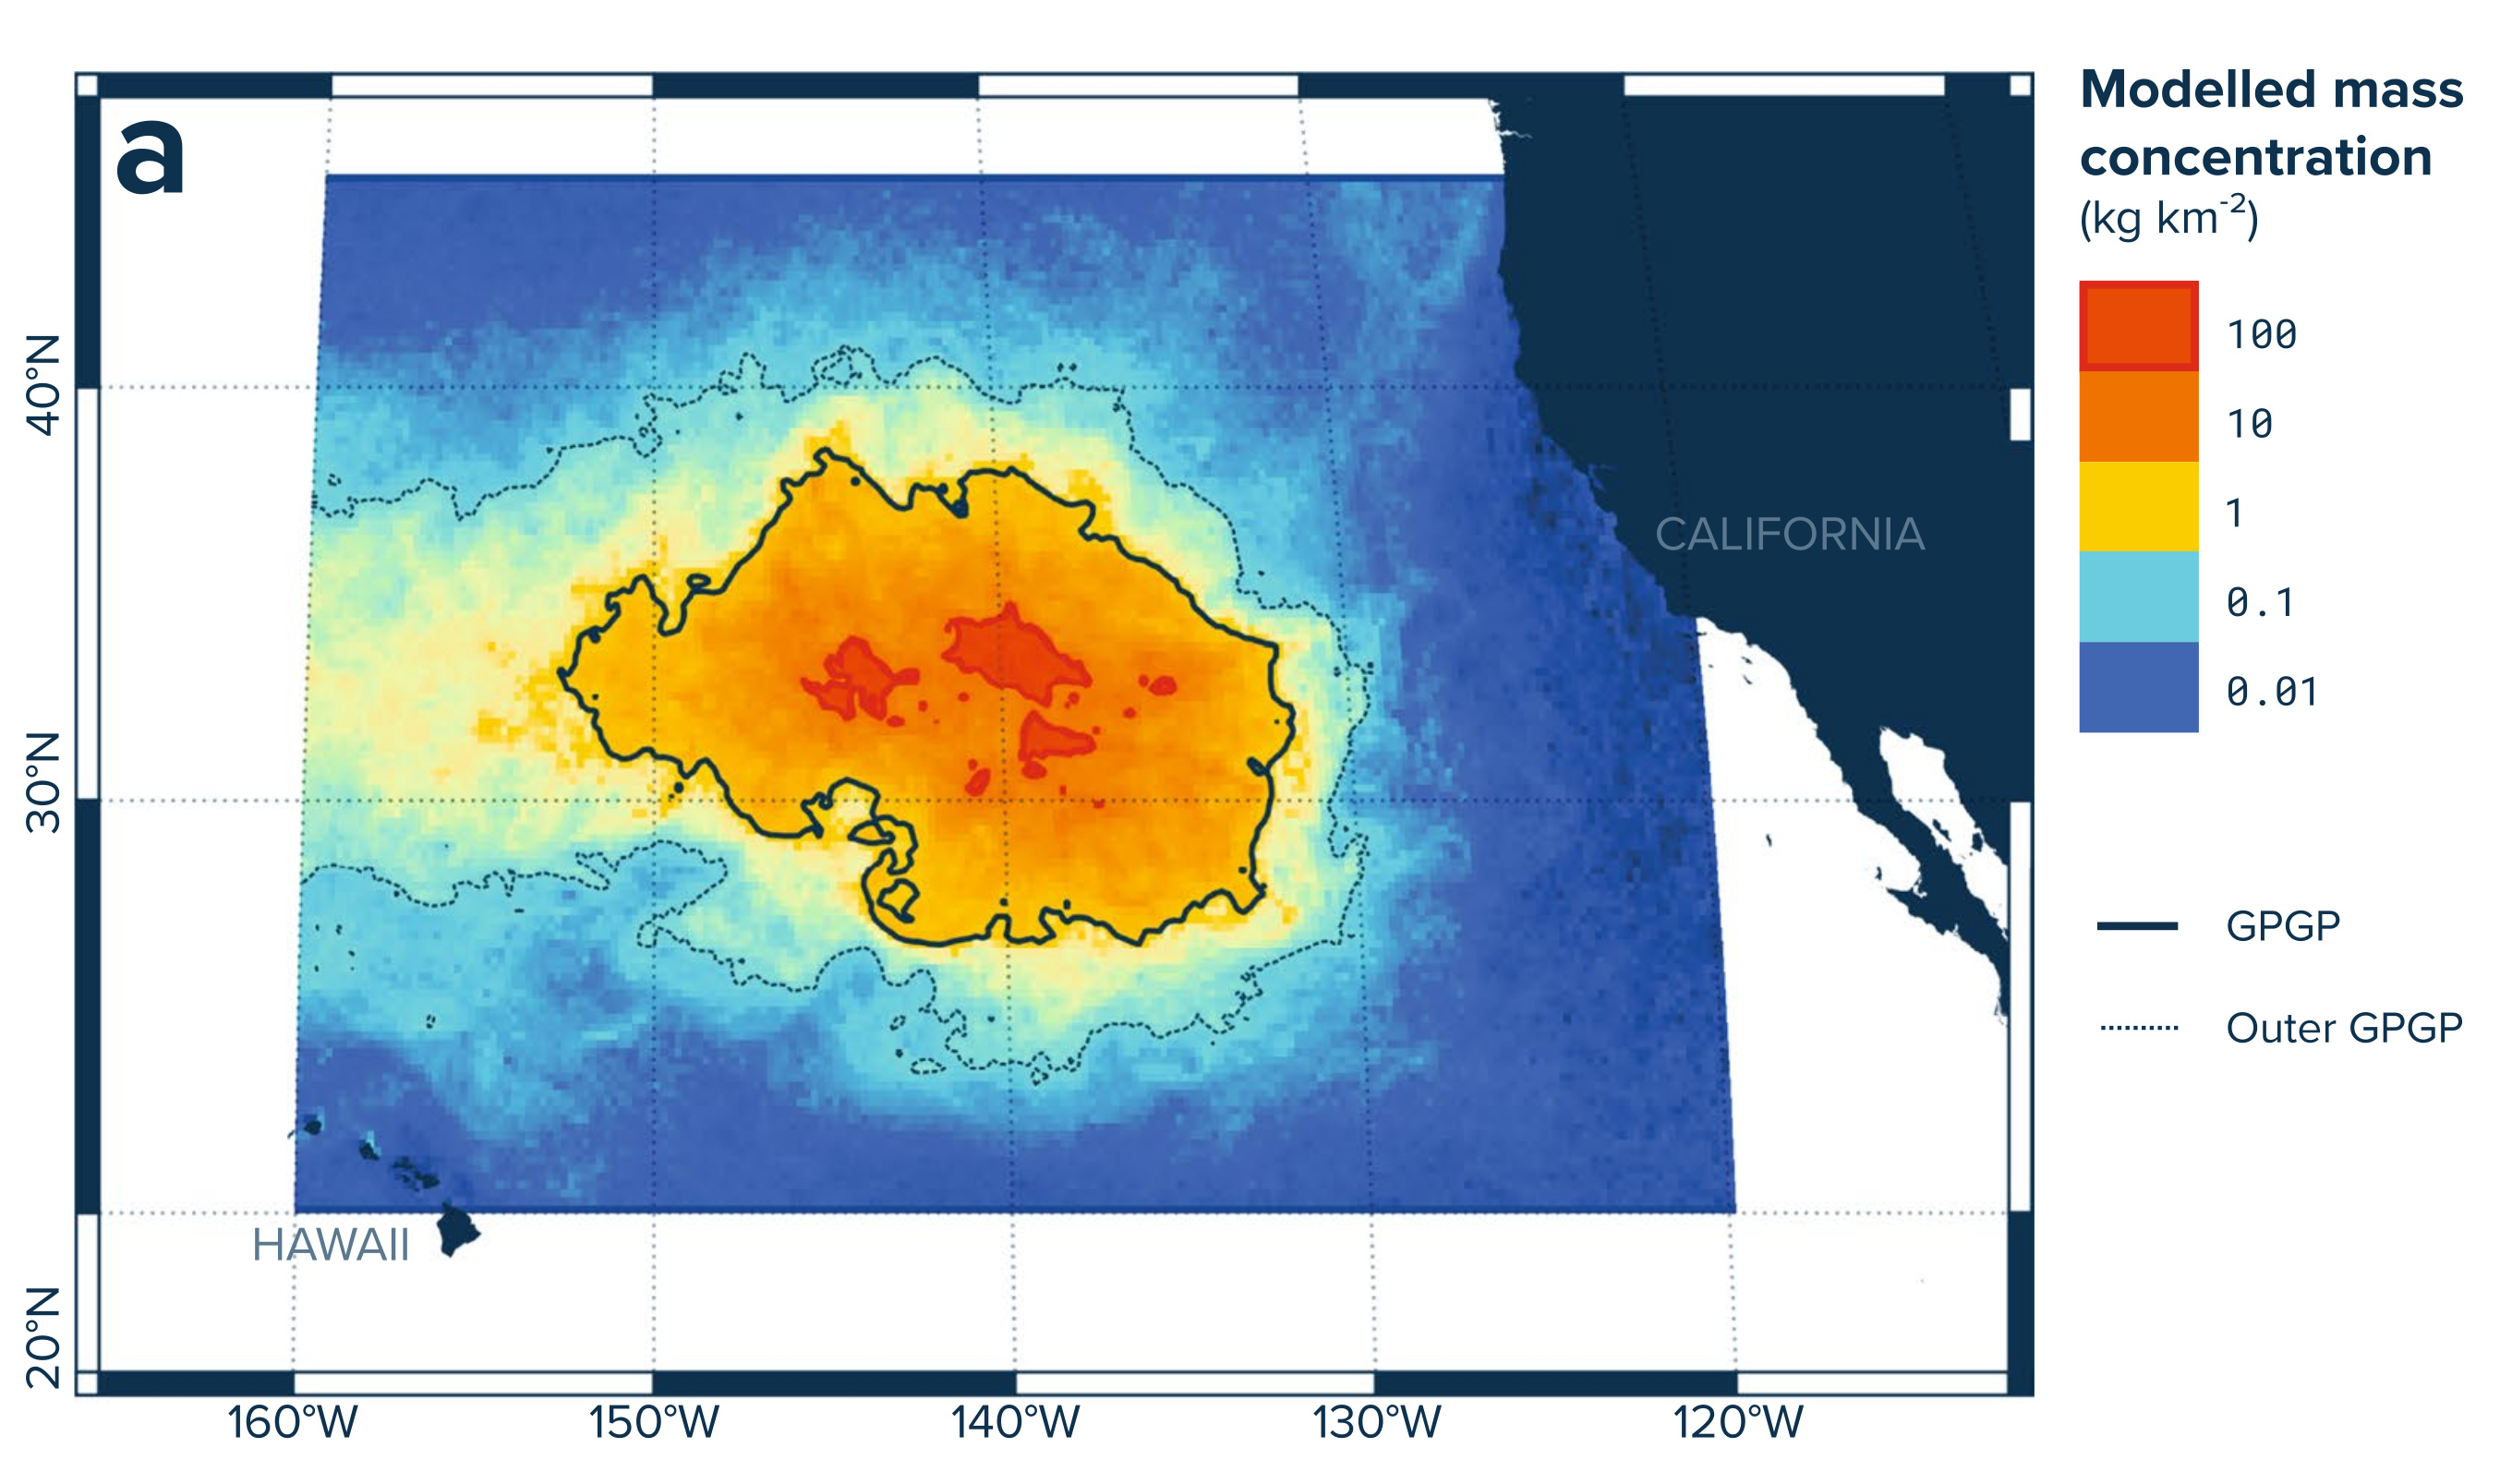
Contour map of modelled plastic mass concentration between Hawaii and California, red core labeled GPGP
Lebreton et al. 2018, Scientific Reports. Modelled mass concentration, North Pacific, August 2015. CC BY 4.0.
Lebreton et al. 2018 August 2015 model

Great Pacific Garbage Patch

The Great Pacific Garbage Patch, between Hawaii and California, is the best-studied of the five subtropical accumulations: water with more debris in the North Pacific gyre, not a solid island. A western concentration near Japan belongs to the same gyre. Most of the plastic is small fragments. The map shows modelled mass concentration (kg/km²) for August 2015.

Five subtropical garbage patches ↑

https://doi.org/10.1038/s41598-018-22939-w
License: CC BY 4.0

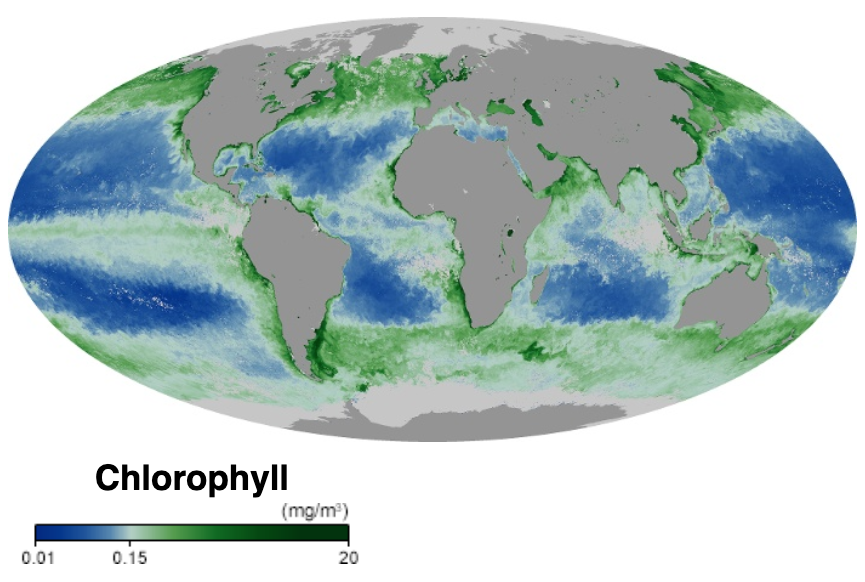
Mollweide world map of ocean chlorophyll: blue gyres, green coasts and high latitudes, gray land
NASA ocean color chlorophyll-a concentration, October 2019. Public domain. Units mg/m³.
NASA chlorophyll-a October 2019

Chlorophyll

Phytoplankton need light and nutrients. Chlorophyll-a, the green pigment in those cells, is mapped from ocean color. High values often mark upwelling, river plumes, and blooms; the clear subtropical gyres are low. Chlorophyll is a living-biomass proxy, not a nitrate or phosphate map, and not a dead zone.

https://oceancolor.gsfc.nasa.gov/
License: Public domain (NASA)

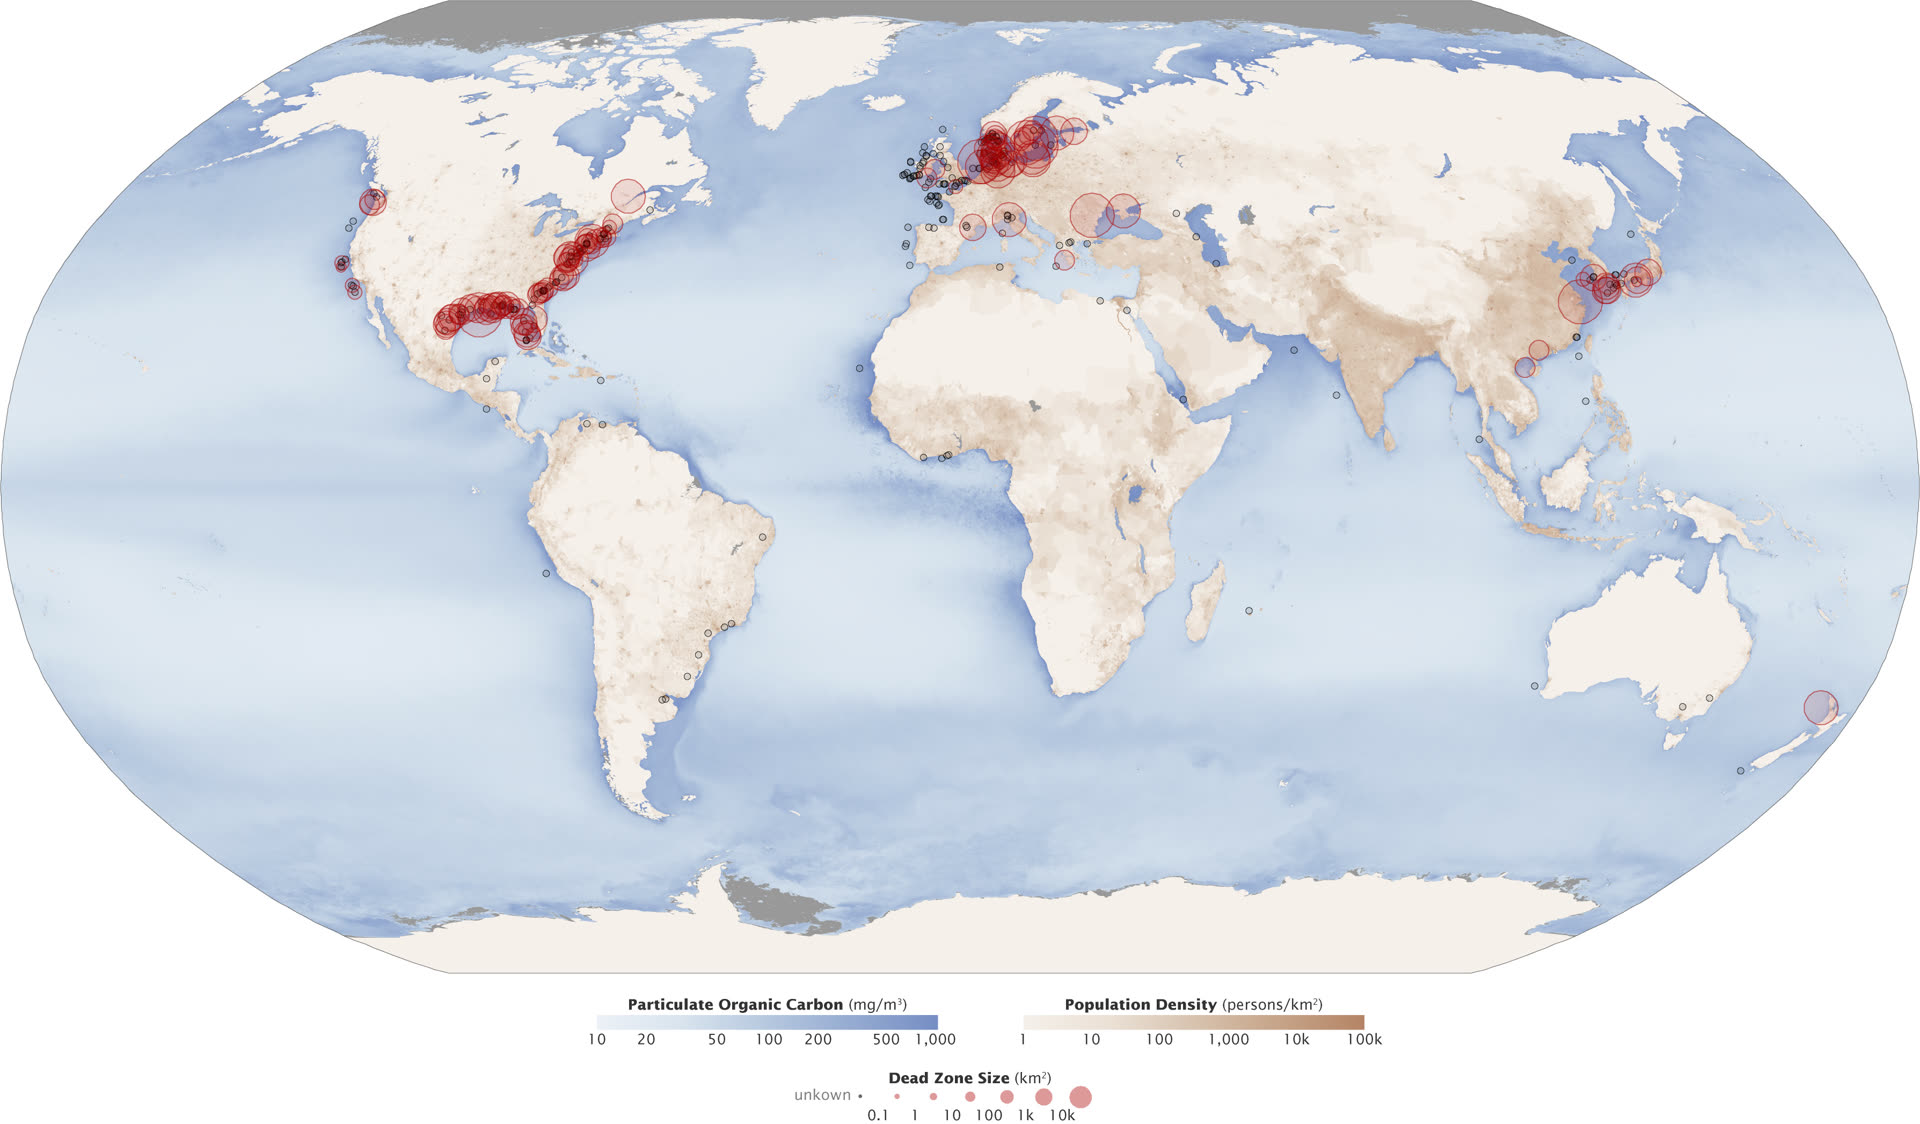
World map with red dots on coastal seas marking documented hypoxic dead zones, ocean color in the background
NASA Earth Observatory, Aquatic Dead Zones, after Diaz. Public domain. Vintage: 2008 compilation.
NASA EO / Diaz 2008 compilation

Dead zones

A dead zone is a stretch of water with too little dissolved oxygen for most animals. Many coastal cases follow eutrophication: extra nitrogen and phosphorus, a bloom, then decay that consumes oxygen. The map marks compiled coastal hypoxic sites after Diaz (2008). Open-ocean oxygen-minimum zones are a related, larger-scale problem.

https://earthobservatory.nasa.gov/images/44677/aquatic-dead-zones
License: Public domain (NASA)

Open NOAA: garbage patches → Open NOAA marine-pollution surveillance → NASA Worldview VIIRS chlorophyll → Open NASA Ocean Color →