Published figures, each from a named source. Ocean area, heat, sea-level rise, acidity, oxygen, plastic, fisheries, coral, hypoxia, and protected-area coverage are different measurements. They should not be added into one score.
Copied from the cited papers, with vintage. Heat content is not SST; pH is chemistry, not temperature; a plastic flow is not the stock in a gyre; designated MPA area is not fully protected ocean.
~71 % of Earth’s surface
Ocean of Earth’s surface
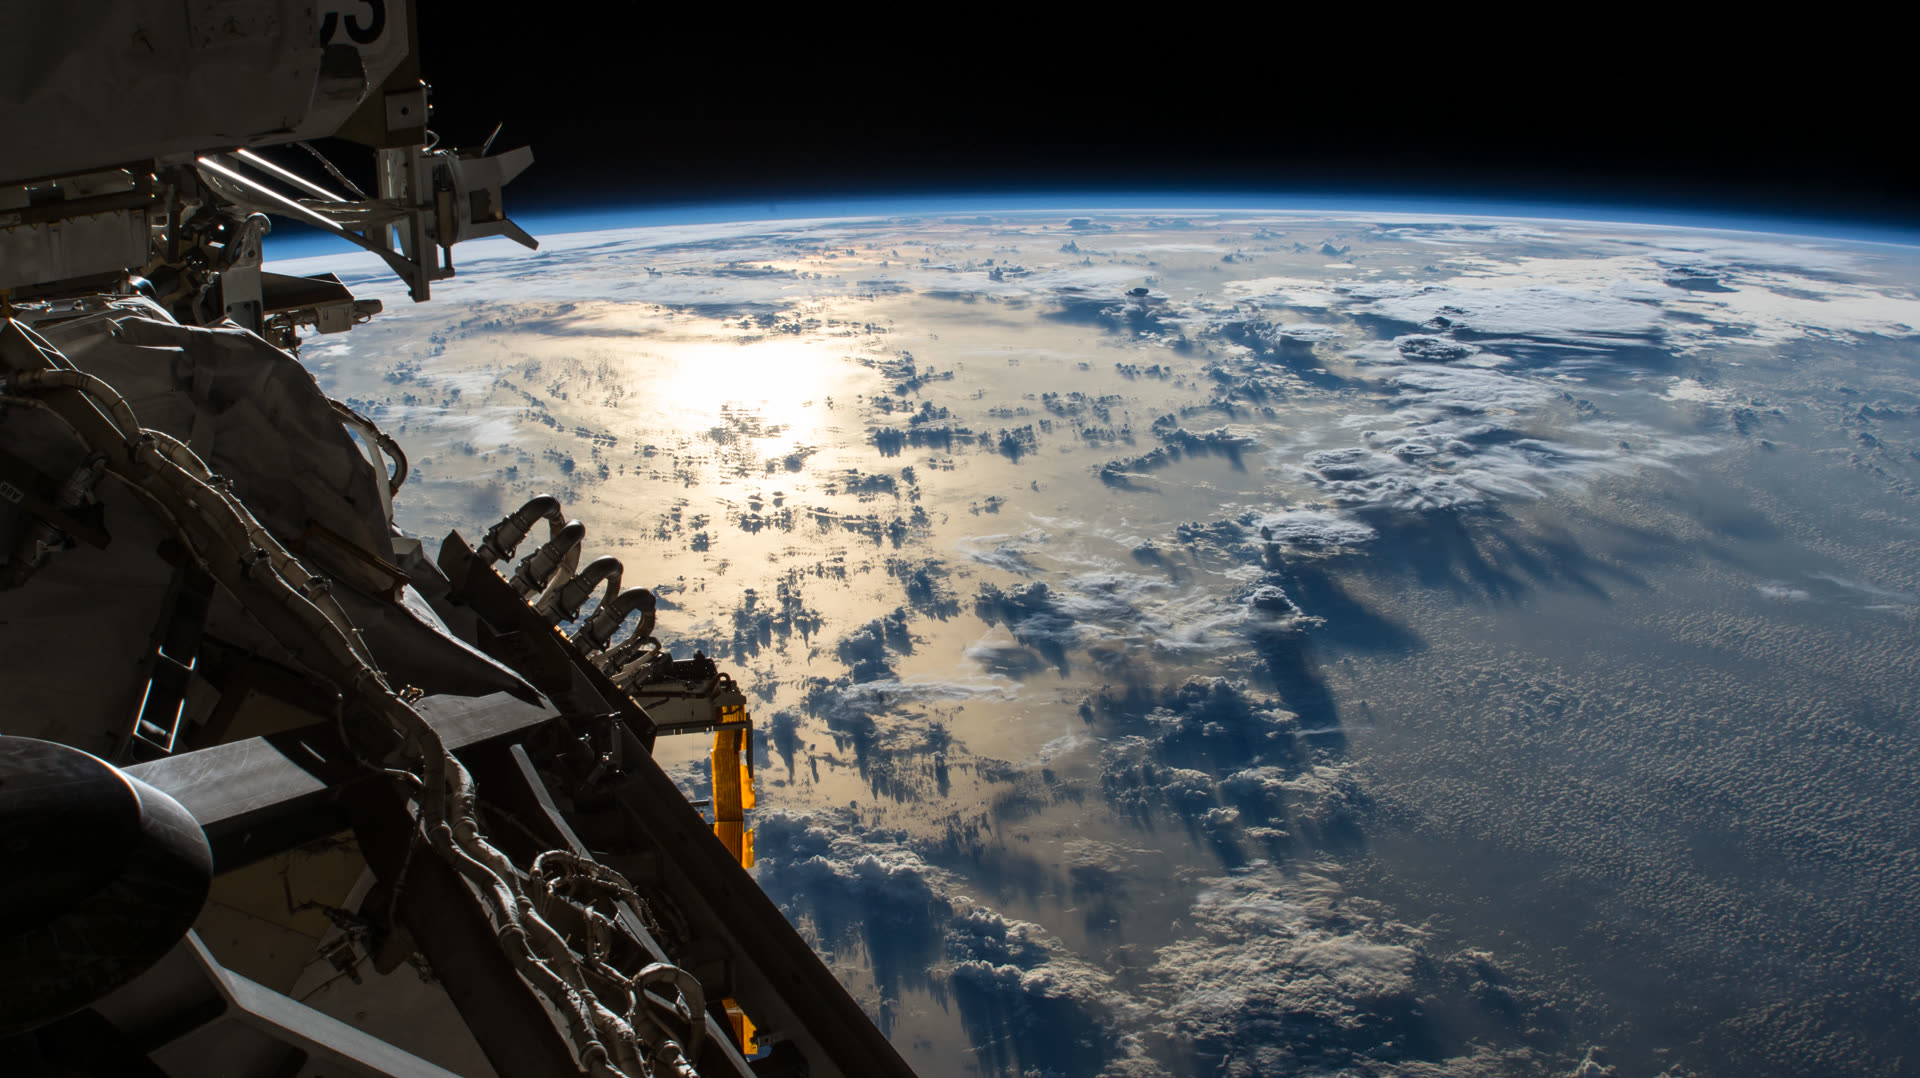
About 71 percent of Earth’s surface is ocean (IPCC SROCC). Area share, not heat, acidity, or a pollution stock.
IPCC SROCC · IPCC SROCC 2019
https://www.ipcc.ch/srocc/chapter/summary-for-policymakers/
~90 % of excess heat
Excess heat in the ocean
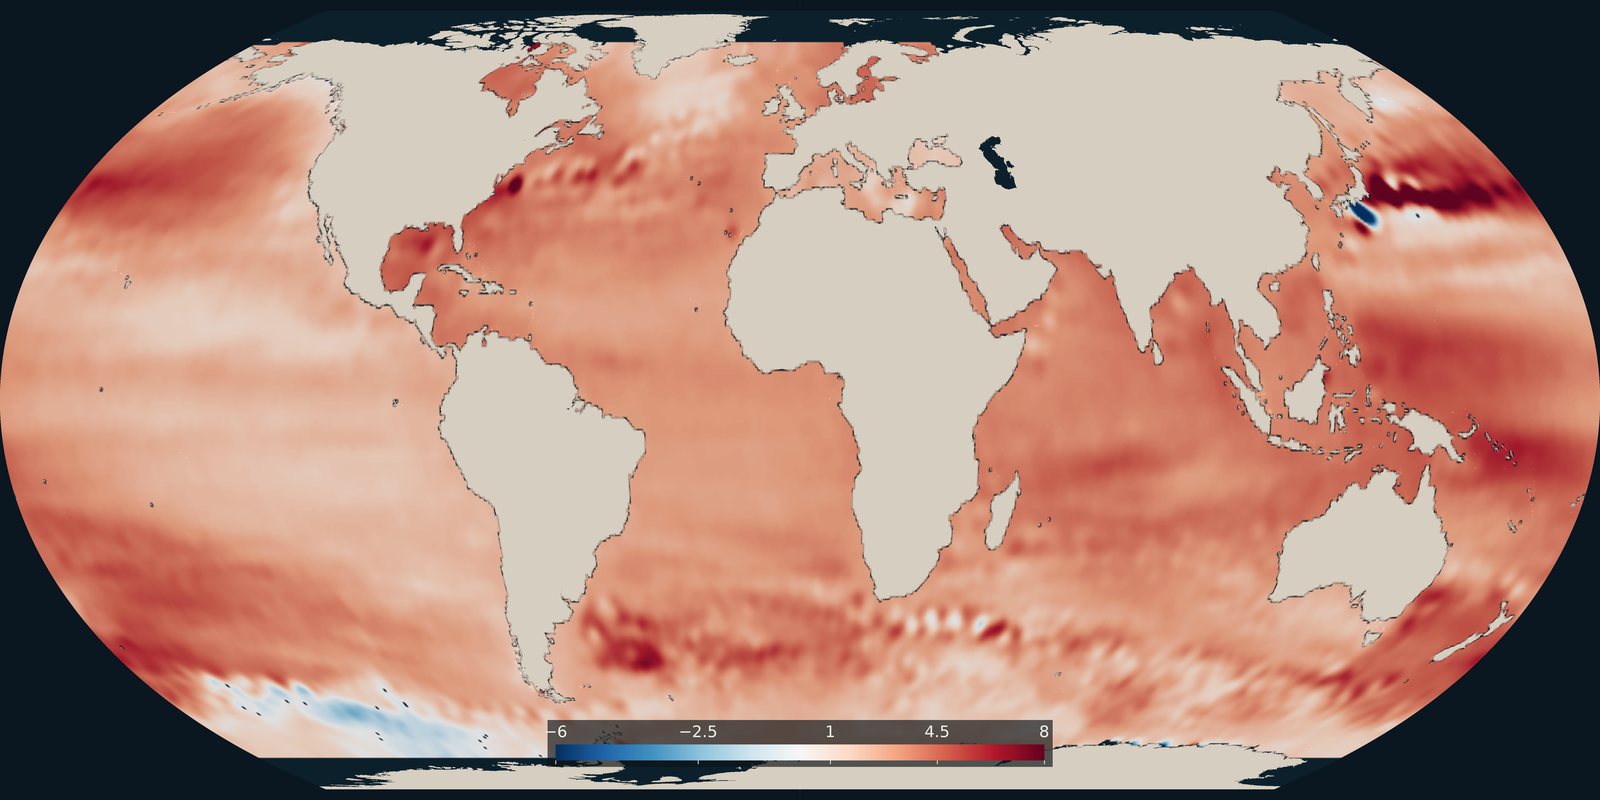
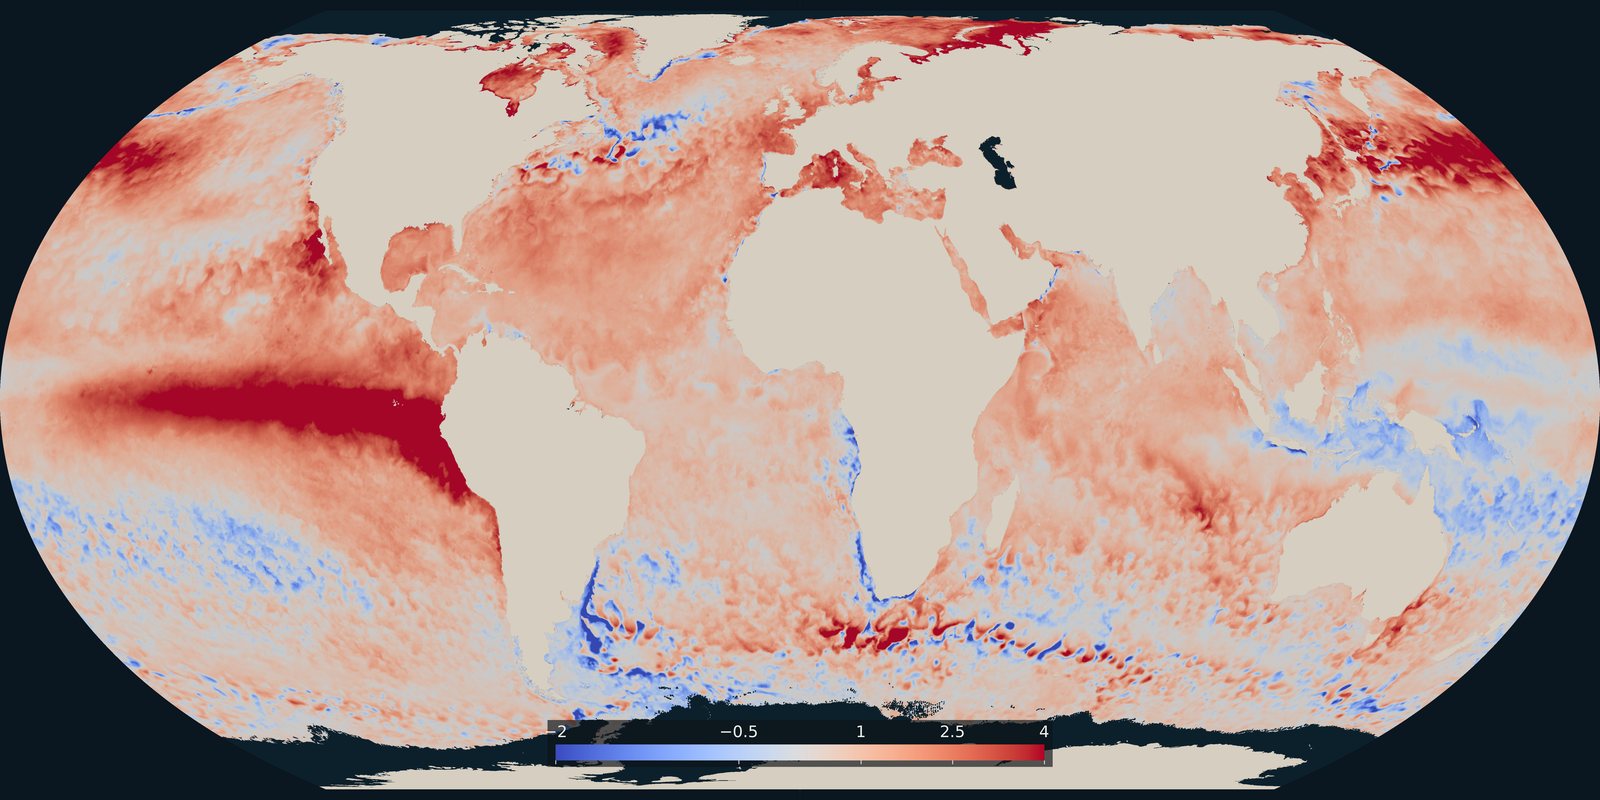
About 90 percent of the excess heat in the climate system is stored in the ocean (IPCC AR6 WG1). That is an energy inventory of the water column.
IPCC AR6 WG1 · IPCC AR6 2021
https://www.ipcc.ch/report/ar6/wg1/
3.7 mm / year
Sea-level rise rate
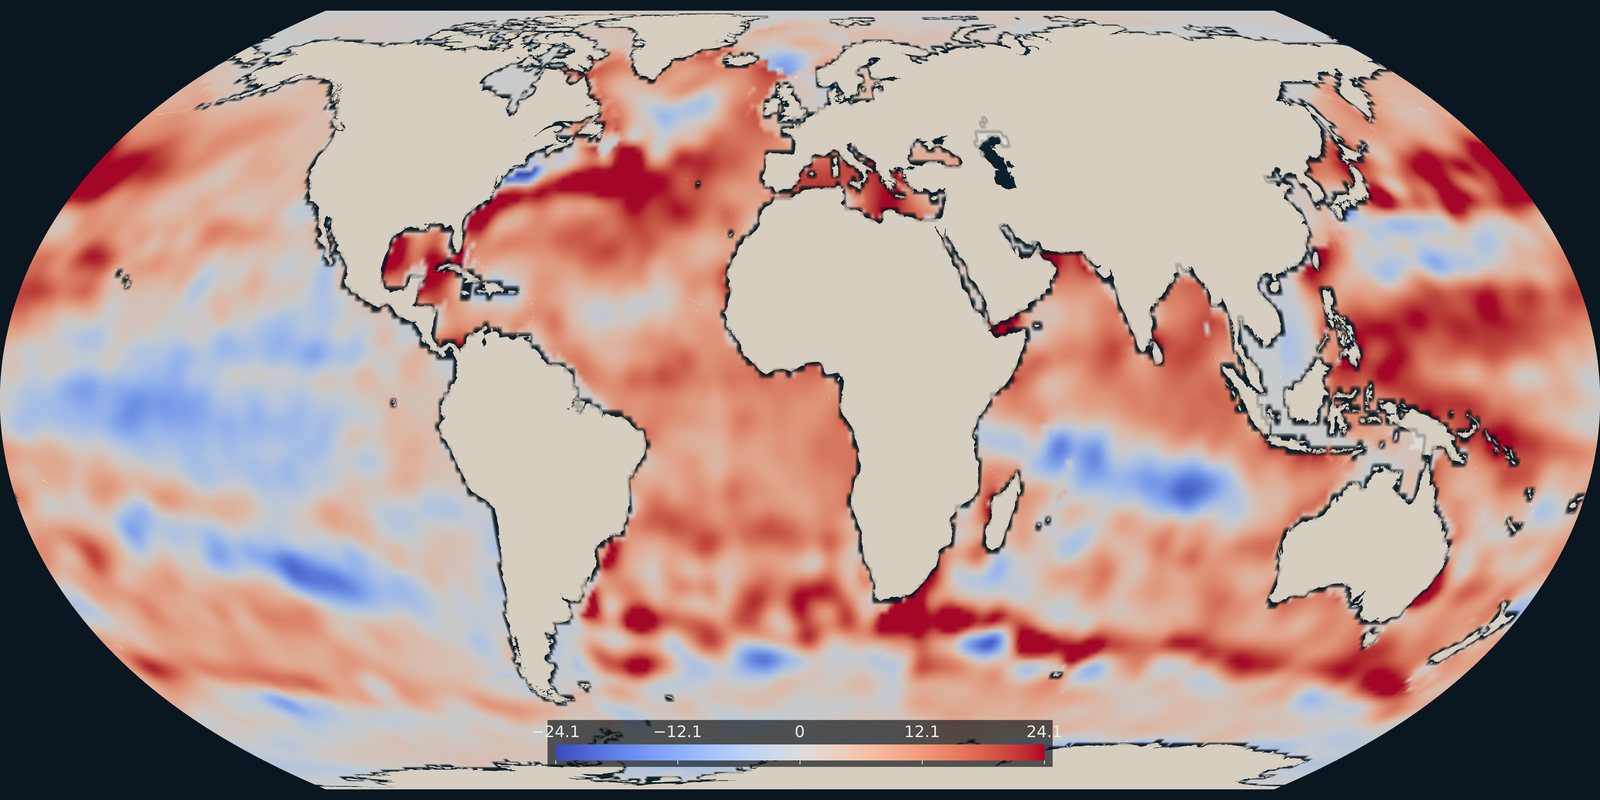
Global mean sea level rose 3.7 [3.2-4.2] mm/year in 2006-2018, up from 2.3 [1.6-3.1] mm/year in 1971-2018 (IPCC AR6 WG1). Rate, not a single tide-gauge day.
IPCC AR6 WG1 · 2006-2018
https://www.ipcc.ch/report/ar6/wg1/
2023-24 record 0-2000 m OHC
Ocean heat content, recent peak
Cheng et al. 2024 (Adv. Atmos. Sci.): 0-2000 m ocean heat content in 2023 reached a new instrumental high; 2024 updates remained at the top of the record. Heat content, not a single SST day.
Cheng et al. 2024 · Cheng et al. 2024
https://doi.org/10.1007/s00376-024-3378-5
~0.1 pH units since ~1750
Surface pH decline
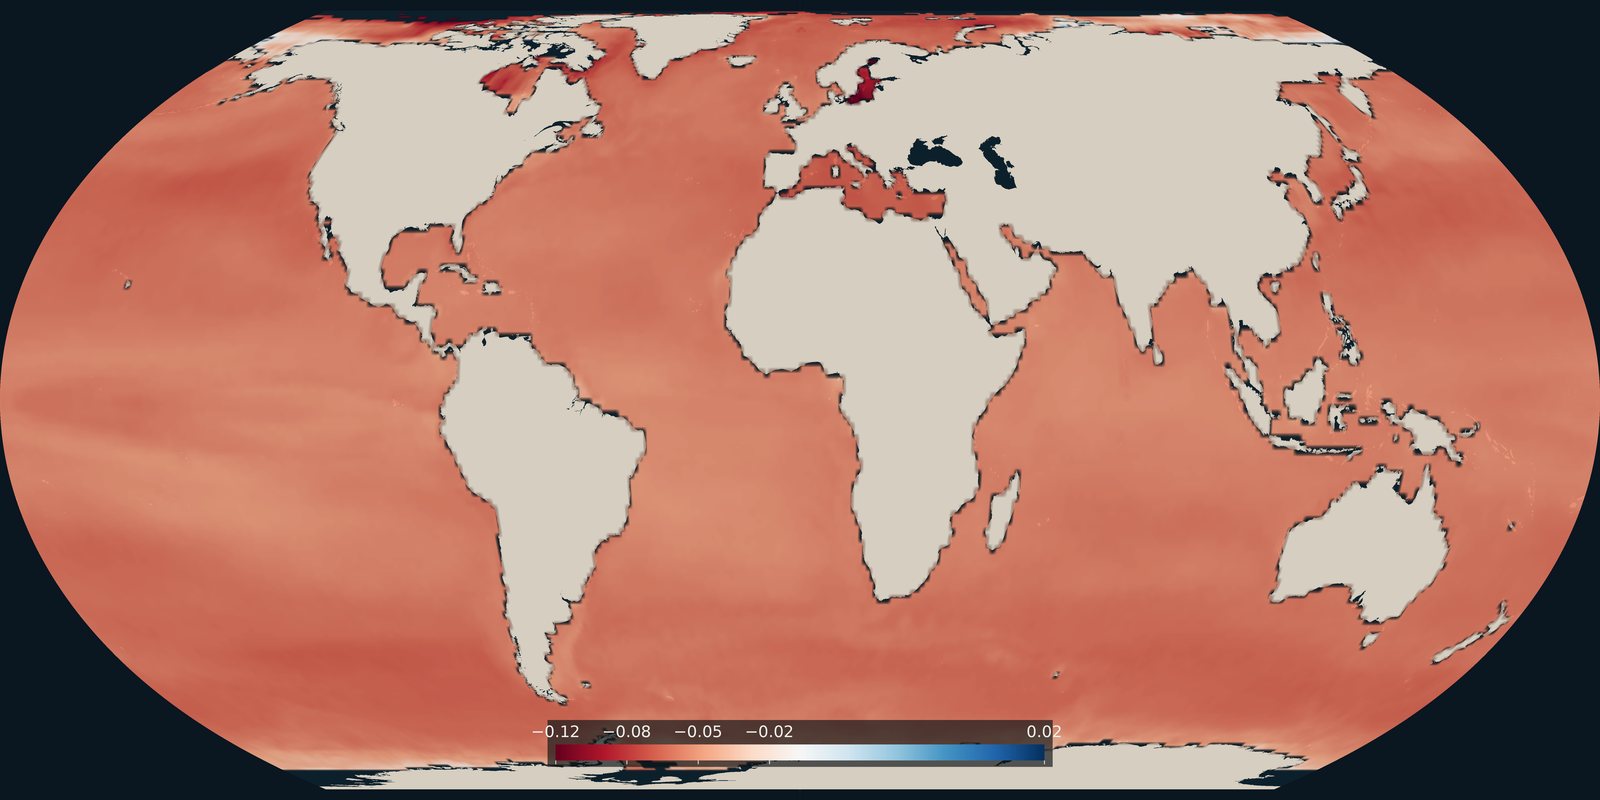
Open-ocean surface pH has fallen by about 0.1 since ~1750: a roughly 26-30 percent increase in hydrogen-ion concentration (IPCC AR6; NOAA PMEL). Carbonate chemistry, not temperature.
IPCC AR6; NOAA PMEL · IPCC AR6 / NOAA PMEL
https://www.pmel.noaa.gov/co2/story/Ocean+Acidification
0.5-3.3 % O₂, upper 1000 m
Open-ocean oxygen loss
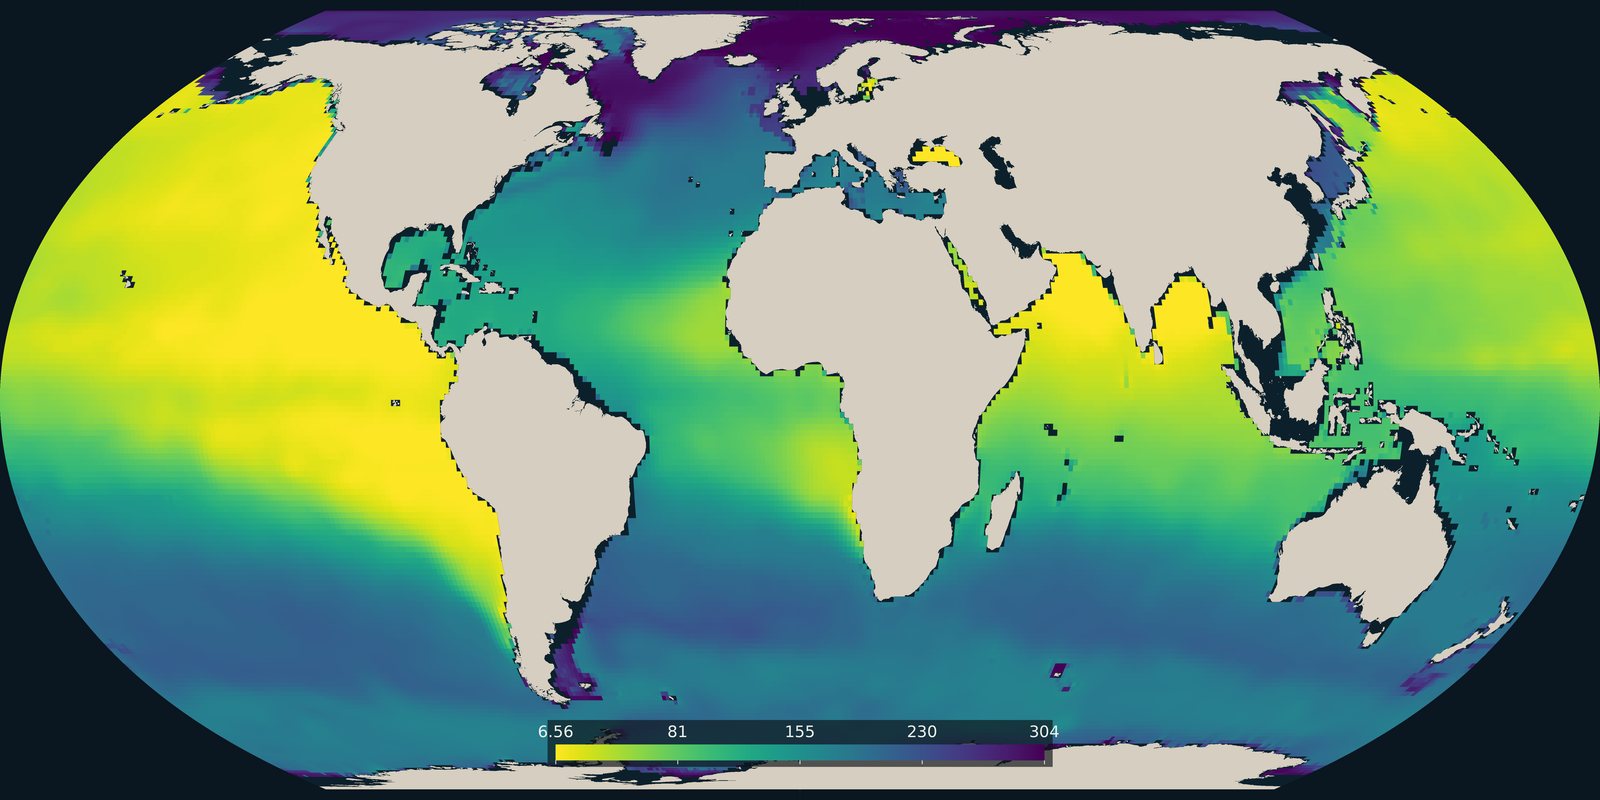
The open ocean lost 0.5-3.3 percent of dissolved oxygen in the upper 1000 m over 1970-2010; oxygen-minimum zones expanded by 3-8 percent (IPCC SROCC). Open-ocean deoxygenation, not the coastal dead-zone count.
IPCC SROCC · 1970-2010
https://www.ipcc.ch/srocc/chapter/summary-for-policymakers/
4.8-12.7 million tonnes / year
Plastic from land to ocean
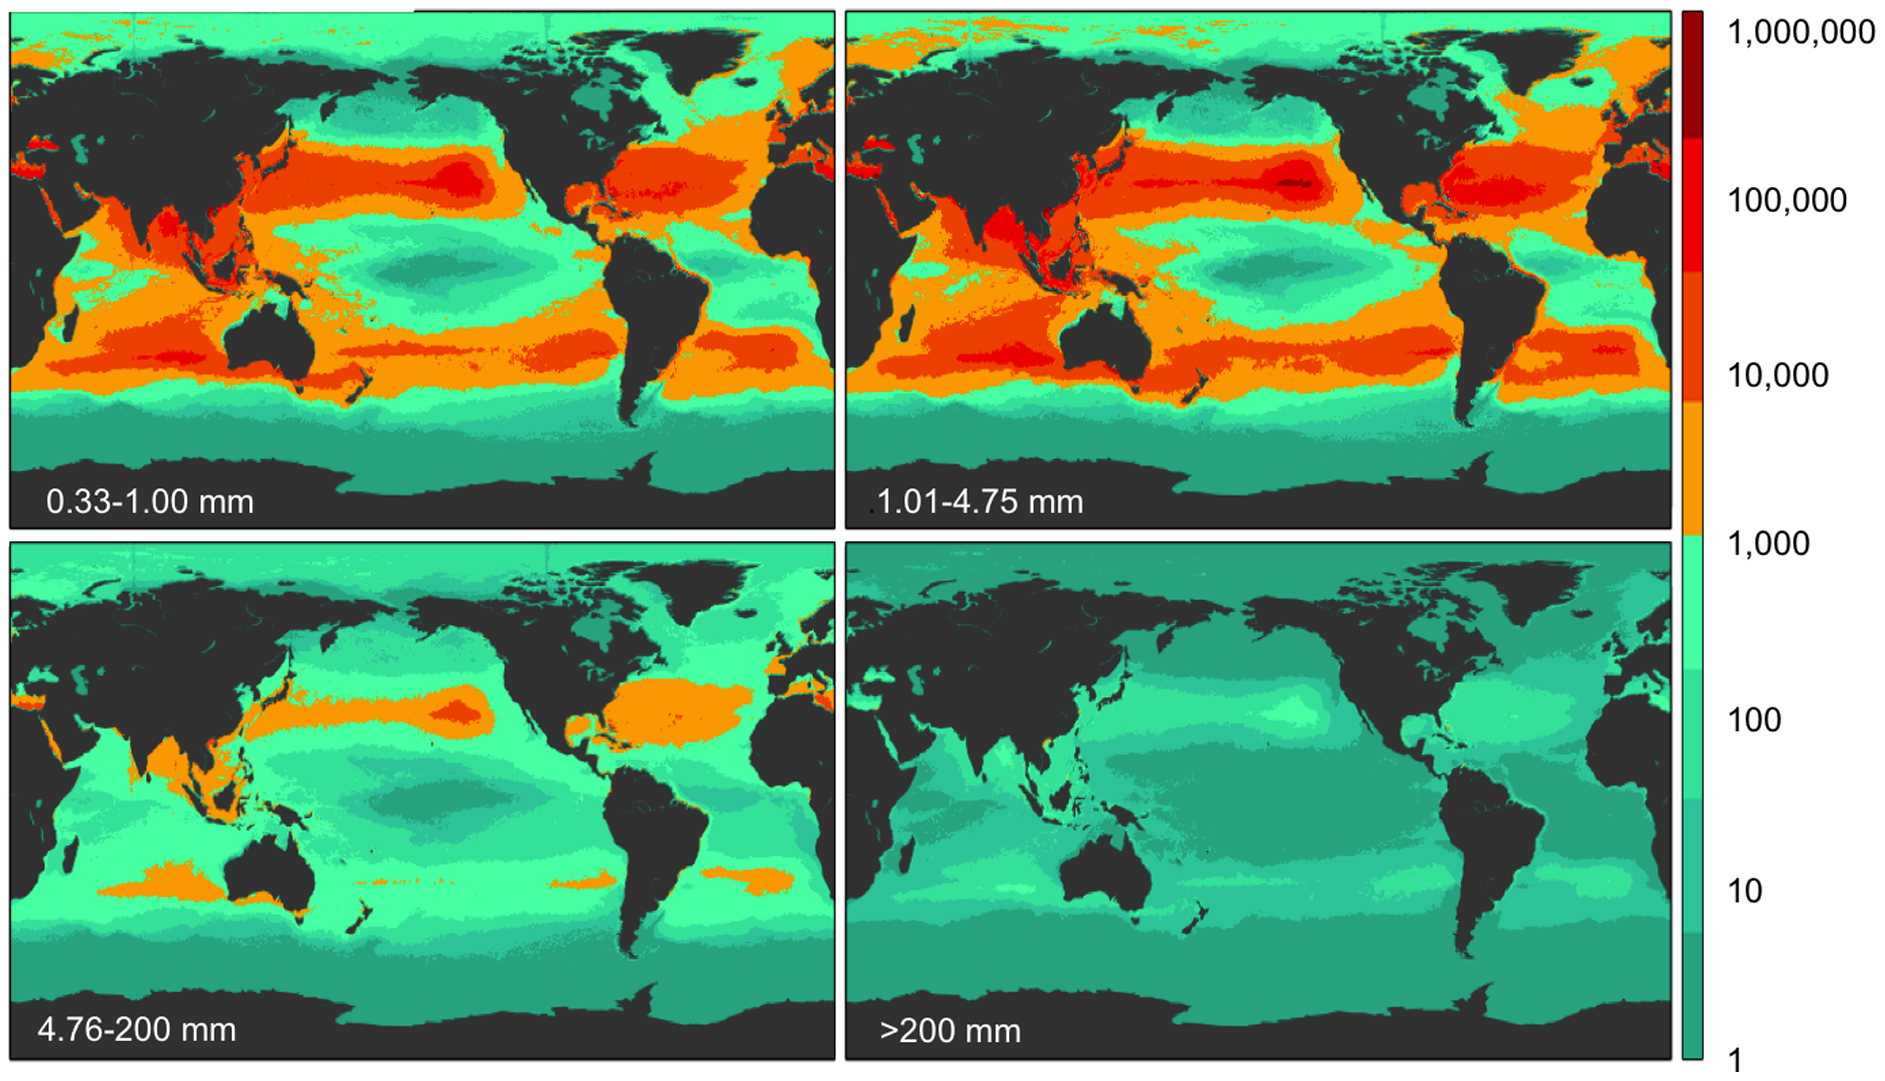
Jambeck et al. 2015, Science: 4.8-12.7 million metric tonnes of plastic waste entered the ocean from land in 2010. A 2010 flow estimate, not the mass sitting in the Great Pacific Garbage Patch.
Jambeck et al. 2015 · 2010, Jambeck 2015
https://doi.org/10.1126/science.1260352
5.25 trillion particles
Floating plastic particles
Eriksen et al. 2014: at least 5.25 trillion particles (268,940 tonnes) floating, from sampling across the five subtropical gyres. A stock estimate from net tows and a model.
Eriksen et al. 2014 · Eriksen 2014
https://doi.org/10.1371/journal.pone.0111913
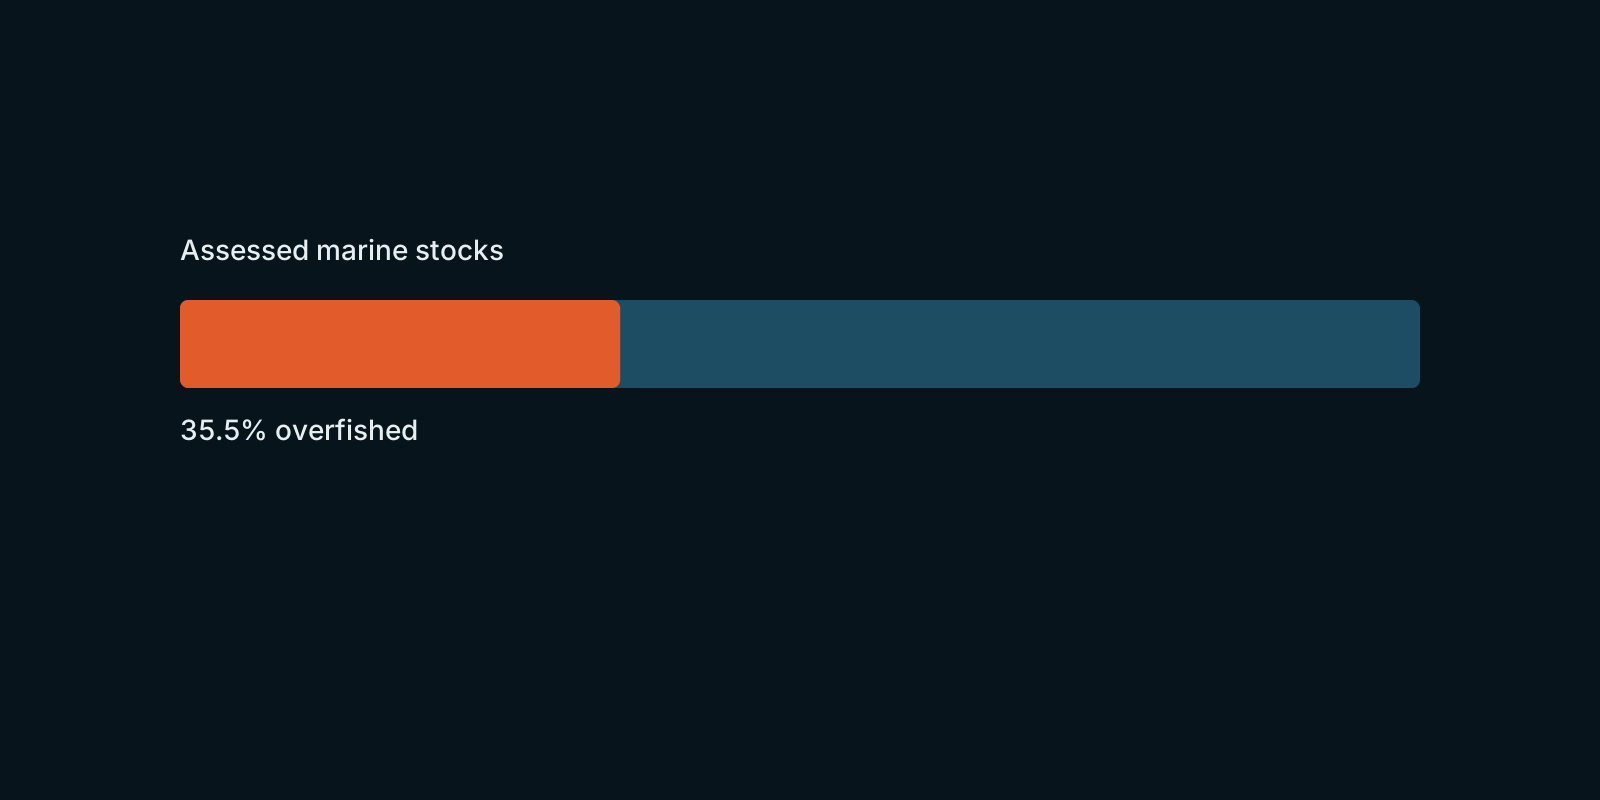
35.5 % of stocks
Marine stocks overfished
35.5 percent of assessed marine fishery stocks were classified as overfished; 64.5 percent were within biologically sustainable levels (FAO Review of the State of World Marine Fishery Resources 2025; status year 2021). Share of stocks, not of catch: 77.2 percent of landings still came from sustainable stocks.
FAO marine stocks 2025 · FAO 2025 (2021 status)
https://www.fao.org/newsroom/detail/fao-releases-the-most-detailed-global-assessment-of-marine-fish-stocks-to-date/en
~14 % of coral, 2009-18
Hard coral lost, 2009-18
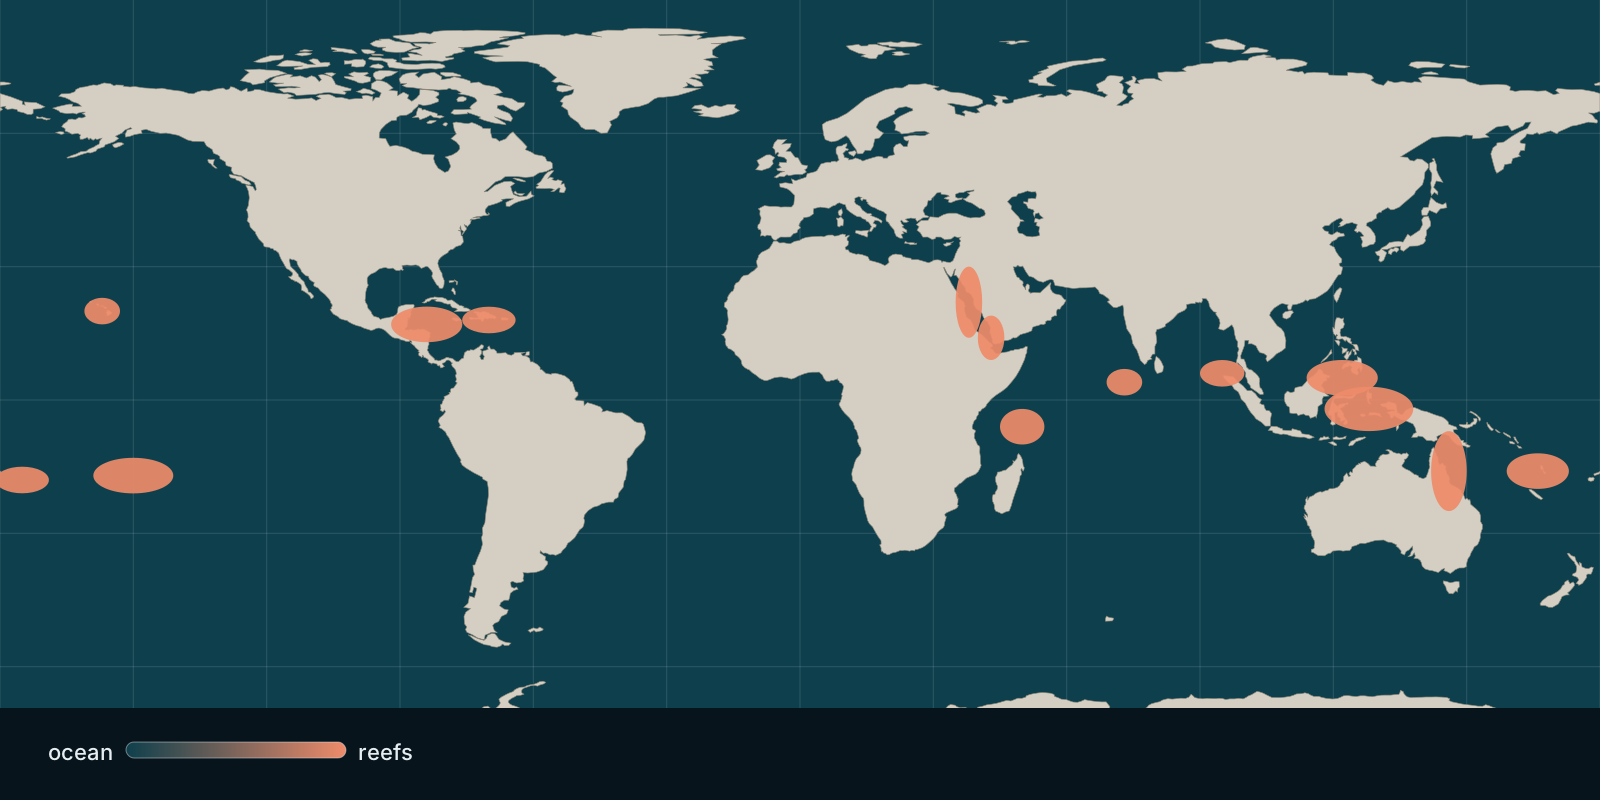
About 14 percent of the world’s hard coral was lost from coral reefs between 2009 and 2018 (GCRMN Status of Coral Reefs of the World: 2020). Living hard-coral cover, not reef map area, and not an IPCC 1.5 °C projection.
GCRMN 2020 · 2009-2018
https://doi.org/10.59387/wotj9184
>500 coastal sites
Coastal hypoxic sites
Breitburg et al. 2018, Science: more than 500 coastal sites with anthropogenic hypoxia, plus expanding open-ocean oxygen-minimum zones (~4.5 million km²). Diaz’s earlier compilation was already above 400.
Breitburg et al. 2018 · Breitburg 2018
https://doi.org/10.1126/science.aam7240
8.4 % of ocean, 2024
Marine protected area
8.4 percent of marine and coastal areas (8.44 percent in the figure) were in protected areas and OECMs in the Protected Planet Report 2024. Designated coverage toward 30×30: not fully or highly protected ocean. Live WDPA totals move; this page keeps that 2024 snapshot.
Protected Planet Report 2024 · Protected Planet 2024
https://digitalreport.protectedplanet.net/
15.9 million ha
Mangrove remaining (FAO)
15.9 million ha of mangrove forest in 2025 (FAO FRA 2025). Global net area rose in 2015-2025; that is not a claim that every mangrove coast is recovering. Blue-carbon habitat, counted as forest land use.
FAO FRA 2025 · FRA 2025
https://openknowledge.fao.org/server/api/core/bitstreams/2dee6e93-1988-4659-aa89-30dd20b43b15/content/FRA-2025/forest-characteristics.html