

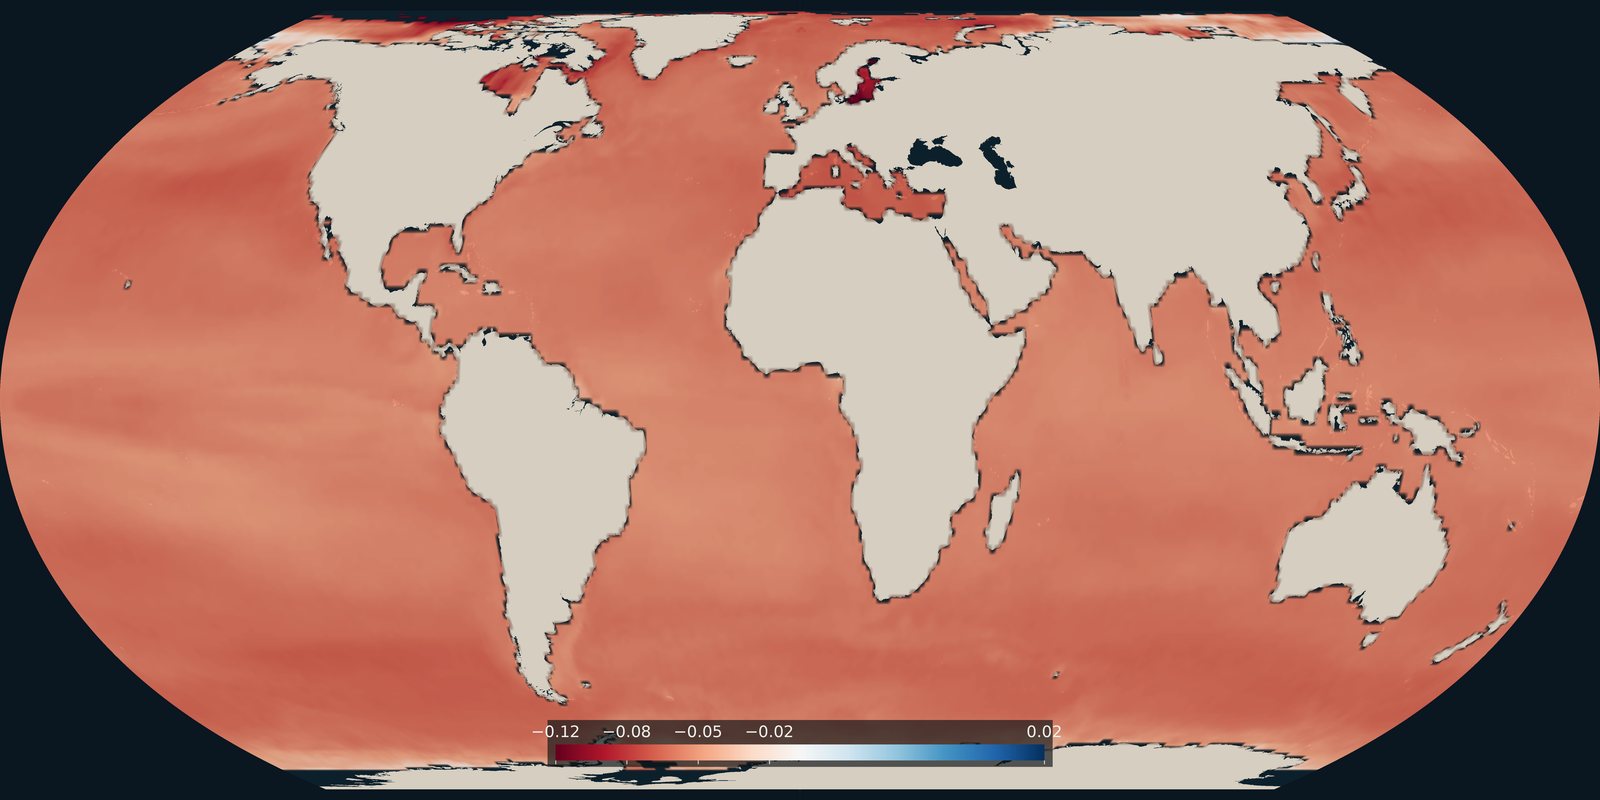
Ocean acidification
How much surface-ocean pH changed from the late 1980s to the early 2020s. A carbonate-chemistry trend, not temperature and not a pollution map.
Read the card →How assessed marine fish stocks are doing worldwide, according to FAO’s global stock-status figures.
FAO SOFIA · marine stock status · capture fisheries
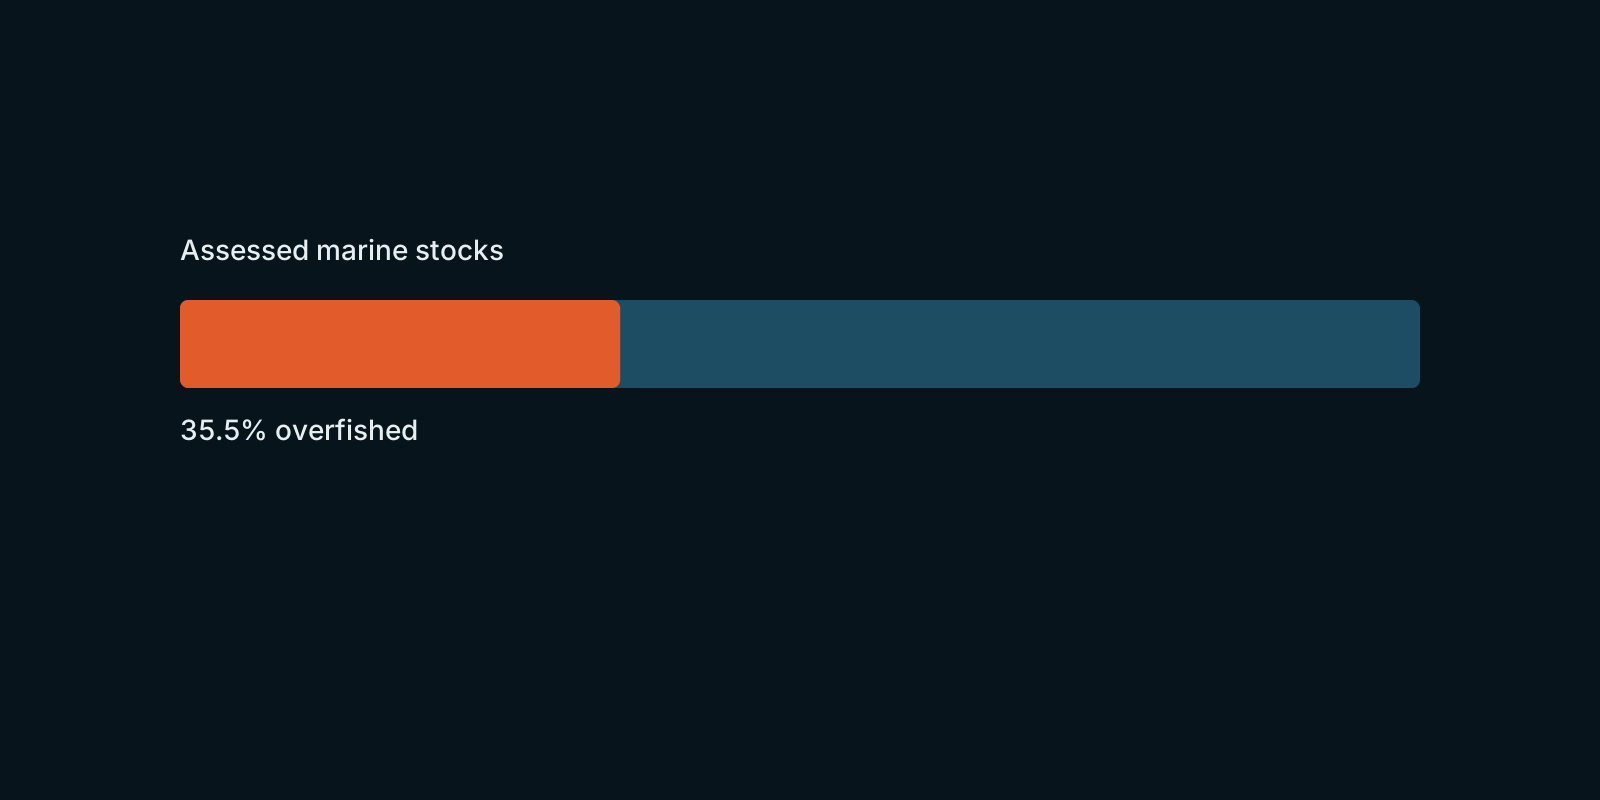
FAO’s State of World Fisheries and Aquaculture (SOFIA) is the flagship global assessment of fisheries and aquaculture. 35.5 percent of assessed marine fishery stocks were classified as overfished (FAO Review of the State of World Marine Fishery Resources 2025; status year 2021). The reports are published on FAO’s website and in its Open Knowledge repository. FAO’s FishStat database adds detailed catch statistics.
The overfished share is a simple global measure of how fish stocks are doing. Selective fishing gear, marine protected areas, and similar measures are ways to respond; FAO’s figures track the state of the stocks themselves.
FAO’s stock-status shares cover assessed marine stocks only. SOFIA defines the categories and the year each figure refers to, so check the current report for the latest figures. Catch statistics from FishStat are useful context, but they measure something different from the overfished share.
How much surface-ocean pH changed from the late 1980s to the early 2020s. A carbonate-chemistry trend, not temperature and not a pollution map.
Read the card →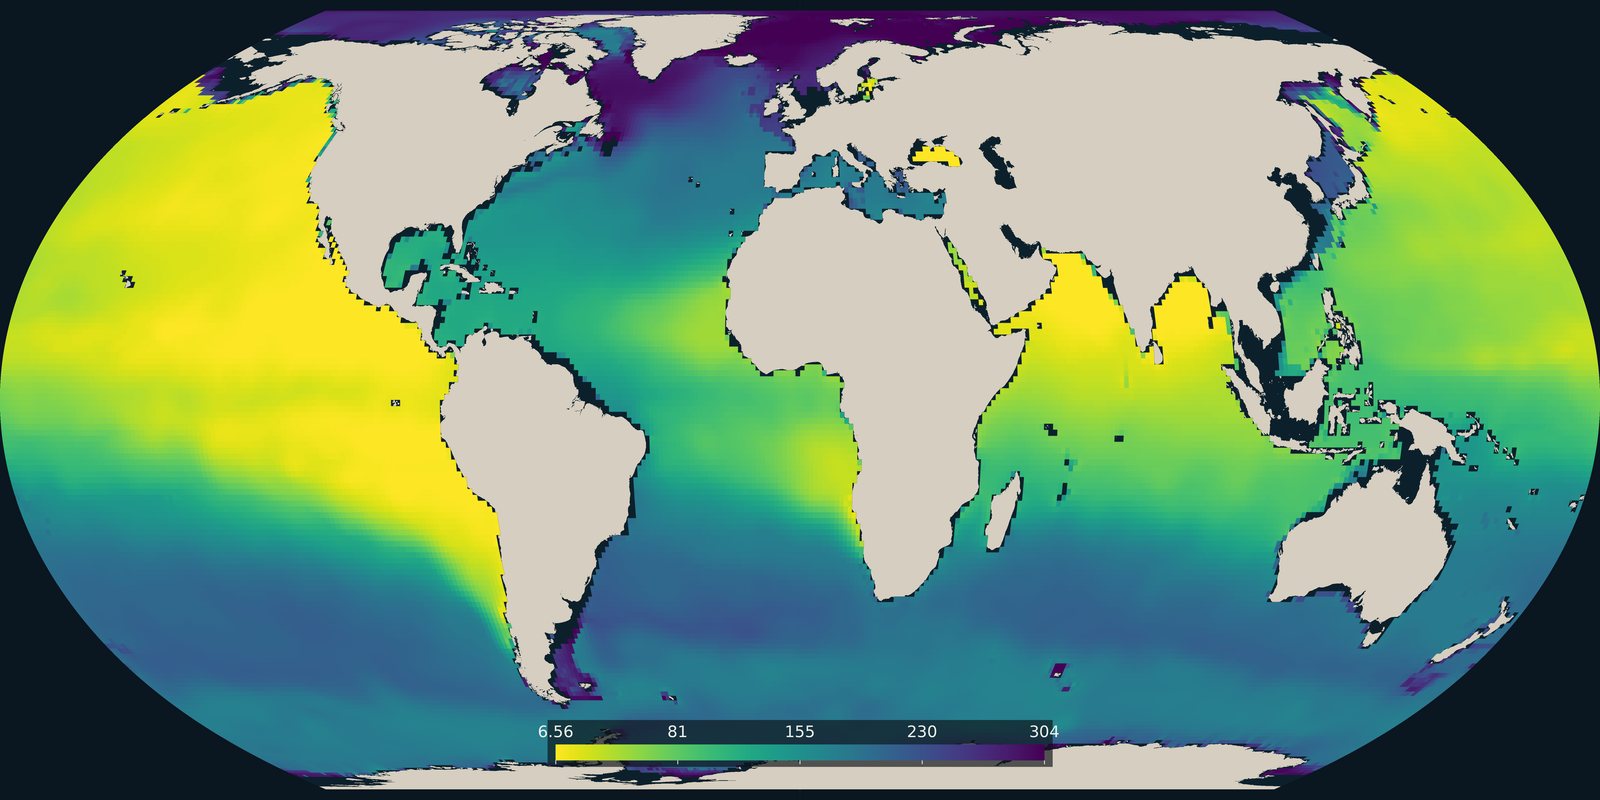
The lowest dissolved oxygen between 100 and 1000 metres in the World Ocean Atlas 2023 climatology. Open-ocean oxygen, not the coastal dead-zone pins on Pollution.
Read the card →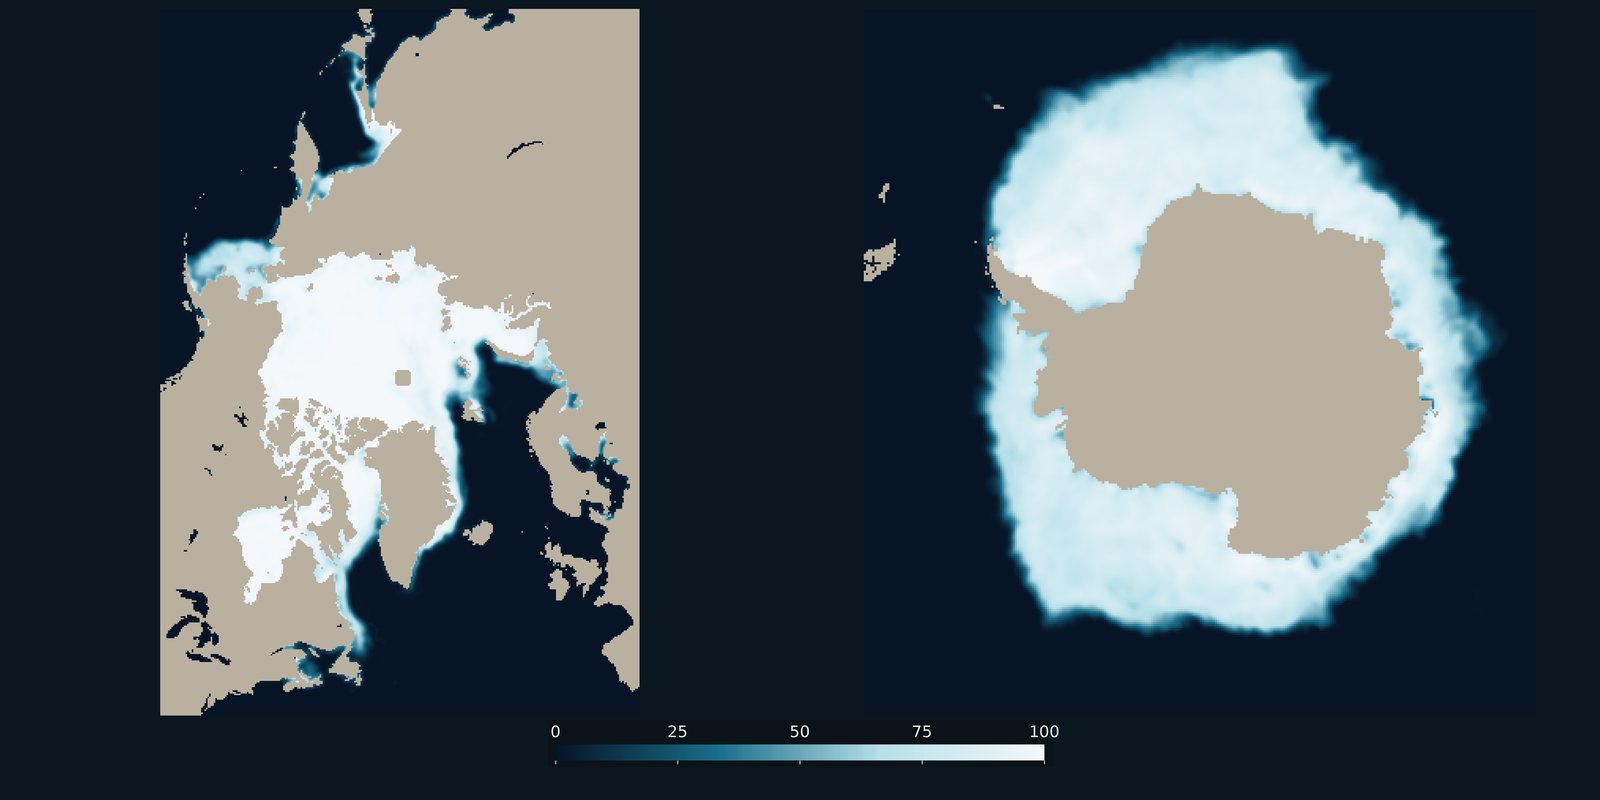
Sea-ice concentration for a recent Arctic March and Antarctic September, side by side. Frozen ocean cover, not surface temperature and not land ice.
Read the card →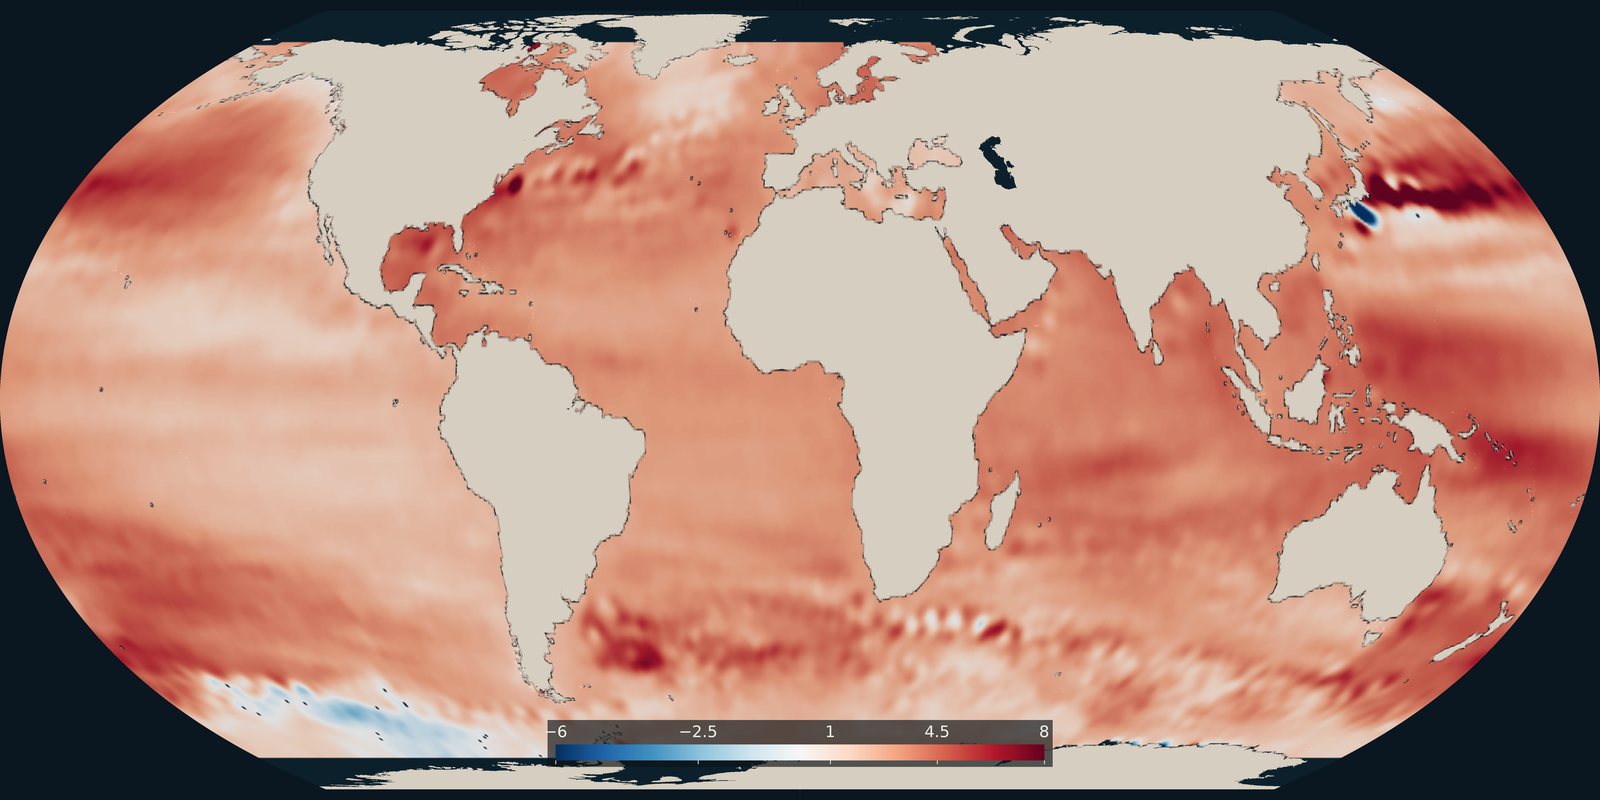
Where the ocean surface is rising faster or more slowly, in millimetres per year. The global average cited on this site comes from the NASA Sea Level Change Portal.
Read the card →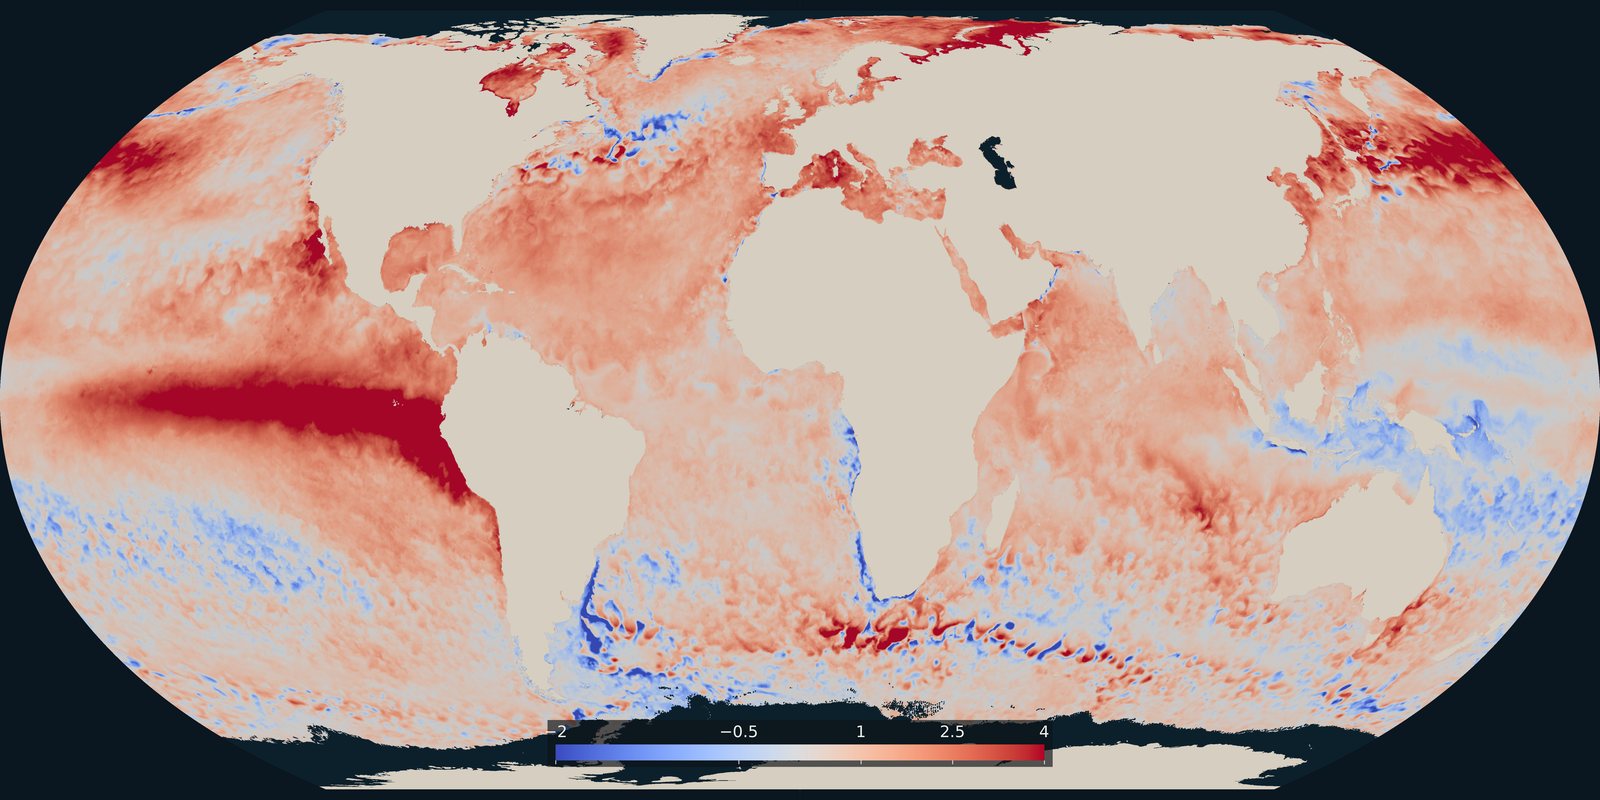
Where the sea surface was warmer or cooler than usual on 25 September 2026. A temperature anomaly from NOAA Coral Reef Watch, not a classified heatwave category.
Read the card →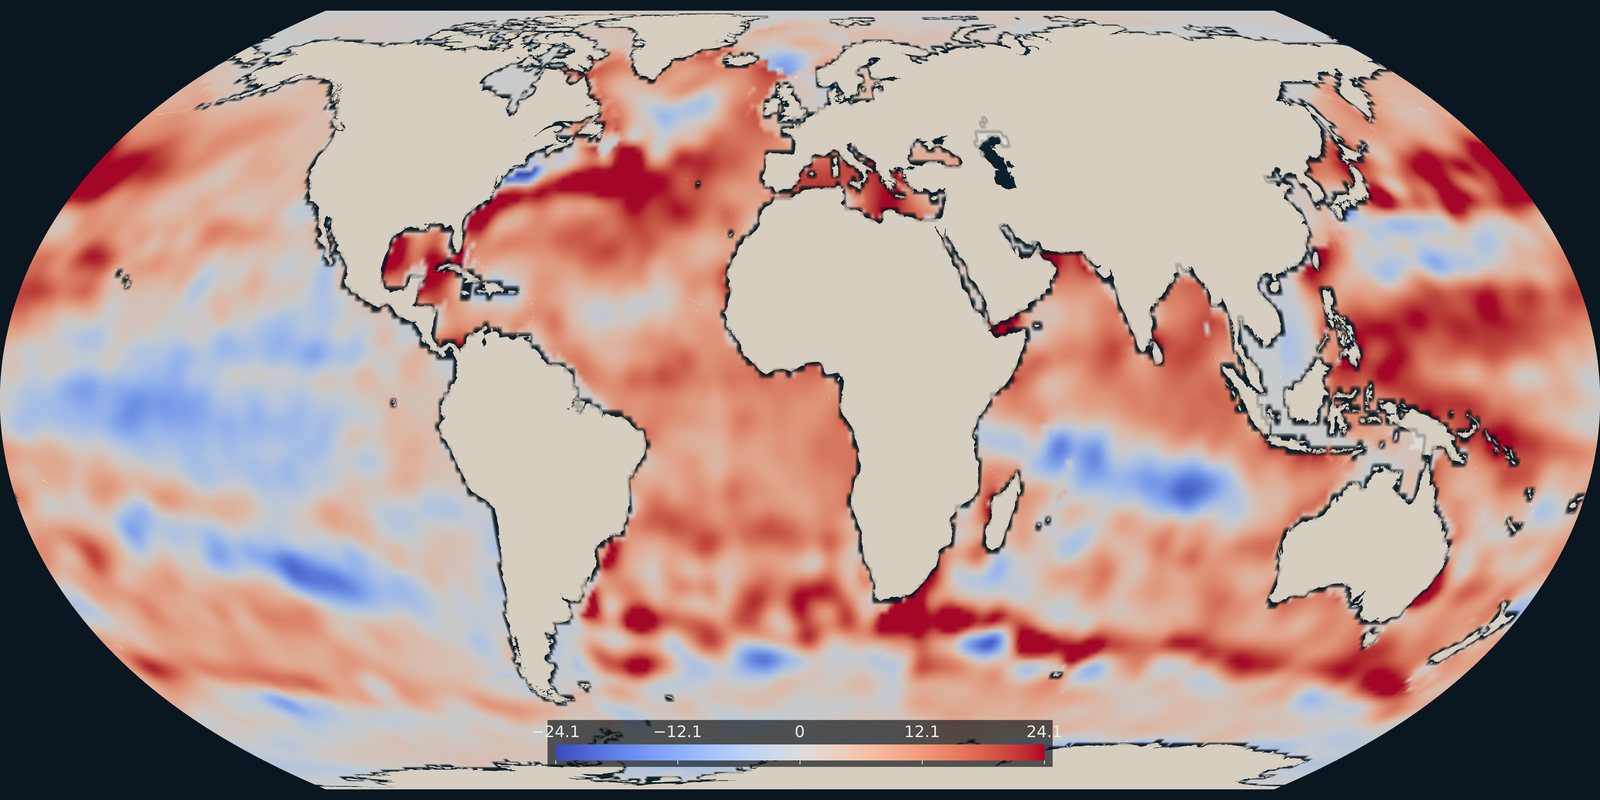
Heat stored in the upper 700 metres in 2025, as an anomaly in each 1° cell, from NOAA NCEI.
Read the card →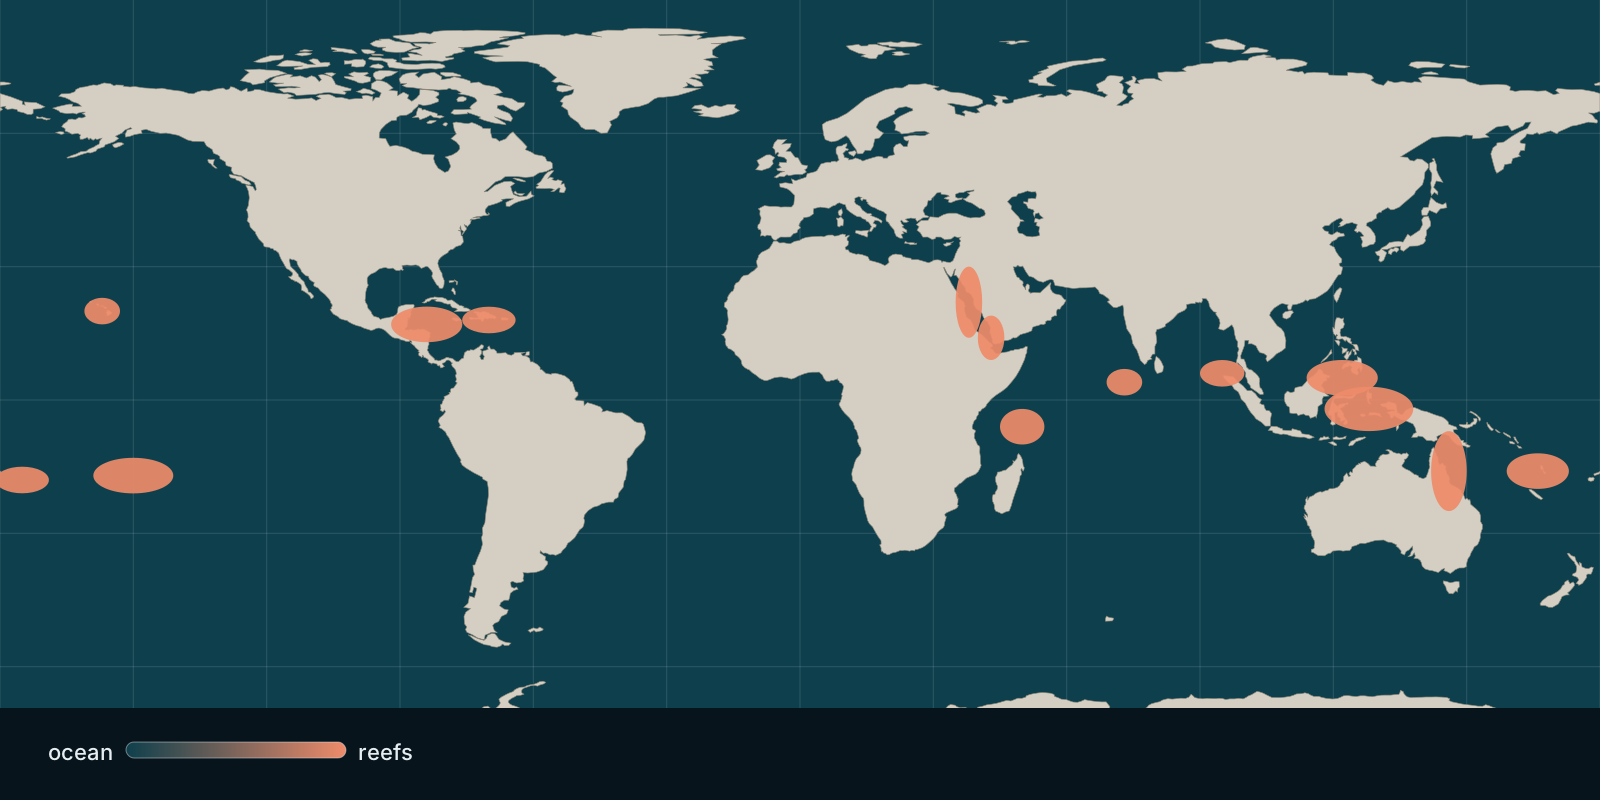 Fix Planet overview
Where hard coral cover stands today and how heat stress bleaches reefs, based on global monitoring and satellite observations.
Read the card →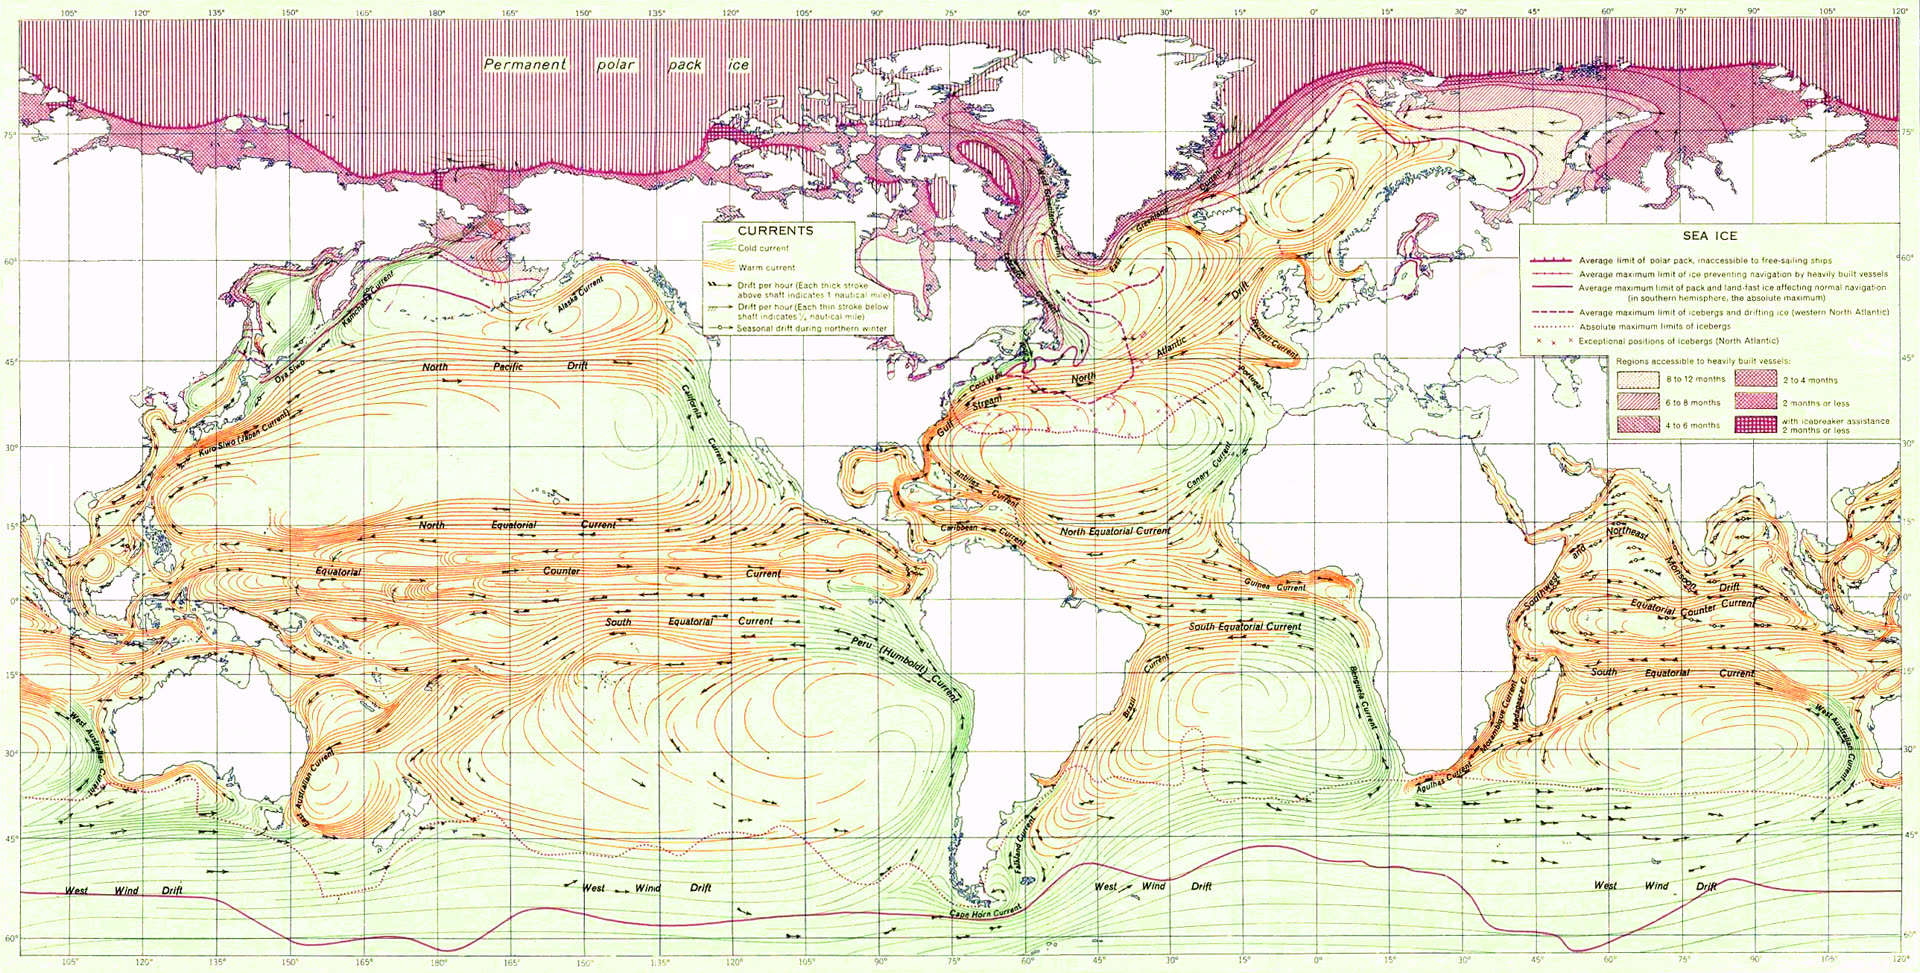
Surface currents and the great gyres that steer heat, salt, and life.
Read the card →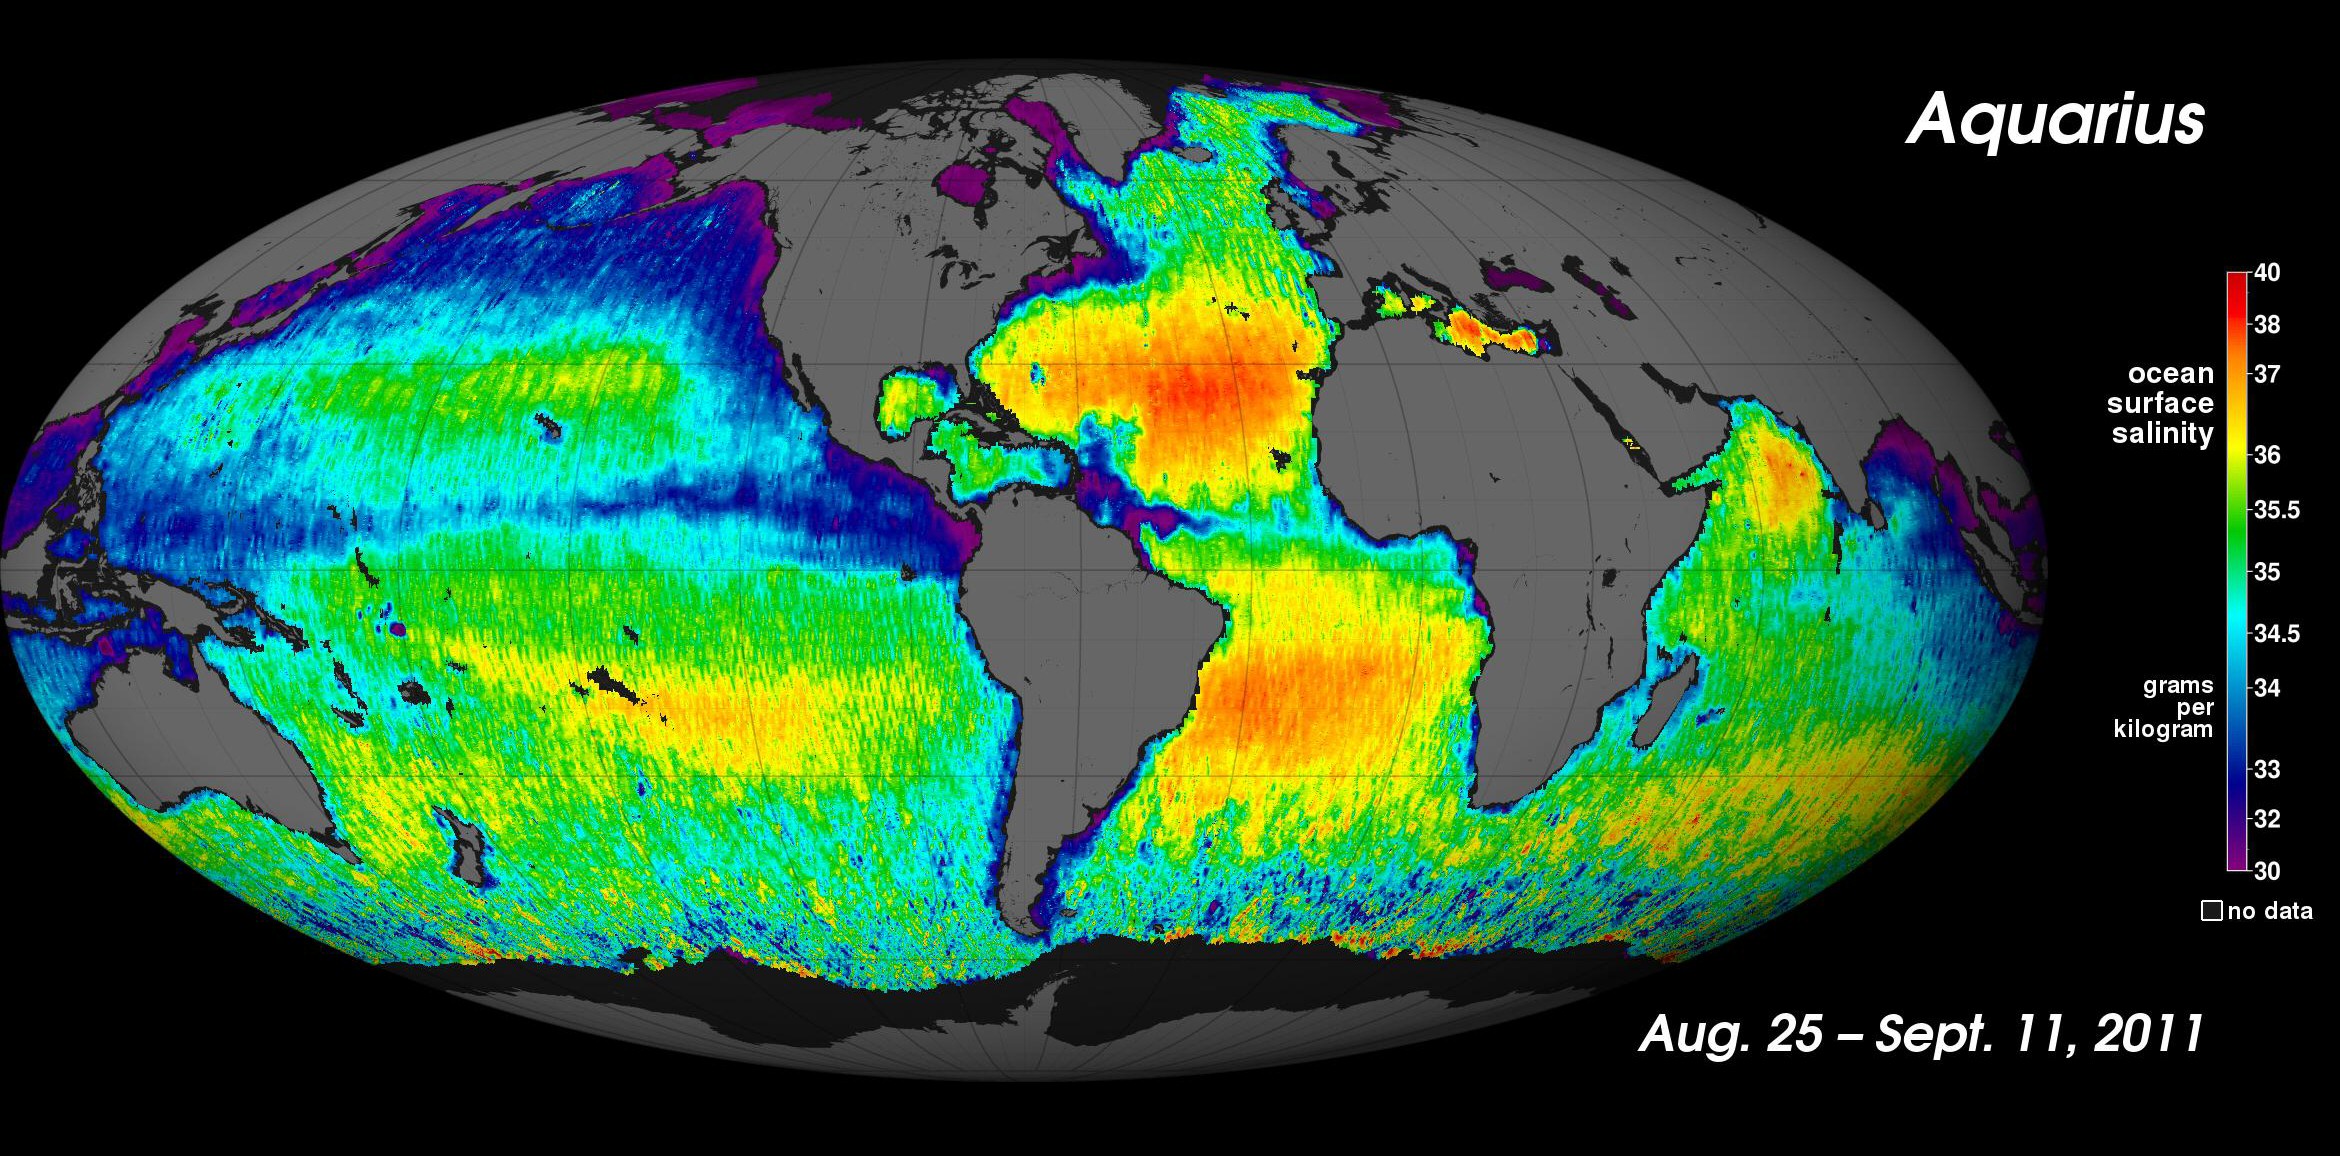
How salty the sea is, and why that density helps drive the overturning circulation.
Read the card →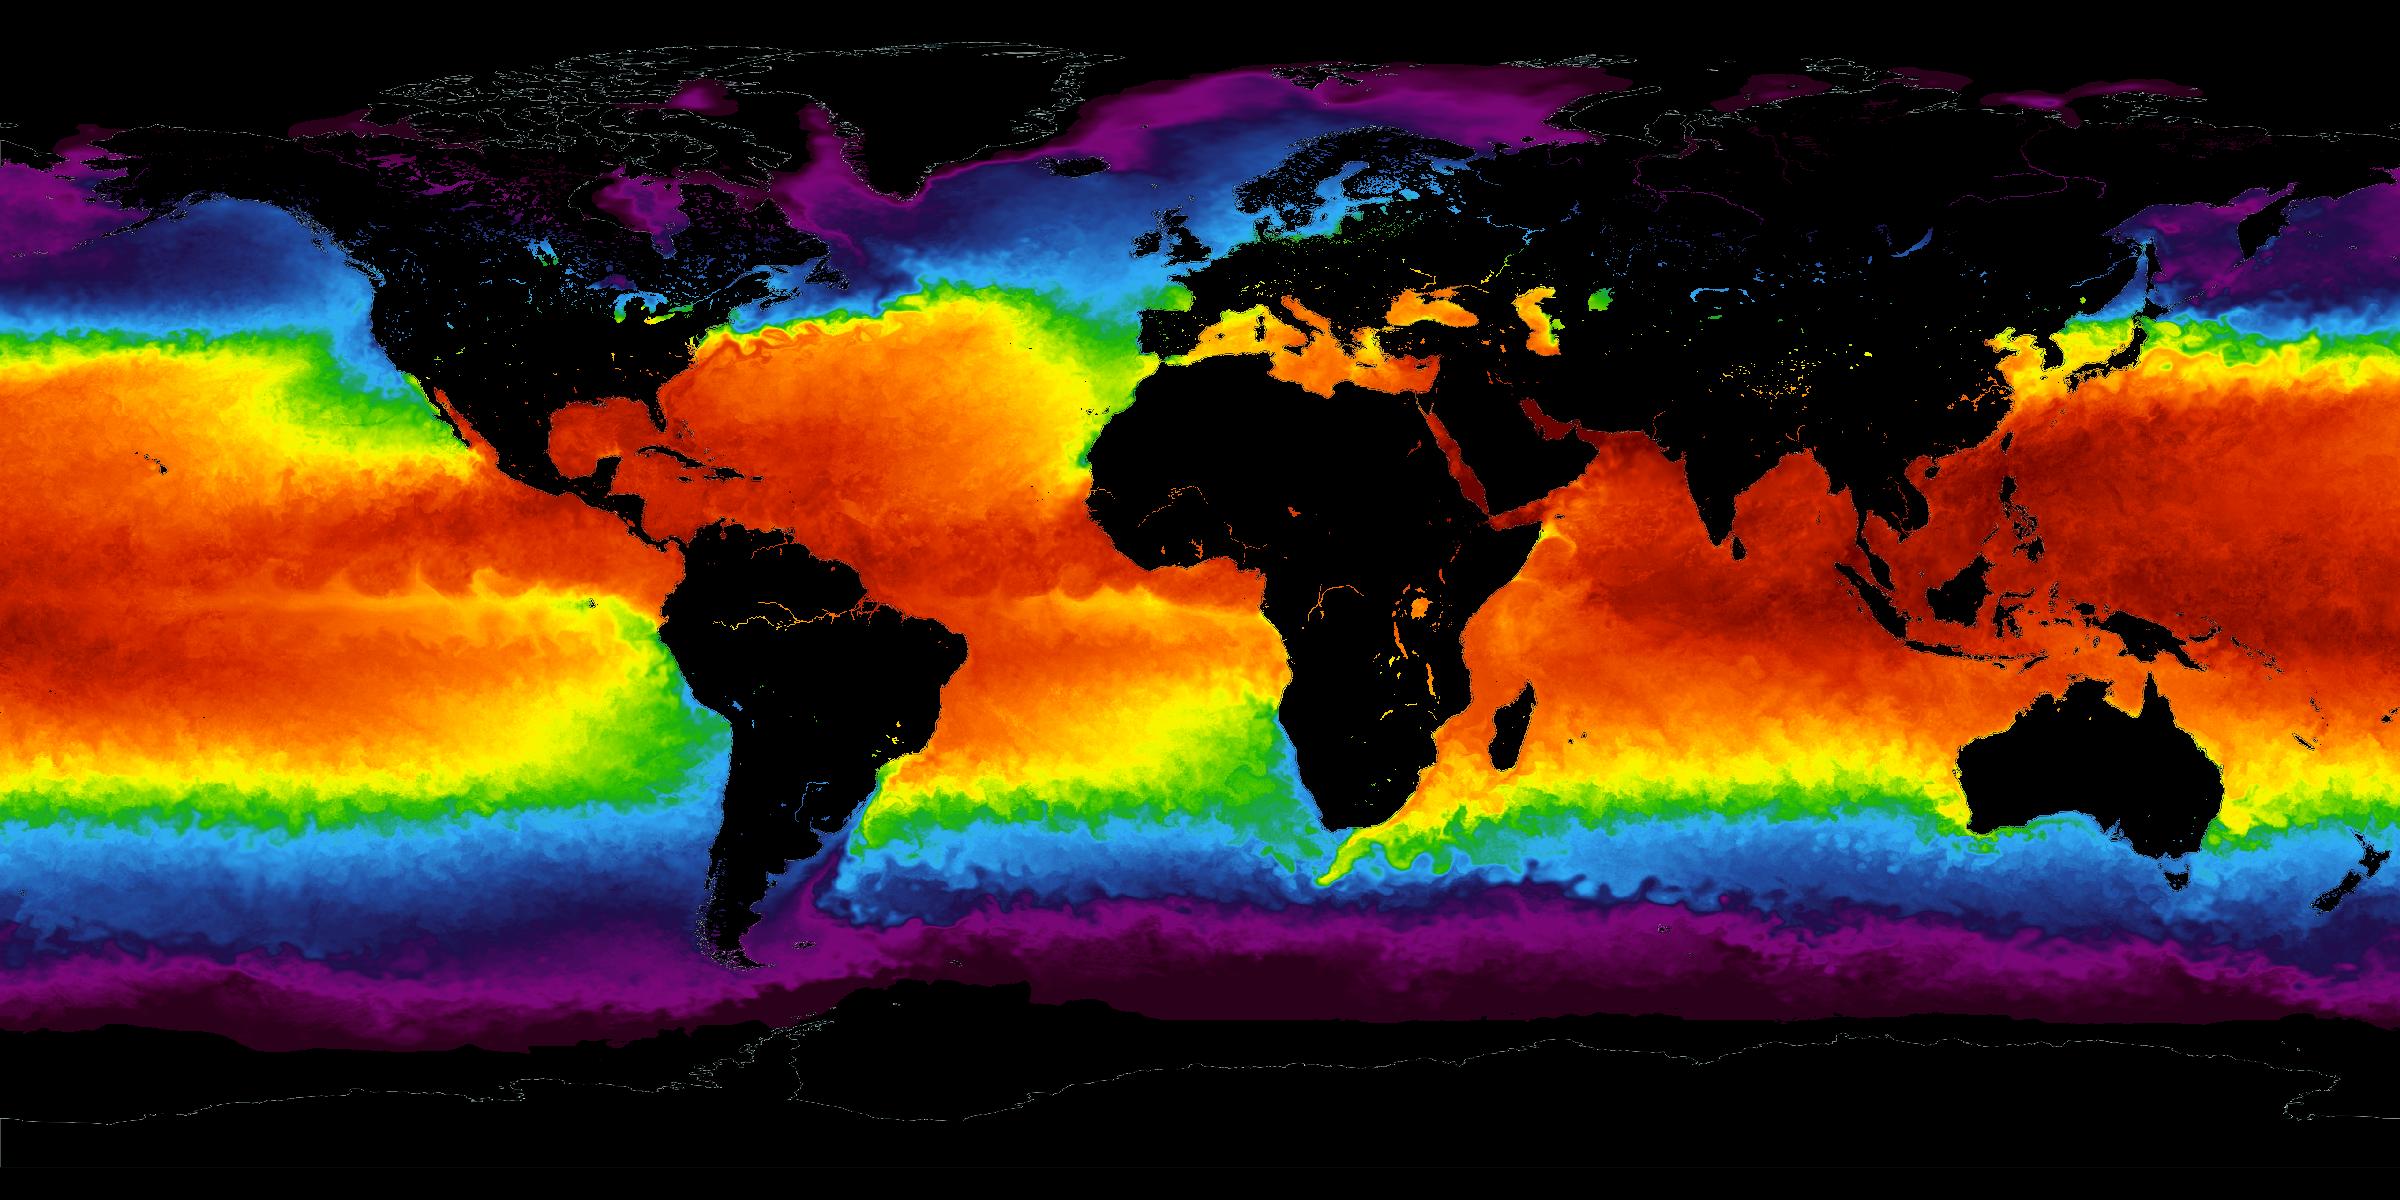
The temperature of the sea surface: the standing climate, and years that run warmer or cooler.
Read the card →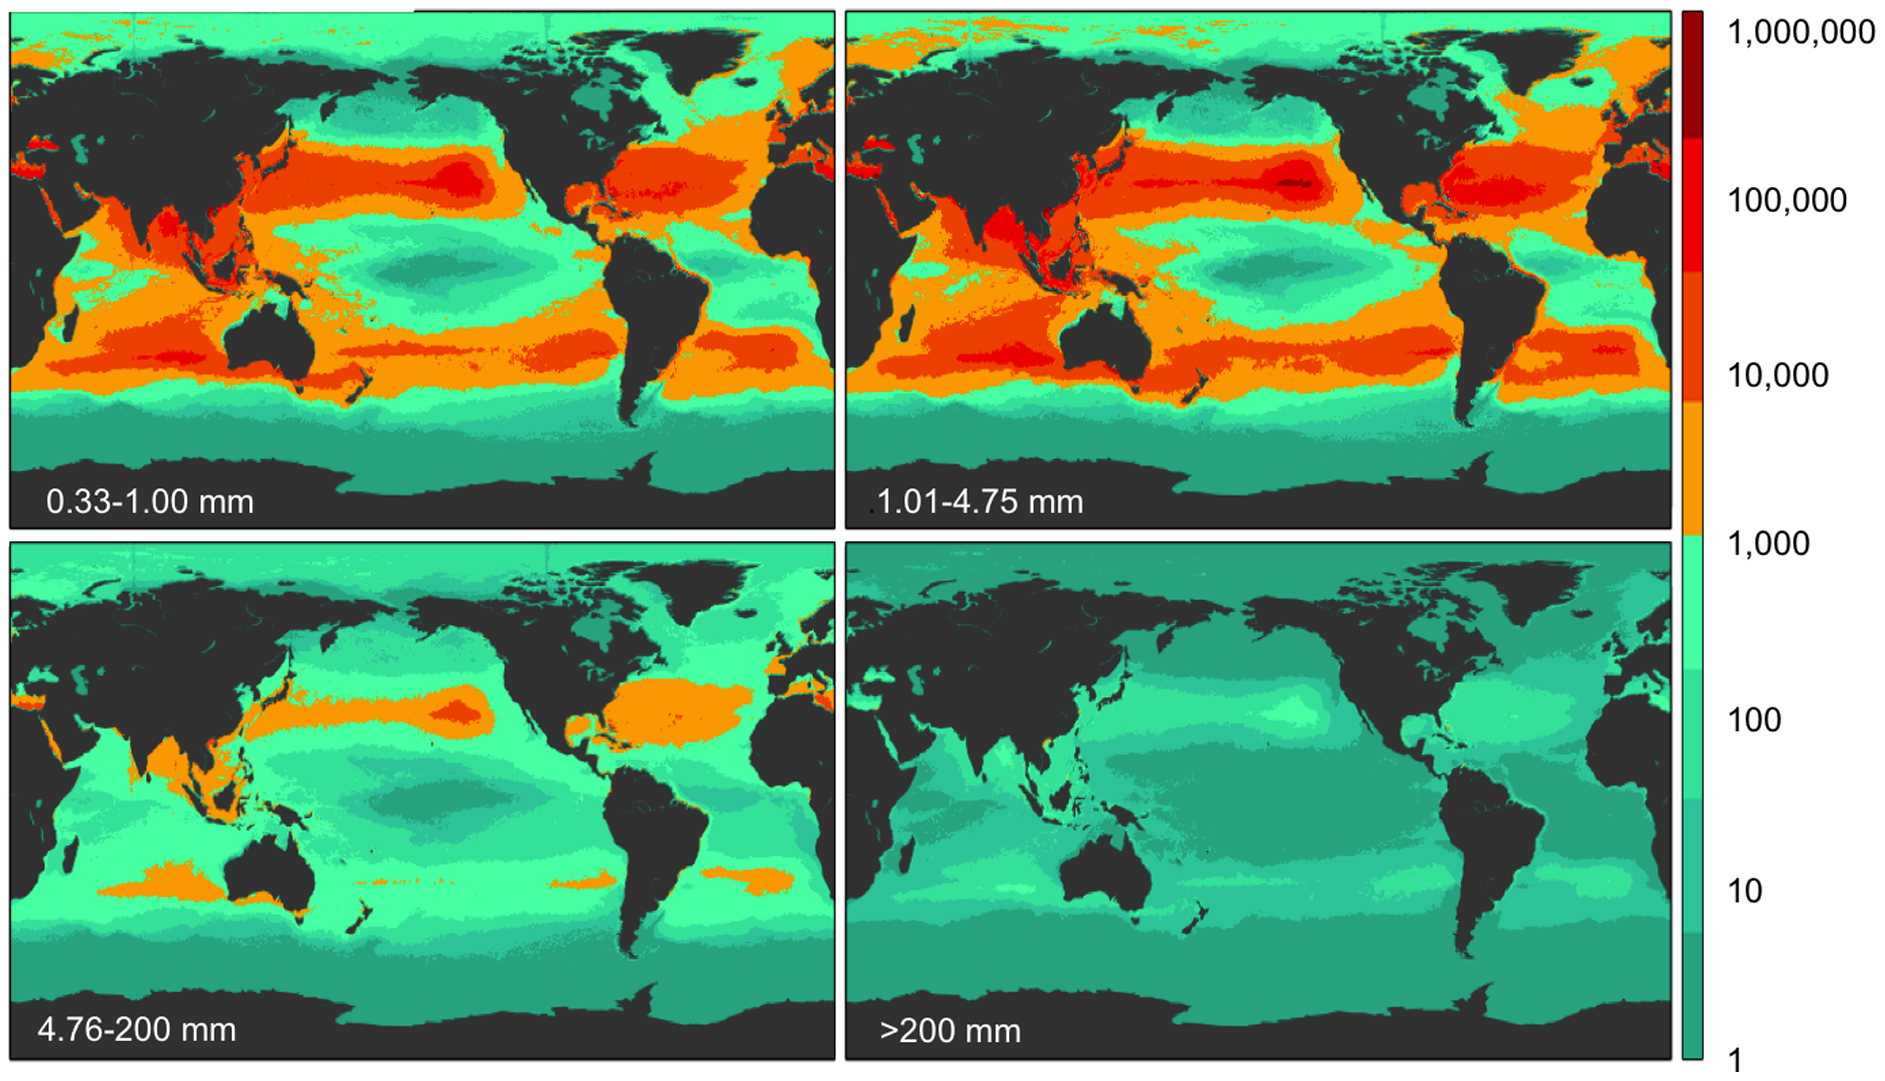
Five subtropical garbage patches, oil, phytoplankton blooms, and coastal dead zones.
Read the card →Heat, acidity, plastic, and hypoxia, each from a named paper.
Read the card →