

Blue carbon
How much carbon mangroves, tidal salt marshes and seagrass meadows hold. The Intergovernmental Panel on Climate Change quotes about 8 billion tonnes of carbon in mangroves, about 0.8 billion in tidal marshes and from 4.2 to 8.4 billion in seagrass meadows.
Carbon stocks · 2013 guidelines
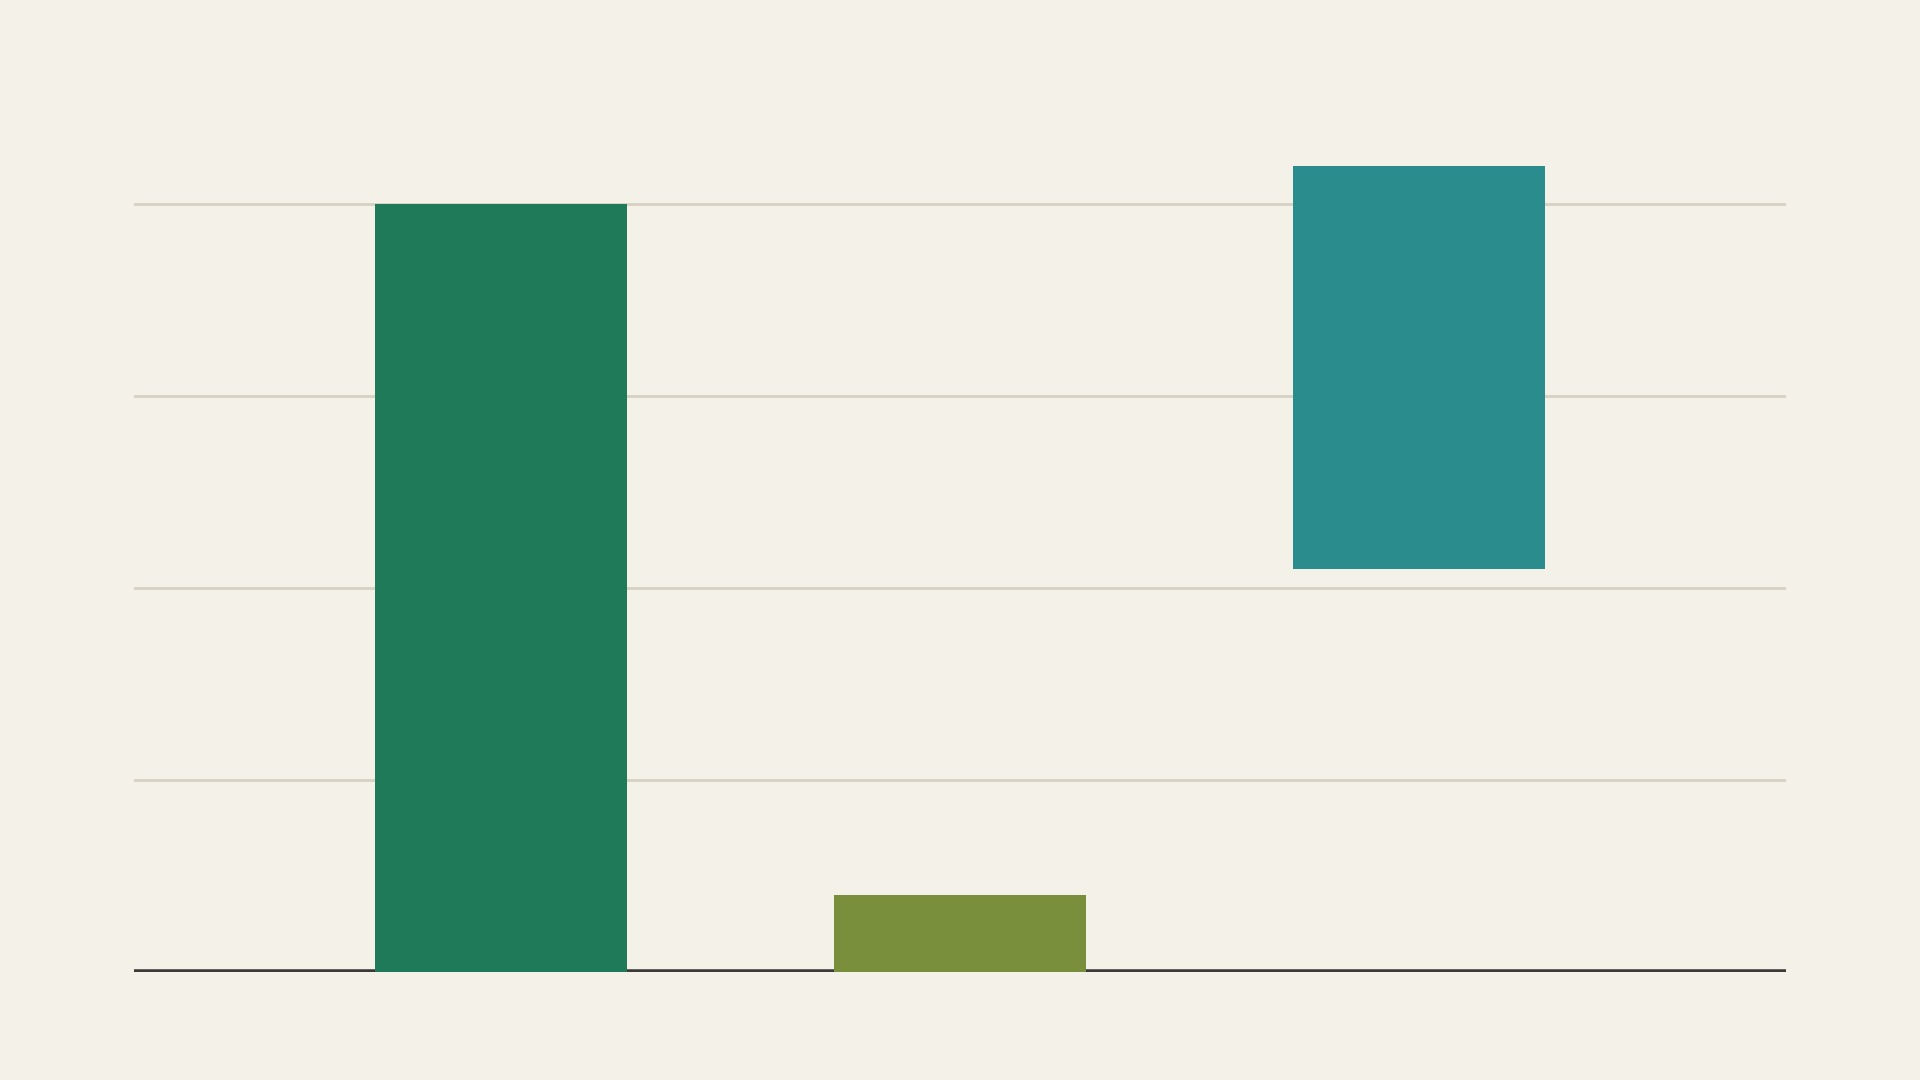
Global carbon stocks in billions of tonnes: mangroves about 8, tidal salt marshes about 0.8 and seagrass meadows from 4.2 to 8.4, as quoted by the Intergovernmental Panel on Climate Change. Gridlines mark every 2 billion tonnes.
Chart by Fix Planet from the global stock estimates quoted in chapter 4 of the 2013 Wetlands Supplement of the Intergovernmental Panel on Climate Change. Only the published numbers are used and no open licence applies to them. Copyright terms of the source: https://www.ipcc.ch/copyright/
What it is
Blue carbon is the carbon captured by the world’s ocean and coastal ecosystems, held mostly in mangroves, tidal salt marshes and seagrass meadows. The 2013 Wetlands Supplement of the Intergovernmental Panel on Climate Change gives countries the methods to count emissions and removals from managed coastal wetlands in their greenhouse gas inventories. The International Blue Carbon Initiative, a team of 34 experts, wrote a manual with standard protocols for sampling, laboratory measurement and analysis of carbon stocks and emissions in these habitats.
Why it matters
Most of the carbon in these habitats lies in the soil, and the National Oceanic and Atmospheric Administration of the United States notes that carbon in coastal soil is often thousands of years old. The chapter on coastal wetlands in the Supplement quotes global stocks of about 8 billion tonnes of carbon in mangroves, about 0.8 billion tonnes in tidal marshes and from 4.2 to 8.4 billion tonnes in seagrass meadows. The chapter writes these as petagrams of carbon, and one petagram is one billion tonnes. When coastal habitats are damaged, carbon returns to the air, so protecting them keeps the stored carbon in place.
How to read it
The three bars are global stock estimates in billions of tonnes of carbon. From left to right: mangroves about 8, tidal marshes about 0.8, and seagrass meadows from 4.2 to 8.4, drawn as a floating bar that spans the range. Gridlines mark every 2 billion tonnes. A stock is carbon held at one time, which differs from the amount a habitat removes from the air each year. The three estimates come from three different studies, published in 2011 and 2012, so they are rough guides to scale. Countries can report with standard default values or, where they have better data, with their own measurements.
Limits
The stock figures are estimates, and the seagrass range is wide, from 4.2 to 8.4 billion tonnes. They depend on how large each habitat is judged to be, and mapping is incomplete for all three. The chart shows stocks, so it says nothing about how fast each habitat adds carbon, which varies with place and condition. Default values give a national picture, while measurements on the ground can differ from them.
Sources
- Intergovernmental Panel on Climate Change, Task Force on National Greenhouse Gas Inventories: 2013 Supplement to the 2006 Guidelines for National Greenhouse Gas Inventories: Wetlands (publication page) : https://www.ipcc-nggip.iges.or.jp/public/wetlands/
- Intergovernmental Panel on Climate Change: Wetlands Supplement, Chapter 4 Coastal Wetlands (PDF) : https://www.ipcc-nggip.iges.or.jp/public/wetlands/pdf/Wetlands_separate_files/WS_Chp4_Coastal_Wetlands.pdf
- International Blue Carbon Initiative: Coastal Blue Carbon, methods for assessing carbon stocks and emissions factors (manual page) : https://www.thebluecarboninitiative.org/manual
- National Oceanic and Atmospheric Administration, National Ocean Service: What is Blue Carbon? : https://oceanservice.noaa.gov/facts/bluecarbon.html