

Kelp forests
How kelp forests have changed at 1,138 monitored sites between 1952 and 2015. A 2016 global synthesis found a small average decline, with falls in 38 percent of ecoregions with data, rises in 27 percent and no detectable change in 35 percent.
Observed change · 1952 to 2015
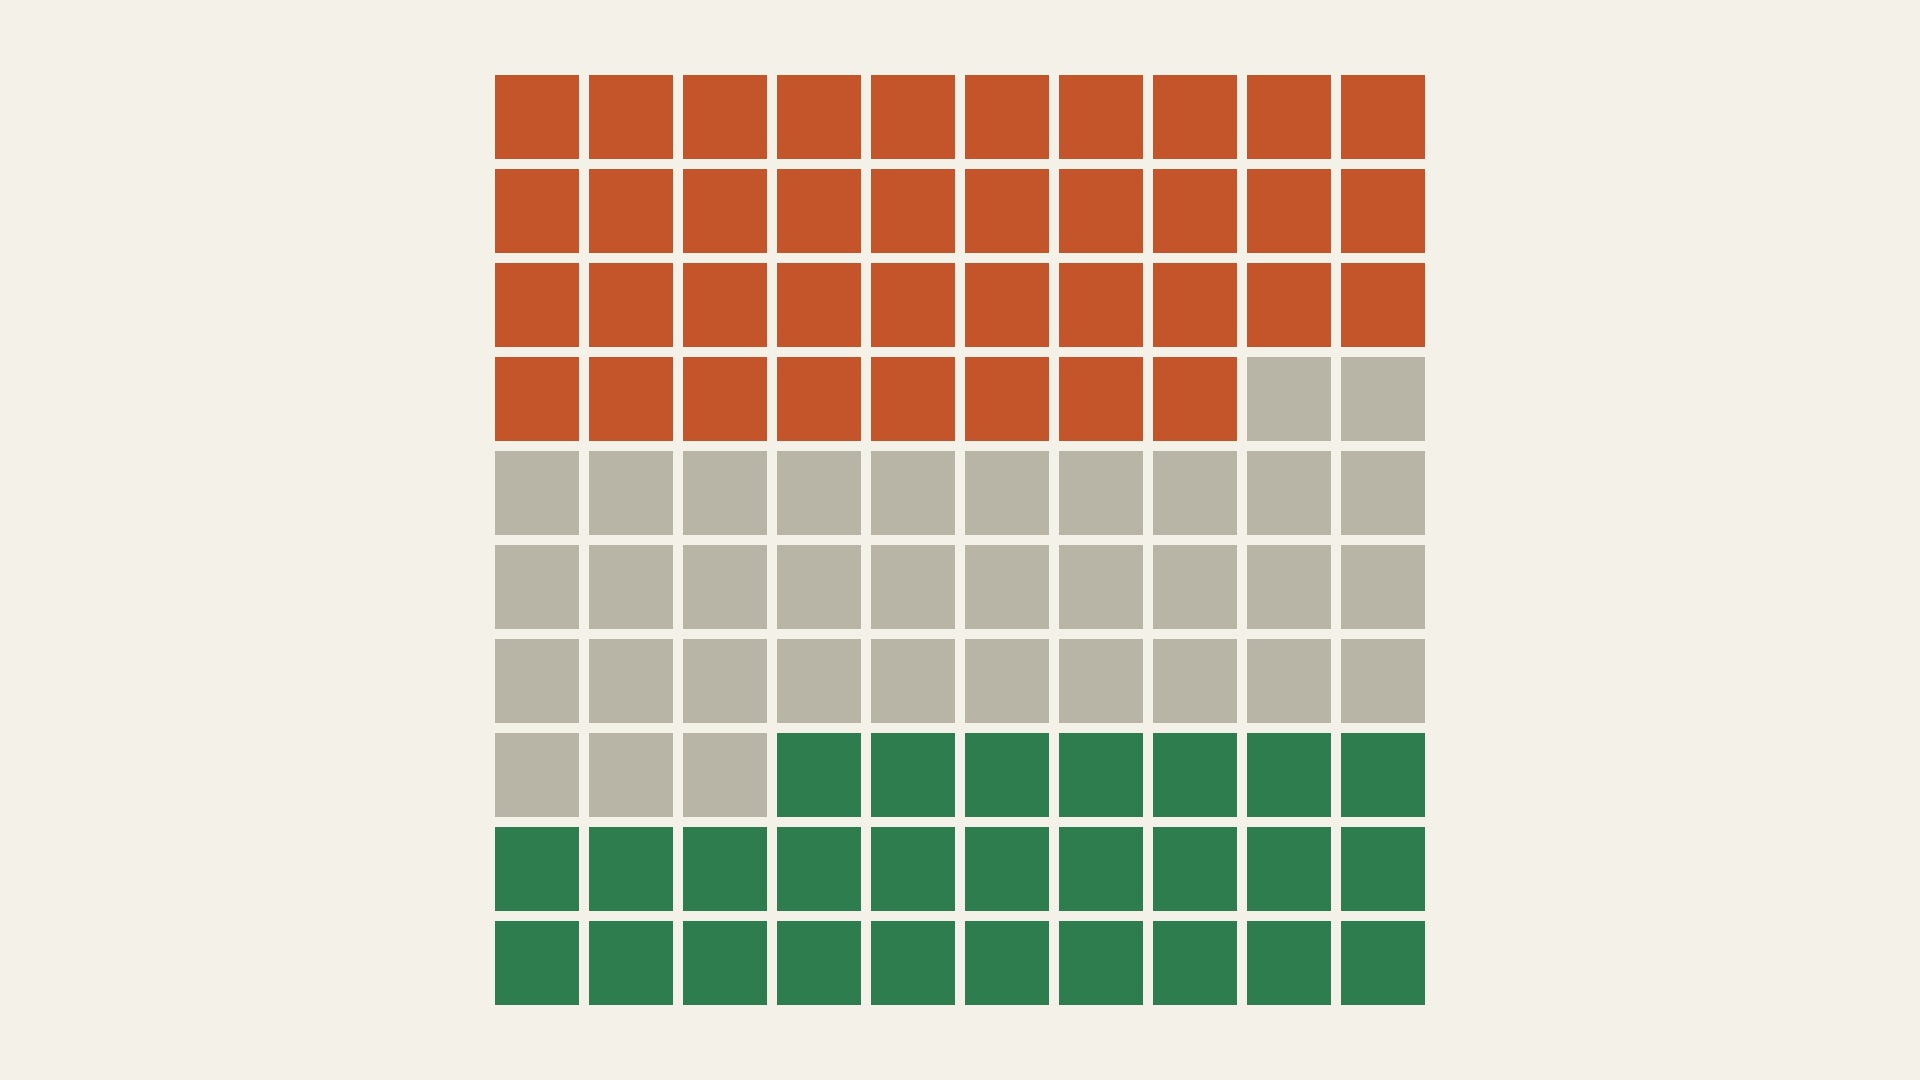
Shares of ecoregions with data, from a 2016 global synthesis of kelp change. In reading order from the top left, 38 orange squares show decline, 35 grey squares show no detectable change and 27 green squares show increase. Each square is one percent.
Chart by Fix Planet from percentages reported by Krumhansl and others, 2016, Proceedings of the National Academy of Sciences 113 (48), pages 13785 to 13790, an article free to read through the journal’s open access option. Only the published percentages are used, and the article states no data licence: https://pmc.ncbi.nlm.nih.gov/articles/PMC5137772/
What it is
Kelps are large brown algae of the order Laminariales. They form underwater forests along the coasts of every continent except Antarctica and occur in 43 percent of the world’s marine ecoregions, which are regions of the ocean with distinct species and conditions. In 2016 Krumhansl and colleagues published a global synthesis of kelp change, assembled from records at 1,138 sites collected between 1952 and 2015.
Why it matters
Kelp forests support diverse and productive communities along temperate and Arctic coasts, and kelp responds quickly to its environment, so it works as an early sign of change. The synthesis found a small average decline, an instantaneous rate of change of 0.018 per year, which is a loss of about 1.8 percent a year, with regional differences far larger than that average. Among the ecoregions with enough data, 38 percent showed declines, 27 percent showed increases and 35 percent showed no detectable change.
How to read it
The 100 squares stand for the ecoregions with data. Reading from the top left, the 38 orange squares are ecoregions with declines, the 35 grey squares have no detectable change and the 27 green squares have increases. The yearly rates in ecoregions with declines ranged from 0.015 to 0.18, and in ecoregions with increases from 0.015 to 0.11.
Limits
Time series exist only where researchers have monitored kelp, and the paper notes uncertainty in some regions because data coverage in space and time is poor. The 35 percent with no detectable change may include places where sparse data hide a trend. The paper links declines to warming water in places such as the Gulf of Maine and to the loss of sea urchin predators through fishing, and it links increases to successful local management in places such as the west coast of Vancouver Island and the Southern California Bight. The average hides this variety, so a local forest can follow a very different path.
Sources
- Krumhansl and others: Global patterns of kelp forest change over the past half-century (Proceedings of the National Academy of Sciences, 2016, full text) : https://pmc.ncbi.nlm.nih.gov/articles/PMC5137772/