

Climate
Surface temperature anomalies
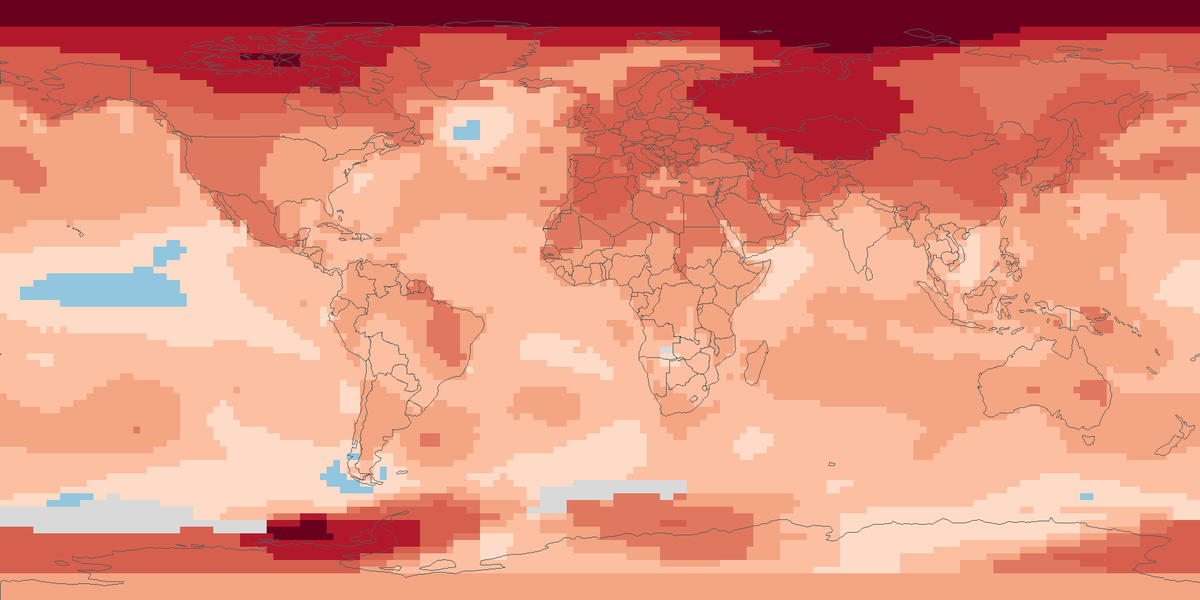
Surface temperature across the globe in 2025, shown as the difference from the 1951 to 1980 average.
Read the cardOpen climate maps from public datasets: surface temperature anomalies, precipitation on land, drought, outdoor heat stress and snow cover, each for a recent year or month.
Surface temperature across the globe in 2025, shown as the difference from the 1951 to 1980 average.
Read the card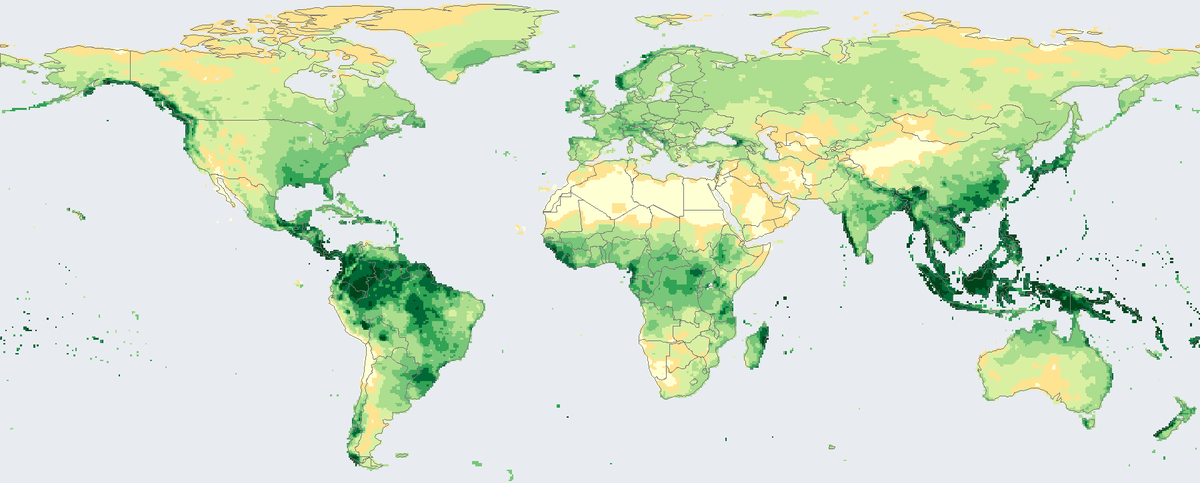
Total rain and snow that fell on land in 2024, in millimetres, from rain-gauge stations on a 0.5 degree grid.
Read the card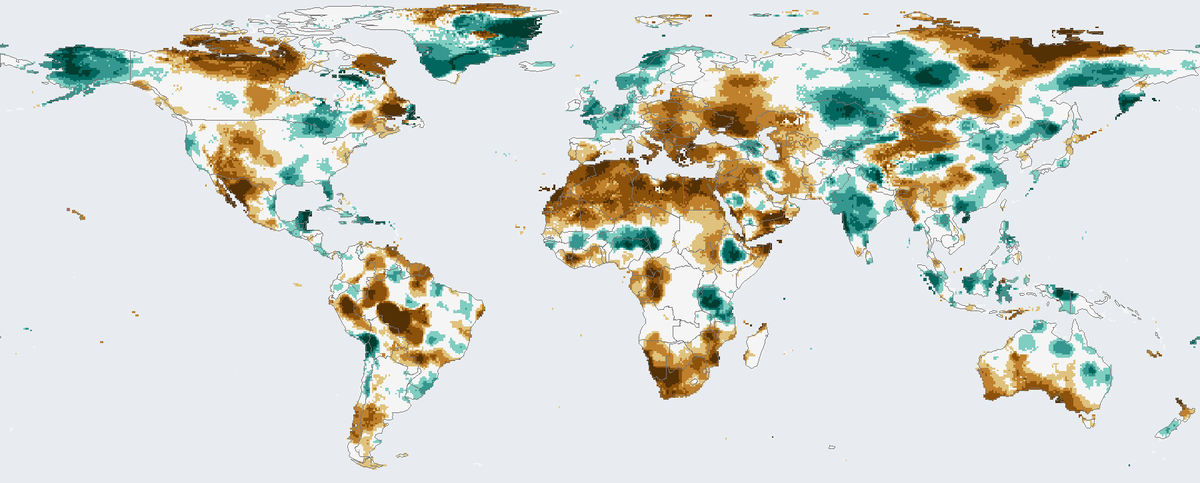
How much drier or wetter than usual the twelve months to December 2024 were on land, counting rainfall and evaporation.
Read the card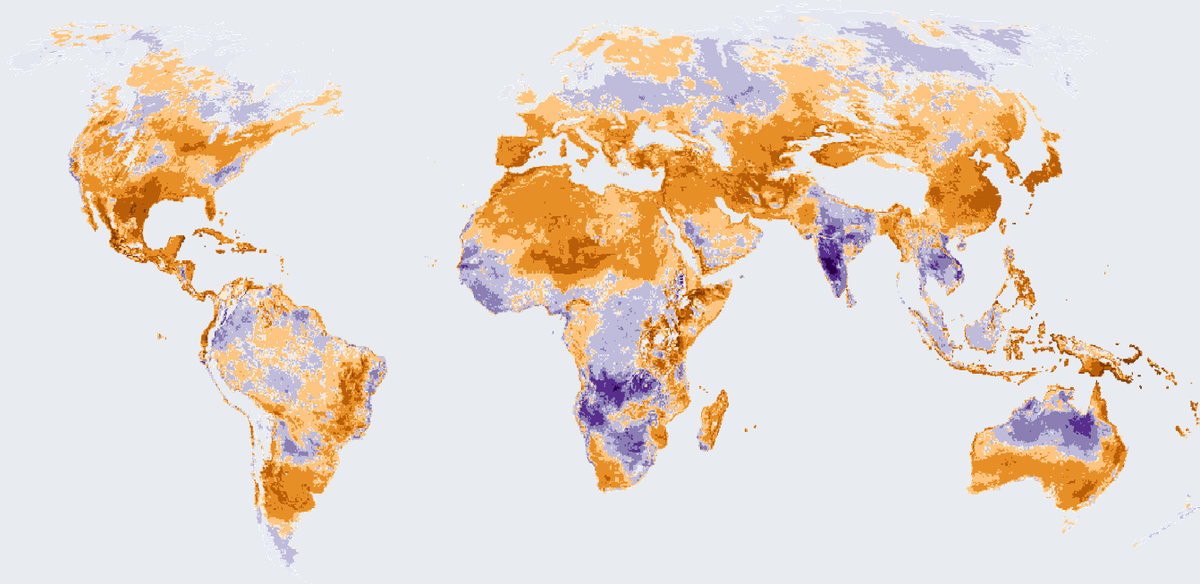
How many more or fewer days than usual brought strong heat stress outdoors in 2025, on land worldwide except Antarctica.
Read the card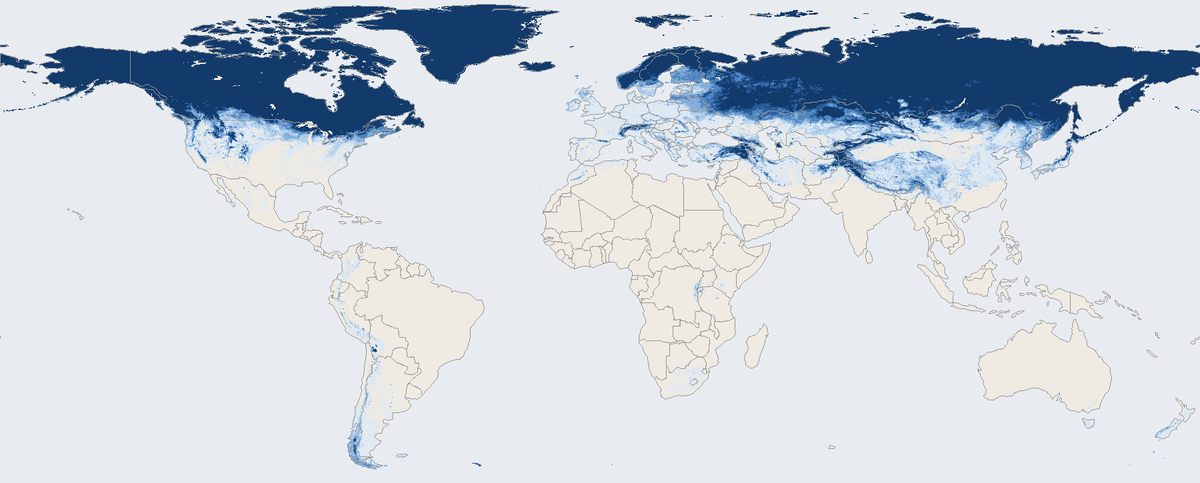
Share of days with snow on the ground across the world's land in March 2026, seen by a satellite instrument.
Read the card