

Climate
Surface temperature anomalies
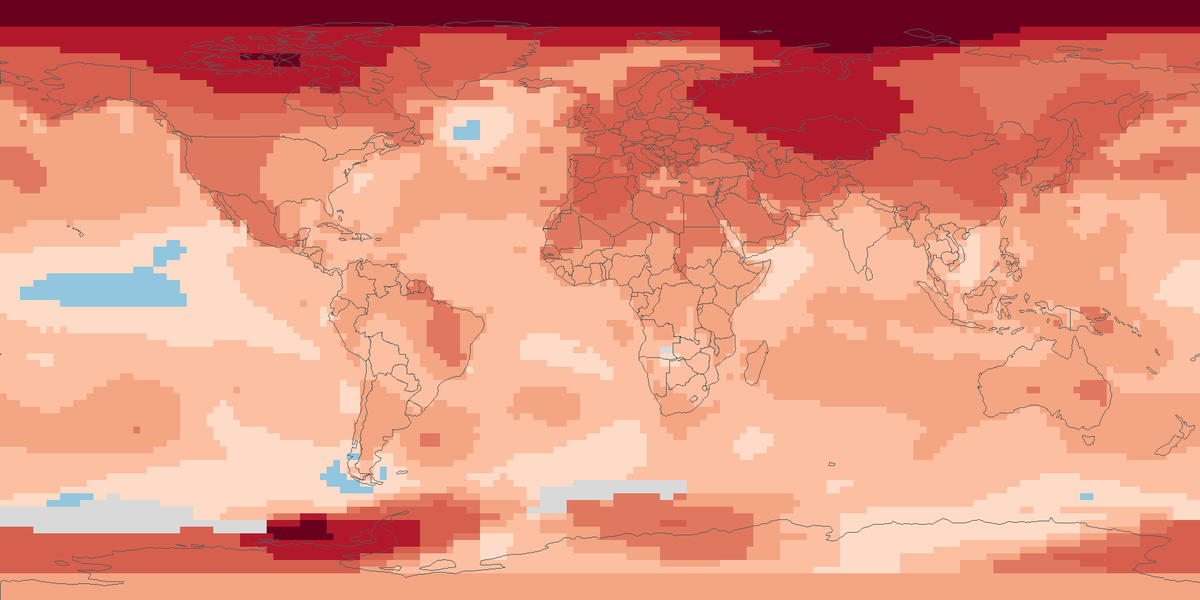
Surface temperature across the globe in 2025, shown as the difference from the 1951 to 1980 average.
Read the cardHow many more or fewer days than usual brought strong heat stress outdoors in 2025, on land worldwide except Antarctica.
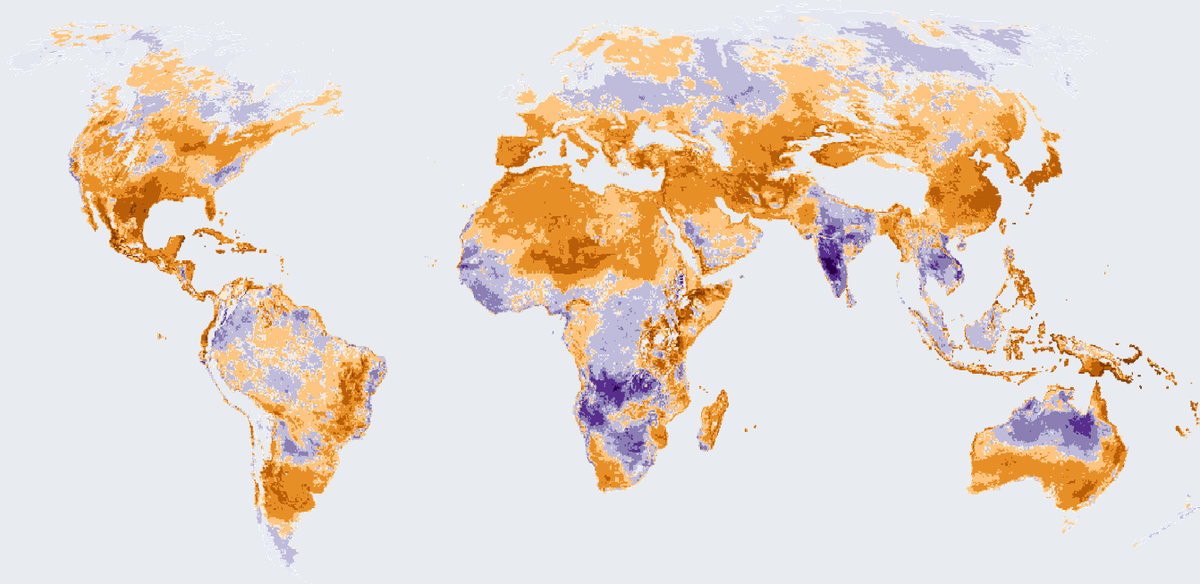
Colours show the change in the number of days with at least strong heat stress in 2025 compared with the 1991 to 2020 average.
Change in the number of days with at least strong outdoor heat stress in 2025, against the 1991 to 2020 average. The picture is the published figure from the Global Climate Highlights 2025 report, with the colours changed and the map turned so north is up.
Map: Fix Planet, from the map of the Copernicus Climate Change Service and the European Centre for Medium-Range Weather Forecasts in the Global Climate Highlights 2025 report, based on the Universal Thermal Climate Index from the reanalysis of the European Centre for Medium-Range Weather Forecasts. Contains modified Copernicus Climate Change Service information 2026. Neither the European Commission nor the European Centre for Medium-Range Weather Forecasts is responsible for any use of the information. Licence: Copernicus.
The Copernicus Climate Change Service offers a dataset of thermal comfort indices, produced by the European Centre for Medium-Range Weather Forecasts from its atmospheric reanalysis, which combines model data with observations from across the world into a complete and consistent description of the climate. One of them is the Universal Thermal Climate Index, a feels-like temperature in degrees Celsius that combines air temperature, humidity, wind and radiation. The data cover the globe except Antarctica on a 0.25 degree grid, from January 1940 to near real time. A day with at least strong heat stress is a day on which the feels-like temperature reaches 32 °C or more.
In 2025, 50% of the globe's land, excluding Antarctica, had more days than average with at least strong heat stress. In parts of the southern United States and eastern Asia there were up to 45 more such days than average, and central Africa had up to around 110 more days with very strong heat stress, a feels-like temperature of 38 °C or above. Most of Australia and parts of northern Africa and the Arabian Peninsula had more extreme heat stress days than average. Up to a third of the globe, including southern Africa and southern Asia, had fewer heat stress days than average.
Each colour shows how many days more or fewer than the 1991 to 2020 average had at least strong heat stress in 2025. Brown and orange mean more days, near white and cream mean close to the average, and purple means fewer days. The stronger the colour, the larger the difference. The ocean and Antarctica are left blank.
The feels-like temperature is calculated from reanalysis output on a 0.25 degree grid, and Antarctica is outside the dataset. The map shows only the change in the number of days compared with the 1991 to 2020 average. The heat stress categories begin at 26 °C for moderate, 32 °C for strong, 38 °C for very strong and 46 °C for extreme. Downloading the gridded data needs a free account of the Copernicus Climate Data Store.
Map: Fix Planet, from the map of the Copernicus Climate Change Service and the European Centre for Medium-Range Weather Forecasts in the Global Climate Highlights 2025 report, based on the Universal Thermal Climate Index from the reanalysis of the European Centre for Medium-Range Weather Forecasts. Contains modified Copernicus Climate Change Service information 2026. Neither the European Commission nor the European Centre for Medium-Range Weather Forecasts is responsible for any use of the information. Licence: Copernicus.
Open source map → Surface temperature across the globe in 2025, shown as the difference from the 1951 to 1980 average.
Read the card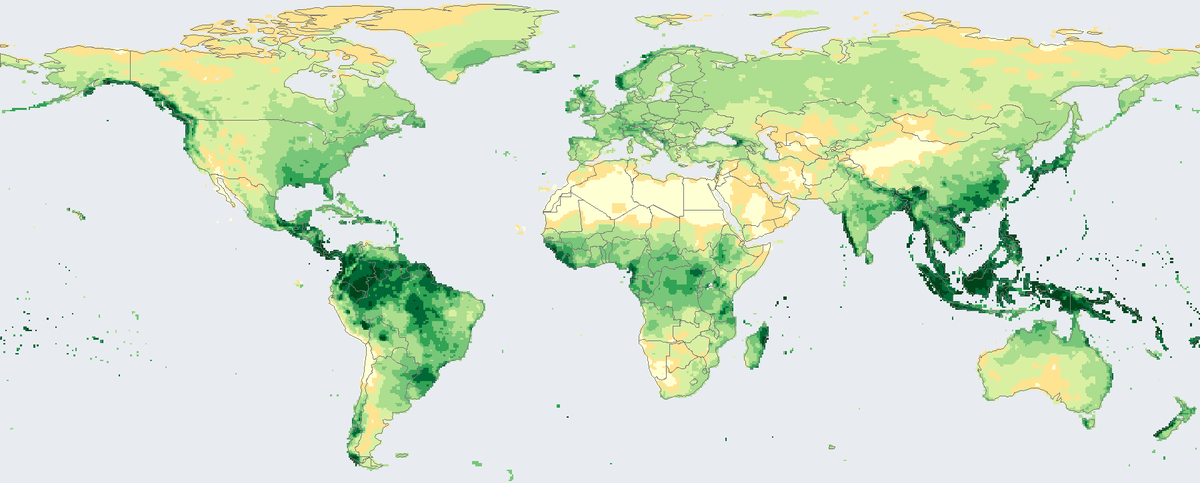
Total rain and snow that fell on land in 2024, in millimetres, from rain-gauge stations on a 0.5 degree grid.
Read the card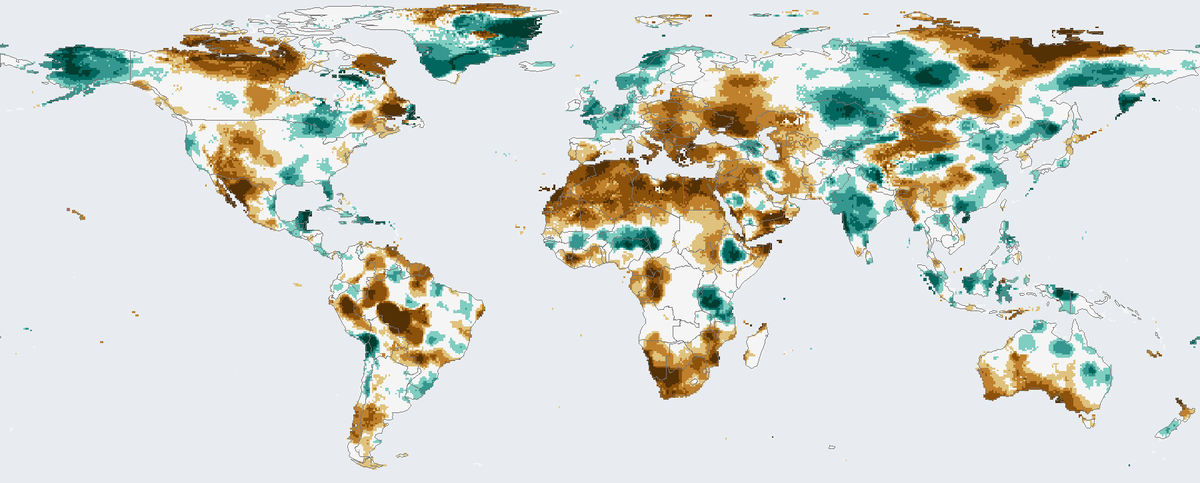
How much drier or wetter than usual the twelve months to December 2024 were on land, counting rainfall and evaporation.
Read the card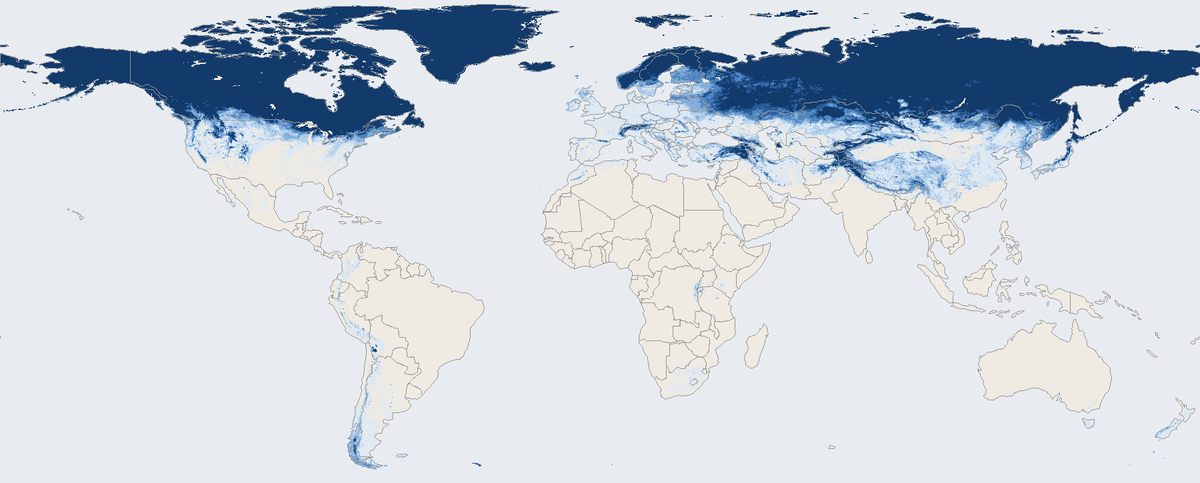
Share of days with snow on the ground across the world's land in March 2026, seen by a satellite instrument.
Read the card