

Climate
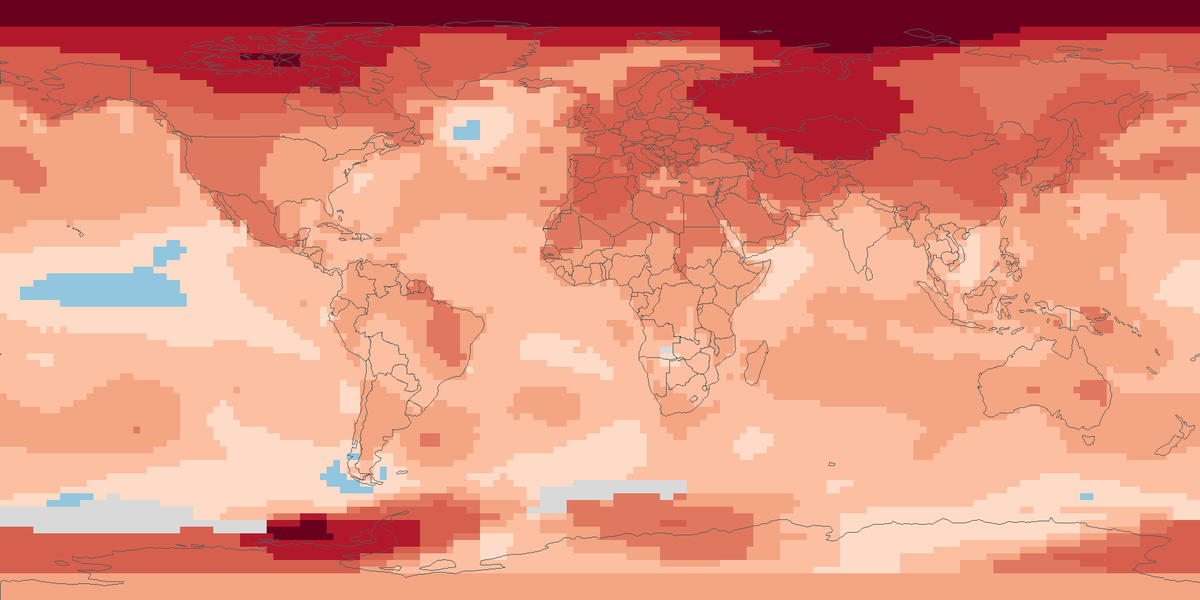
Surface temperature anomalies
Surface temperature across the globe in 2025, shown as the difference from the 1951 to 1980 average.
Read the cardHow much drier or wetter than usual the twelve months to December 2024 were on land, counting rainfall and evaporation.
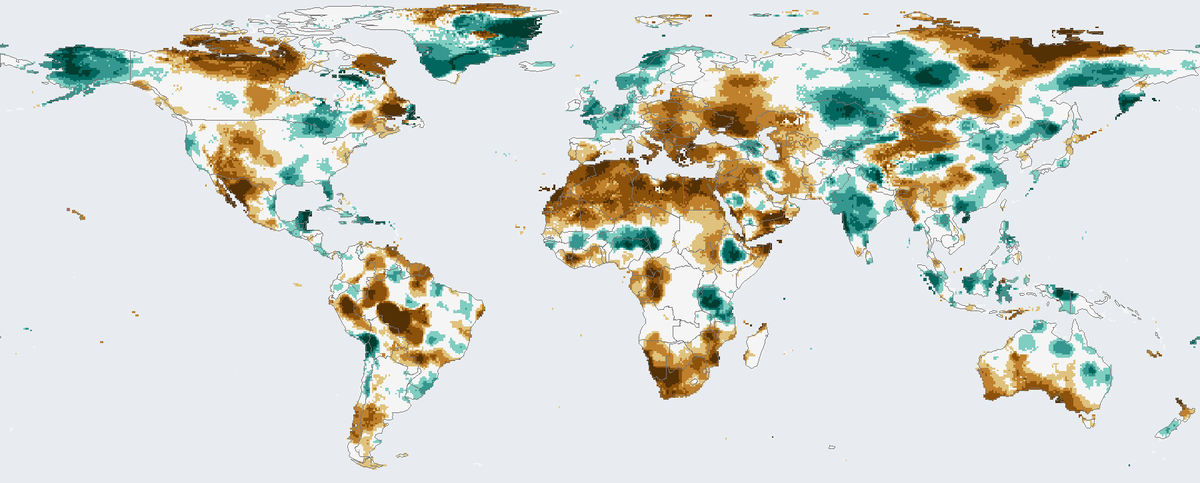
Shading shows the 12-month index for December 2024.
Drought index on a 12-month scale for December 2024, on a 0.5 degree grid over land.
Map: Fix Planet, from the global 0.5 degree drought index database of the Spanish National Research Council, 12-month scale, December 2024. The database is licensed under the Open Database Licence 1.0 and its contents under the Database Contents Licence. Boundaries: Natural Earth, public domain.
The Standardised Precipitation Evapotranspiration Index is published by the Spanish National Research Council (Consejo Superior de Investigaciones Científicas). It uses the monthly difference between precipitation and potential evapotranspiration, the water the air could draw from the ground and plants. This simple climatic water balance is calculated at different time scales. The global database has a 0.5 degree grid and monthly values from January 1901 to December 2024, with time scales from 1 to 48 months, and it covers land only. It is built on monthly climate data from the Climatic Research Unit at the University of East Anglia.
Because the index counts evaporation as well as rainfall, it responds to heat as well as to missing rain. The different time scales suit different parts of the water system, from soil moisture over a few months to rivers and groundwater over a year or more.
Each square shows the 12-month value for December 2024, which covers January to December 2024. The value is a standard score for that place. Zero is a typical year, negative values are drier than usual and shown in brown, and positive values are wetter than usual and shown in teal. The darker the colour, the further from usual.
The current version of the database ends in December 2024. Only land with data is coloured, from about 56 degrees south to about 84 degrees north; ocean and the rest of the globe are light grey-blue. Evaporation demand is calculated from climate data. Each colour compares a place with its own history, so equal colours in a wet region and in a dry region mean different amounts of water.
Map: Fix Planet, from the global 0.5 degree drought index database of the Spanish National Research Council, 12-month scale, December 2024. The database is licensed under the Open Database Licence 1.0 and its contents under the Database Contents Licence. Boundaries: Natural Earth, public domain.
Open source map → Surface temperature across the globe in 2025, shown as the difference from the 1951 to 1980 average.
Read the card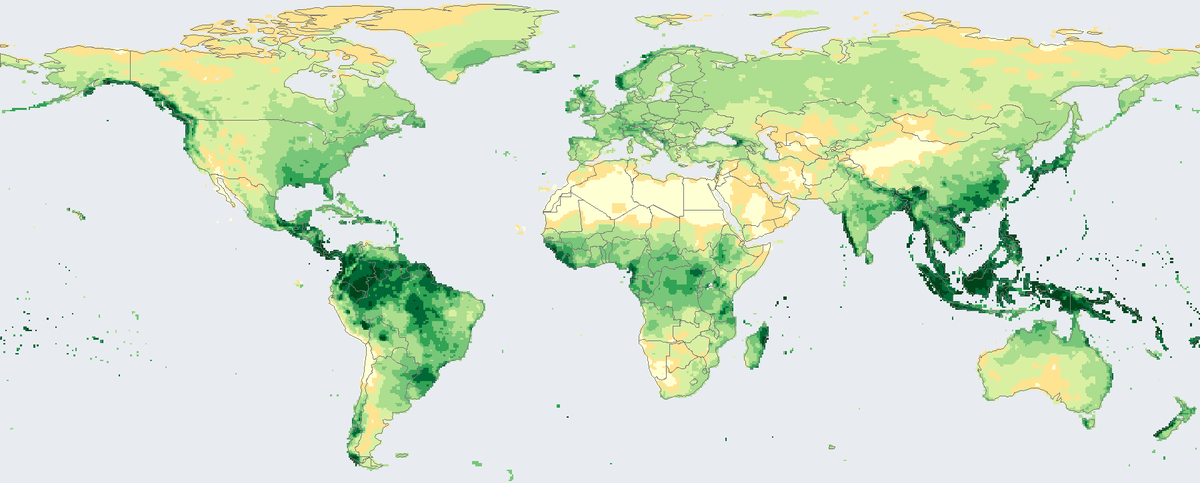
Total rain and snow that fell on land in 2024, in millimetres, from rain-gauge stations on a 0.5 degree grid.
Read the card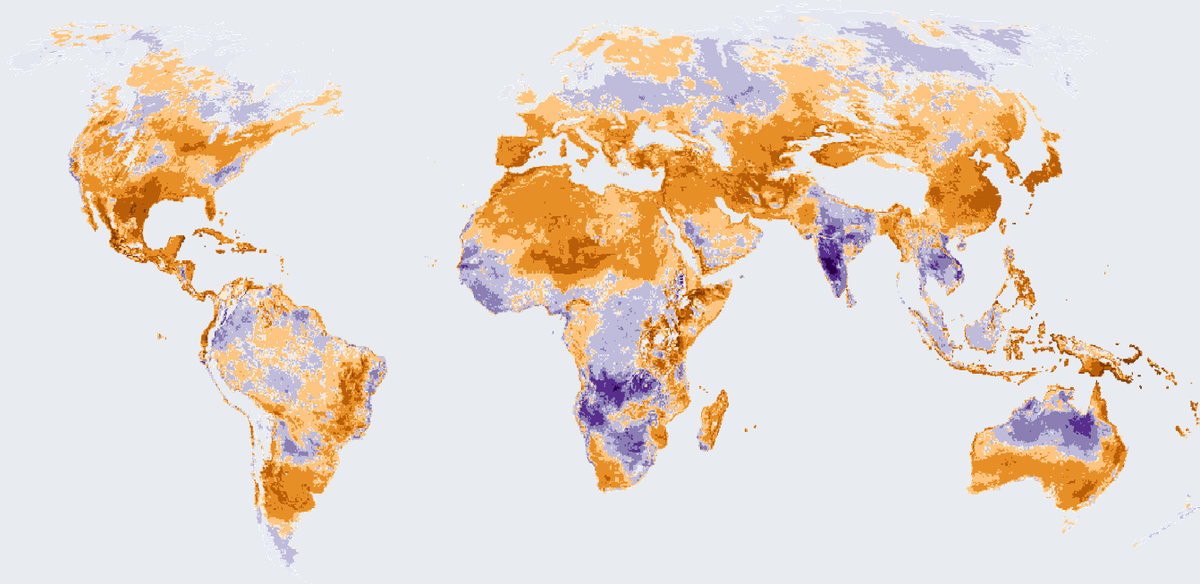
How many more or fewer days than usual brought strong heat stress outdoors in 2025, on land worldwide except Antarctica.
Read the card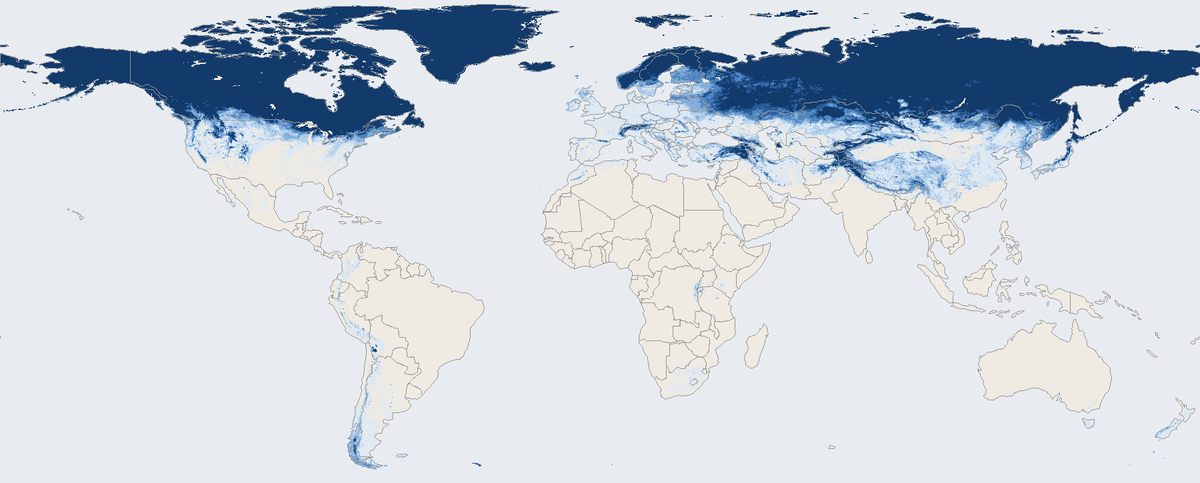
Share of days with snow on the ground across the world's land in March 2026, seen by a satellite instrument.
Read the card