

Climate
Surface temperature anomalies
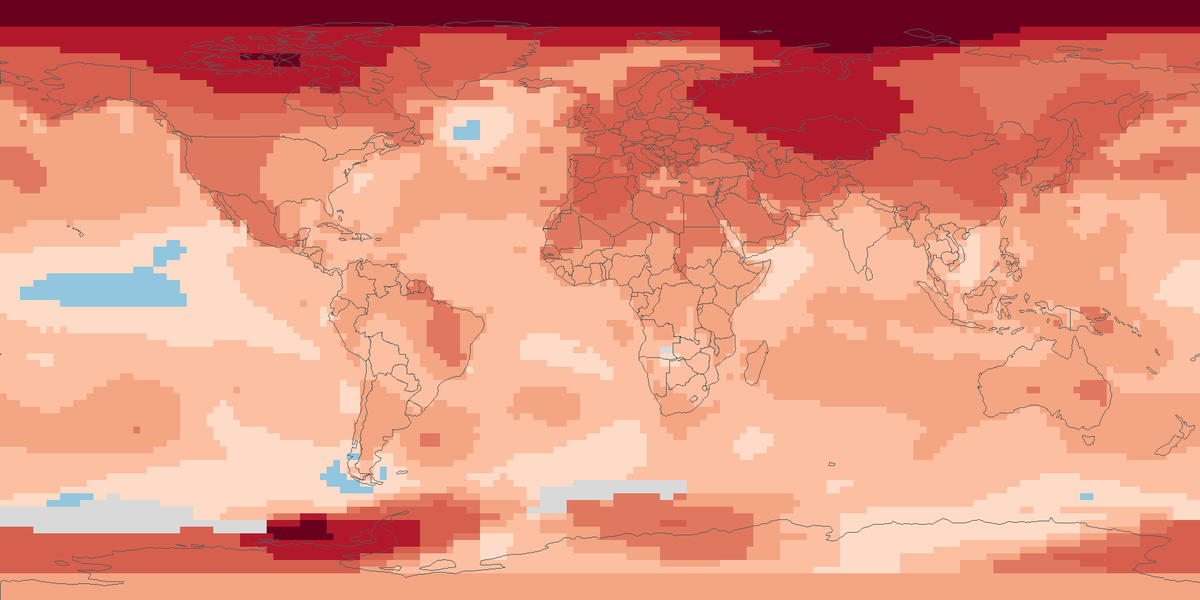
Surface temperature across the globe in 2025, shown as the difference from the 1951 to 1980 average.
Read the cardTotal rain and snow that fell on land in 2024, in millimetres, from rain-gauge stations on a 0.5 degree grid.
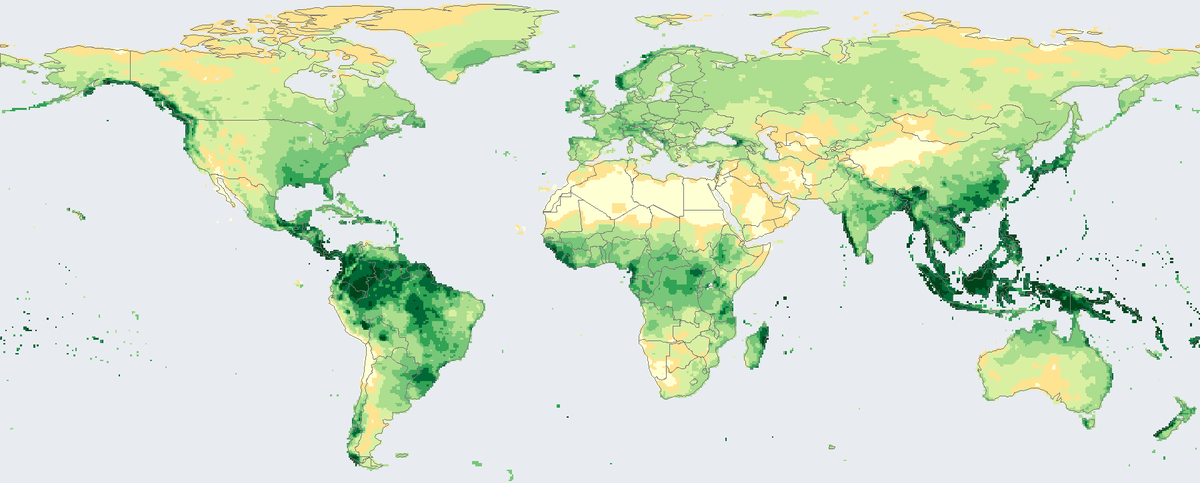
Shading shows the total precipitation of 2024 in millimetres.
Total precipitation on land in 2024 on a 0.5 degree grid, from rain-gauge stations.
Map: Fix Planet, from the monthly precipitation analysis of the Global Precipitation Climatology Centre at the Deutscher Wetterdienst (German Weather Service), 0.5 degree grid, 2024. Product users are kindly asked to refer to the Global Precipitation Climatology Centre and to quote the citation (https://doi.org/10.5676/DWD_GPCC/MONTHLY_V2025_050). Terms of use: https://www.dwd.de/EN/ourservices/gpcc/editorial/userterms_gpcc.html. Boundaries: Natural Earth, public domain.
The Global Precipitation Climatology Centre supports climate monitoring and research. It is operated by the Deutscher Wetterdienst (German Weather Service) under the auspices of the World Meteorological Organization. From rain-gauge stations on land it builds gridded monthly precipitation, and its monthly analysis comes at several grid sizes from 0.25 to 2.5 degrees and covers the period from 1891 to the present. The map uses the 0.5 degree grid.
The record runs from 1891, so the product that maps 2024 also supports comparisons across more than a century. The producer recommends the monthly analysis for checking hydrometeorological models and for studying the water cycle.
Each square is 0.5 by 0.5 degrees and shows the total precipitation of 2024 in millimetres, the sum of the twelve monthly values. One millimetre is one litre of water on each square metre. Pale yellow is dry, and the greens grow darker as the yearly total rises. The largest totals are in the wet tropics, and the driest squares lie in deserts.
Only land is covered. A square is coloured only when all twelve months have a value, and everything else, including all ocean, is light grey-blue. The number of stations behind the monthly values varies from fewer than 10,000 to more than 52,000 across the world, so sparsely observed regions are less certain. The producer advises users to take the number of stations per square into account and to apply correction factors for systematic gauge measuring errors. The product is updated at irregular intervals.
Map: Fix Planet, from the monthly precipitation analysis of the Global Precipitation Climatology Centre at the Deutscher Wetterdienst (German Weather Service), 0.5 degree grid, 2024. Product users are kindly asked to refer to the Global Precipitation Climatology Centre and to quote the citation (https://doi.org/10.5676/DWD_GPCC/MONTHLY_V2025_050). Terms of use: https://www.dwd.de/EN/ourservices/gpcc/editorial/userterms_gpcc.html. Boundaries: Natural Earth, public domain.
Open source map → Surface temperature across the globe in 2025, shown as the difference from the 1951 to 1980 average.
Read the card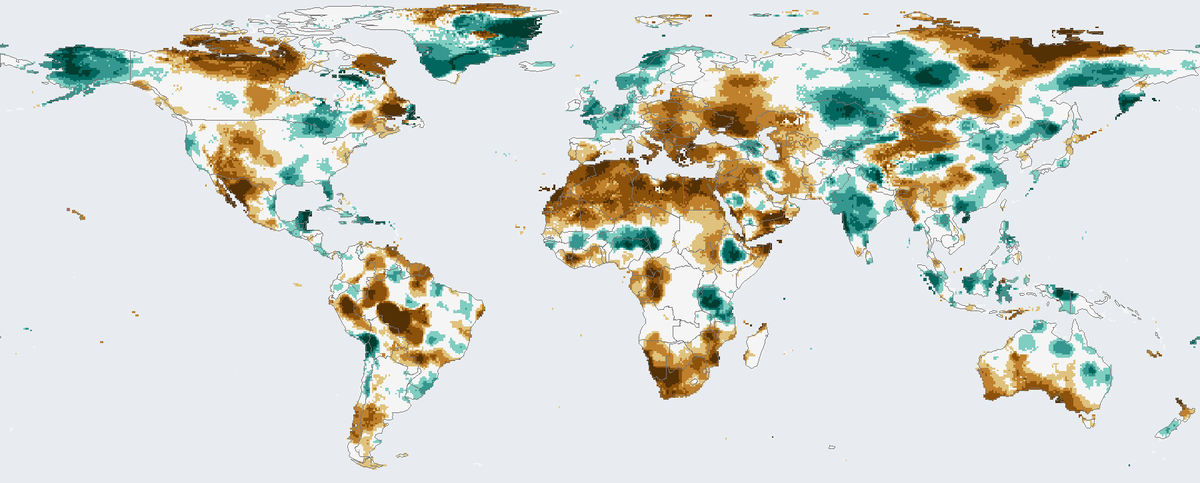
How much drier or wetter than usual the twelve months to December 2024 were on land, counting rainfall and evaporation.
Read the card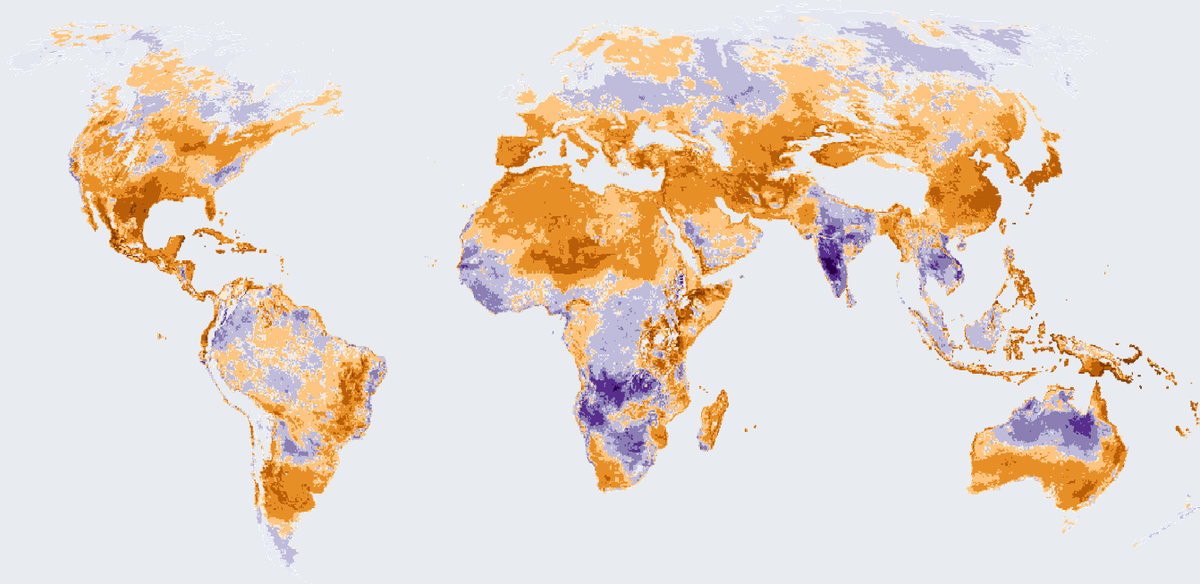
How many more or fewer days than usual brought strong heat stress outdoors in 2025, on land worldwide except Antarctica.
Read the card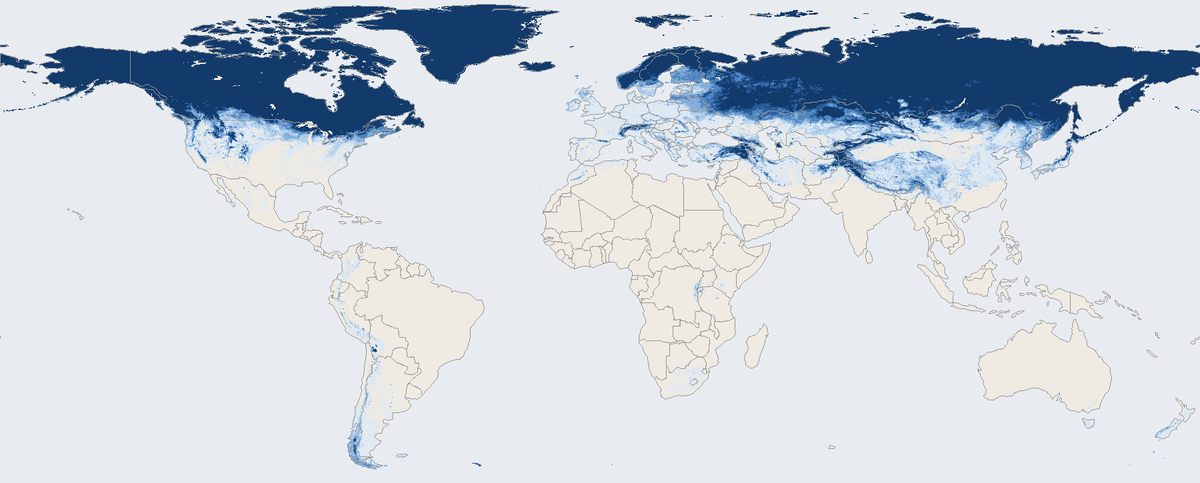
Share of days with snow on the ground across the world's land in March 2026, seen by a satellite instrument.
Read the card