

Climate
Land precipitation
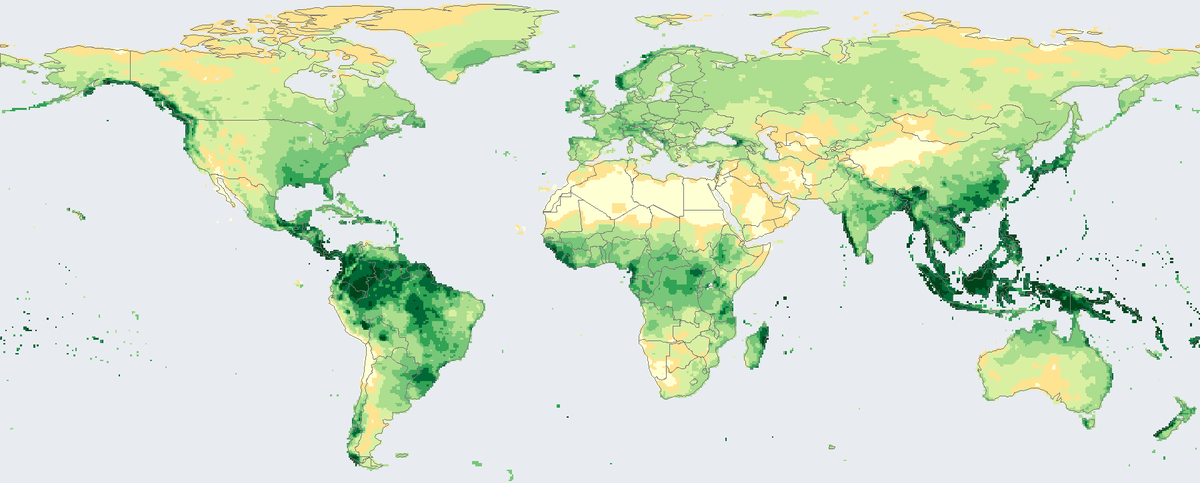
Total rain and snow that fell on land in 2024, in millimetres, from rain-gauge stations on a 0.5 degree grid.
Read the cardSurface temperature across the globe in 2025, shown as the difference from the 1951 to 1980 average.
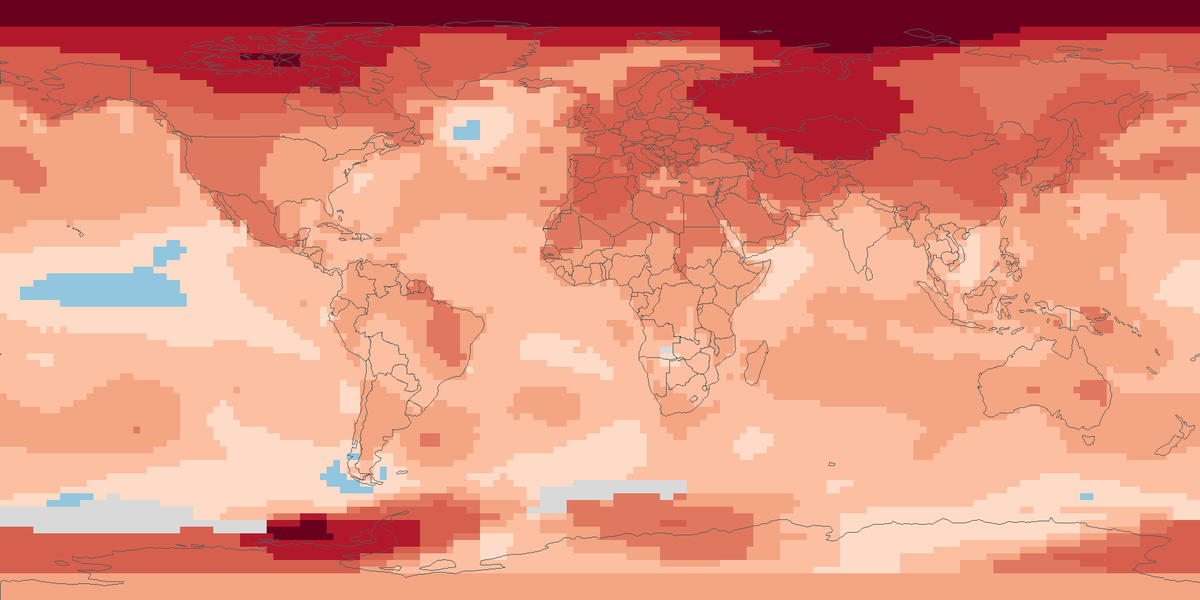
Shading shows the 2025 anomaly in degrees Celsius against 1951 to 1980.
Surface temperature anomaly in 2025 on a 2 by 2 degree grid, against the 1951 to 1980 average.
Map: Fix Planet, from the surface temperature analysis of the Goddard Institute for Space Studies of the National Aeronautics and Space Administration (monthly 2 by 2 degree grid, 1200 kilometre smoothing), as distributed by the Physical Sciences Laboratory of the National Oceanic and Atmospheric Administration. The agency's data are released under Creative Commons Zero; citation is requested. Boundaries: Natural Earth, public domain.
The Goddard Institute for Space Studies, part of the National Aeronautics and Space Administration, publishes a global surface temperature analysis. It combines land weather-station records with an analysis of sea-surface temperatures, and the analysis includes more than 25,000 meteorological stations. Results are anomalies in degrees Celsius: how much warmer or cooler a place is than its own 1951 to 1980 average. Monthly values reach back to 1880, and the tables are updated every month.
Averaged over the whole globe, 2023 was 1.17 °C above the 1951 to 1980 average, 2024 was 1.29 °C above and 2025 was 1.19 °C above. The space agency describes 2025 as tied with 2023 within the margin of error, with 2024 still the hottest year on record. In 2025 the northern hemisphere was 1.49 °C above and the southern hemisphere 0.89 °C above; the band from 64 degrees north to the pole was 2.99 °C above.
Each square is 2 by 2 degrees and shows the average of its twelve monthly anomalies for 2025. Shades of orange and red are warmer than the 1951 to 1980 average, light blue is cooler, and grey squares have no value. Almost every square is warmer, and the strongest warming is in the far north.
Values are smoothed over a radius of 1200 kilometres, so places with few stations borrow from distant ones, and the ocean part rests on sea-surface temperature analyses. A few squares have no value. Against a different baseline period, such as the pre-industrial period, the numbers change.
Map: Fix Planet, from the surface temperature analysis of the Goddard Institute for Space Studies of the National Aeronautics and Space Administration (monthly 2 by 2 degree grid, 1200 kilometre smoothing), as distributed by the Physical Sciences Laboratory of the National Oceanic and Atmospheric Administration. The agency's data are released under Creative Commons Zero; citation is requested. Boundaries: Natural Earth, public domain.
Open source map → Total rain and snow that fell on land in 2024, in millimetres, from rain-gauge stations on a 0.5 degree grid.
Read the card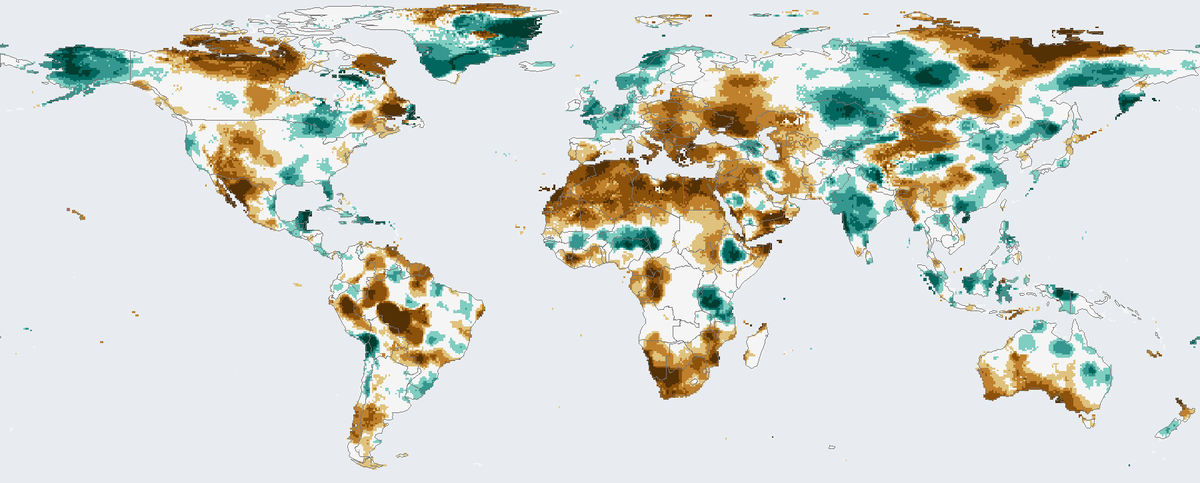
How much drier or wetter than usual the twelve months to December 2024 were on land, counting rainfall and evaporation.
Read the card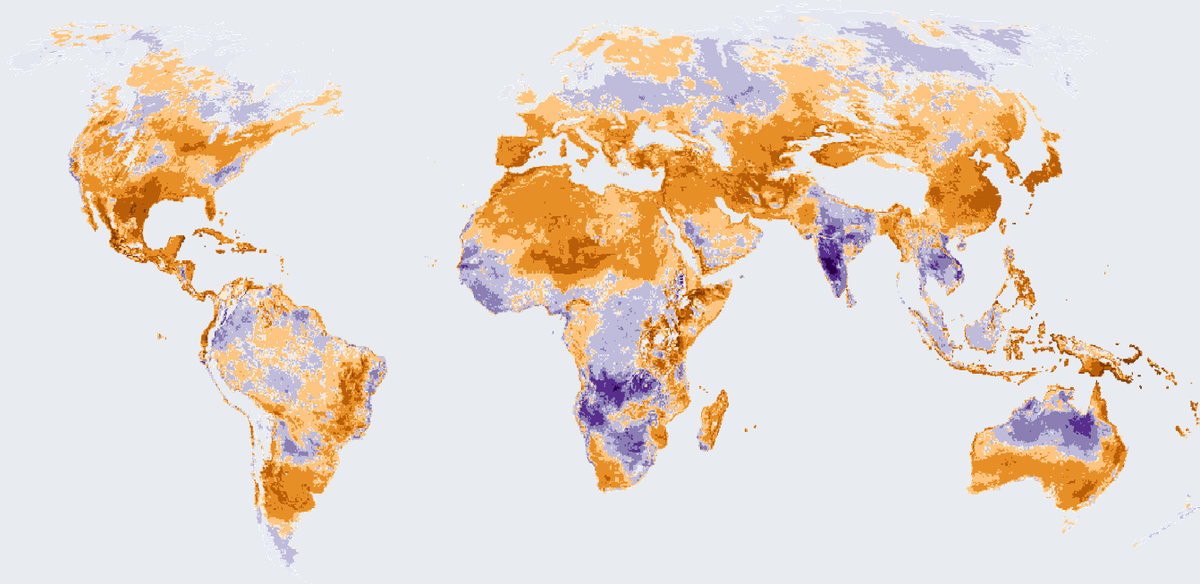
How many more or fewer days than usual brought strong heat stress outdoors in 2025, on land worldwide except Antarctica.
Read the card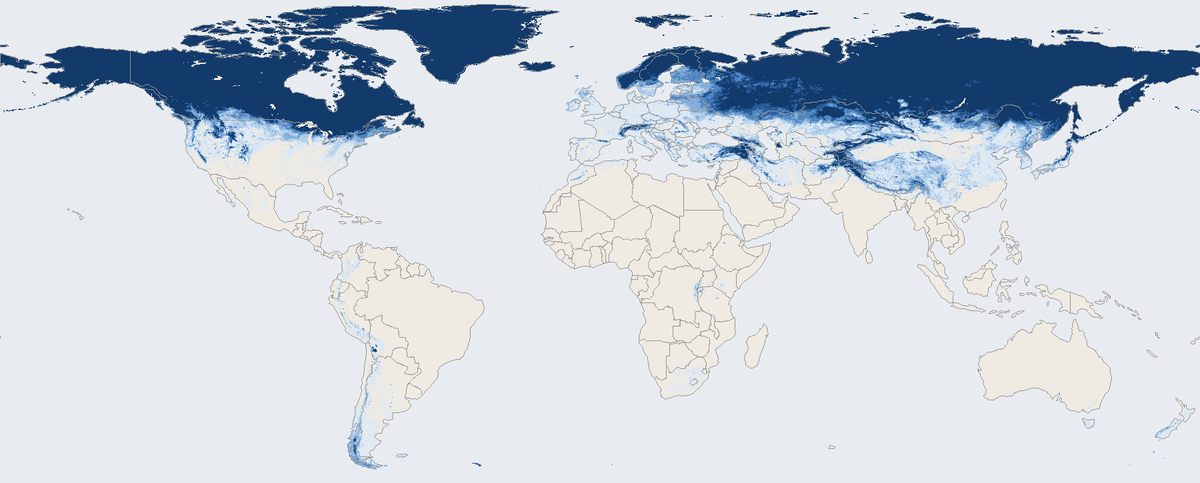
Share of days with snow on the ground across the world's land in March 2026, seen by a satellite instrument.
Read the card