Forests

Trend and futures

Long view, then the years we can measure

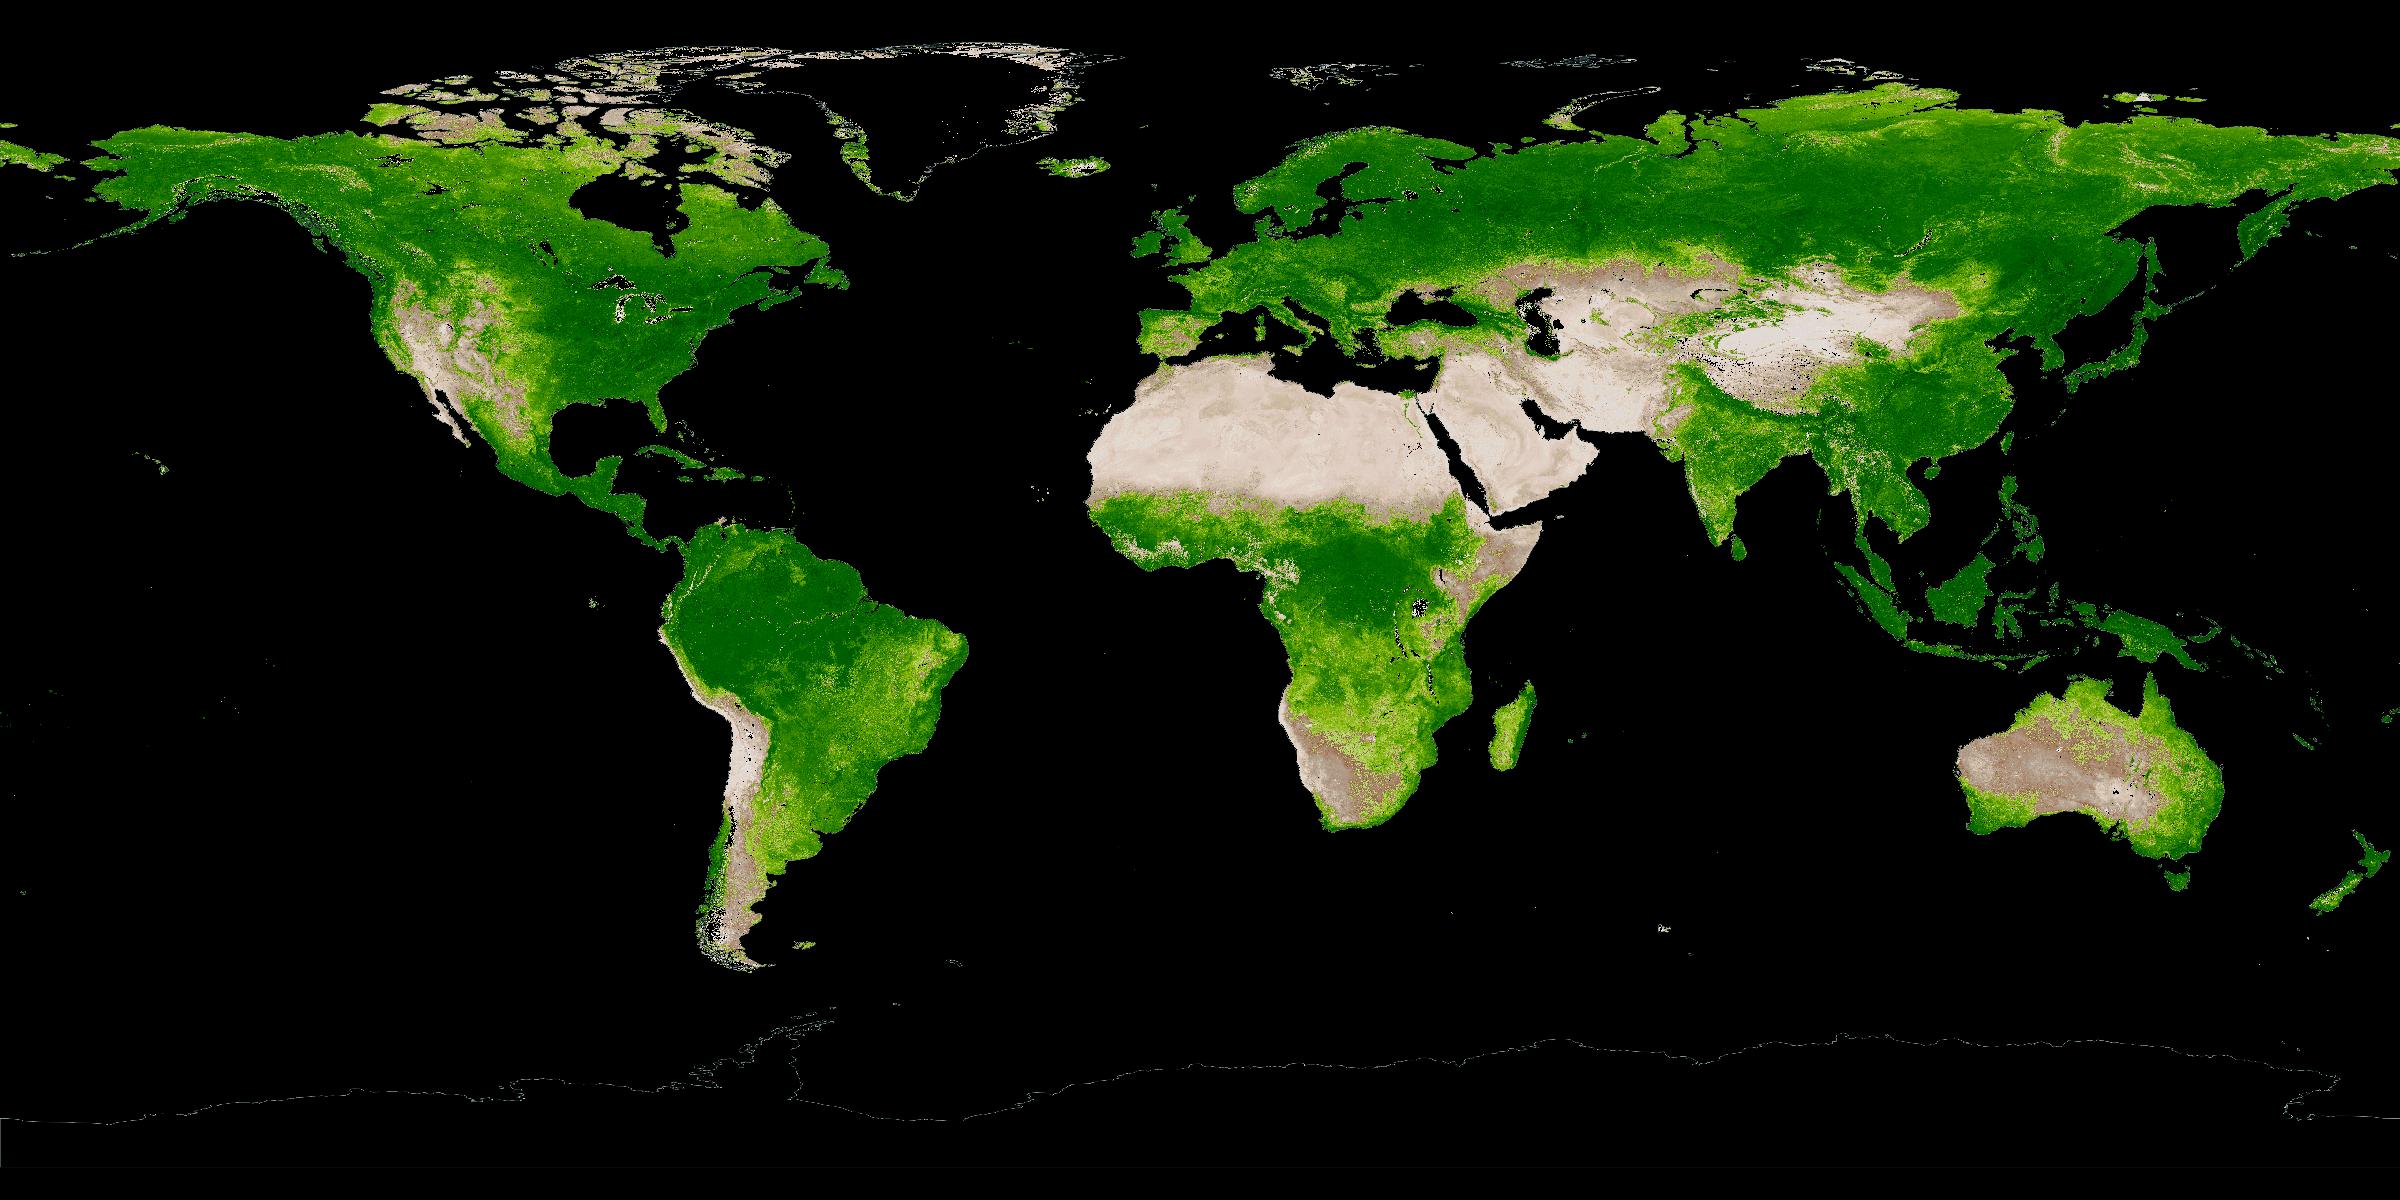
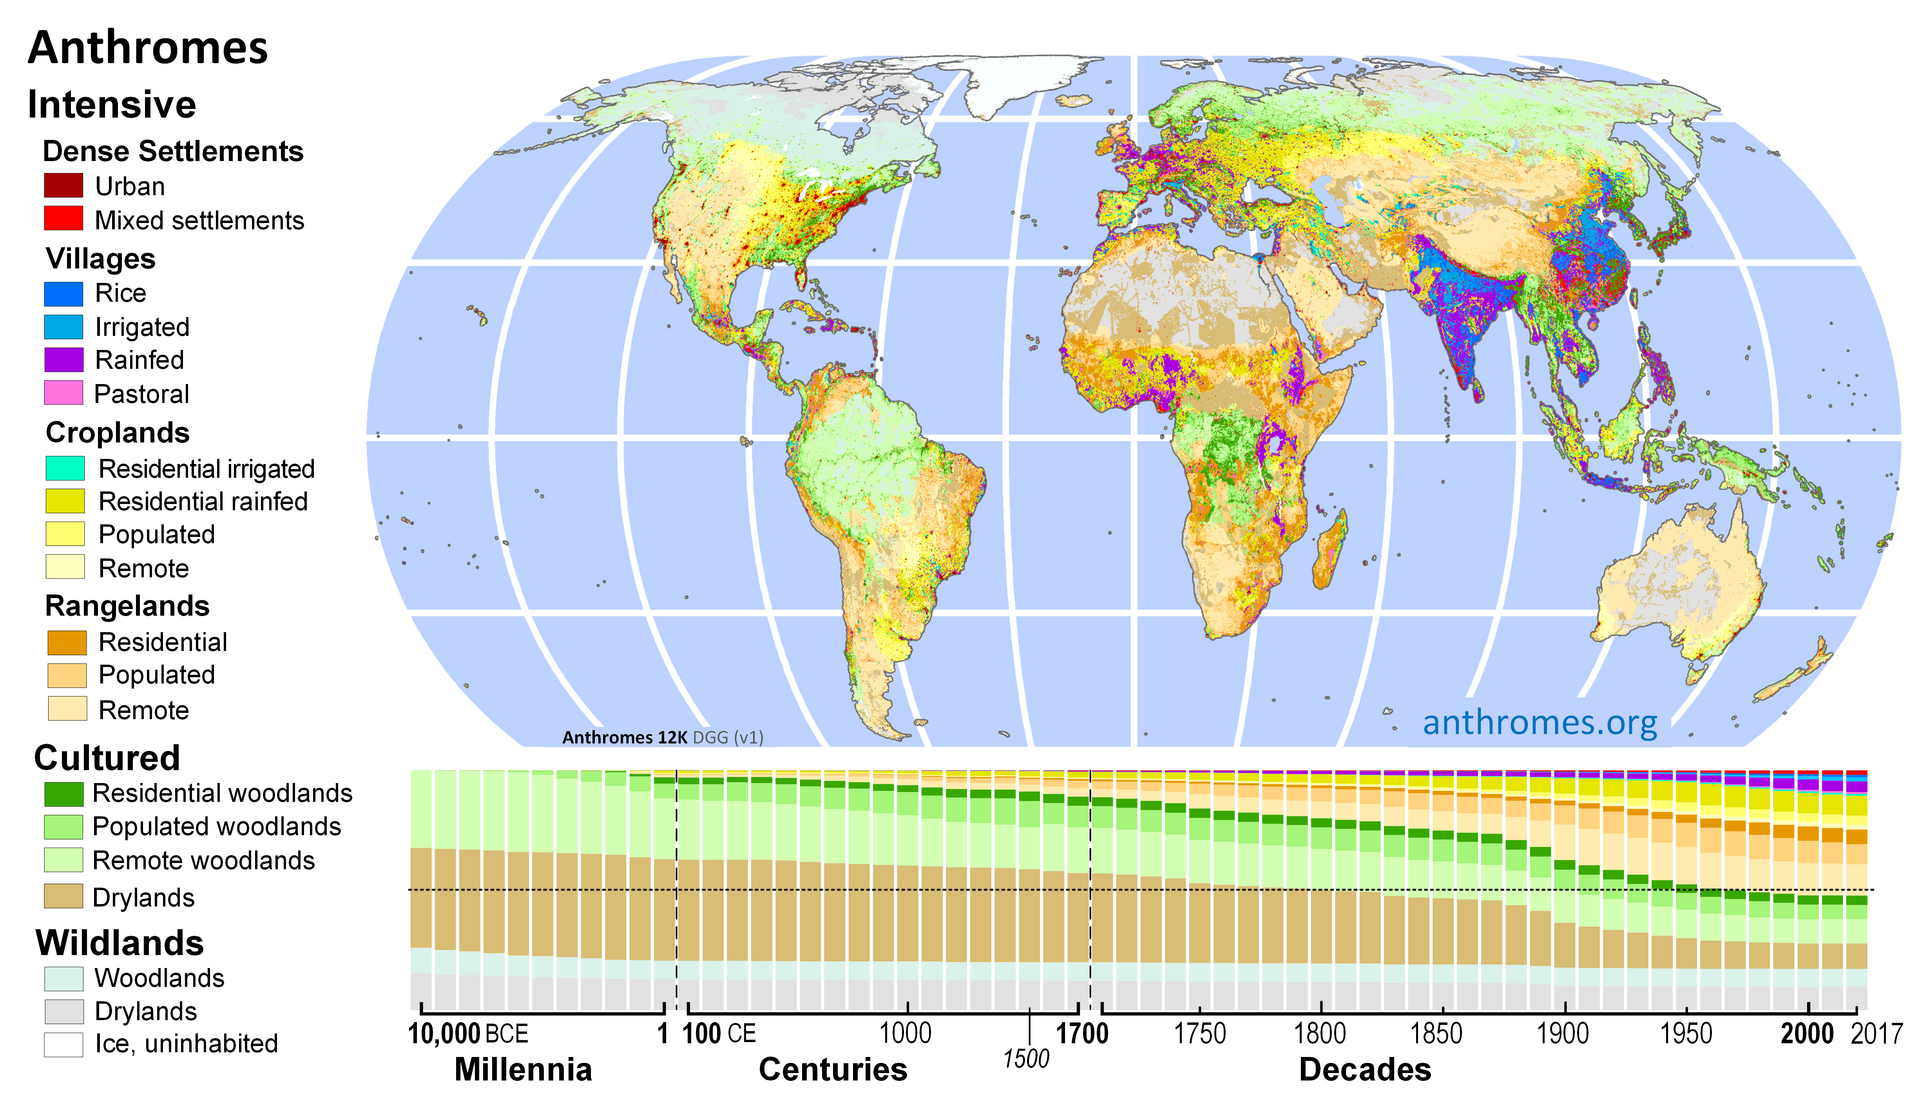
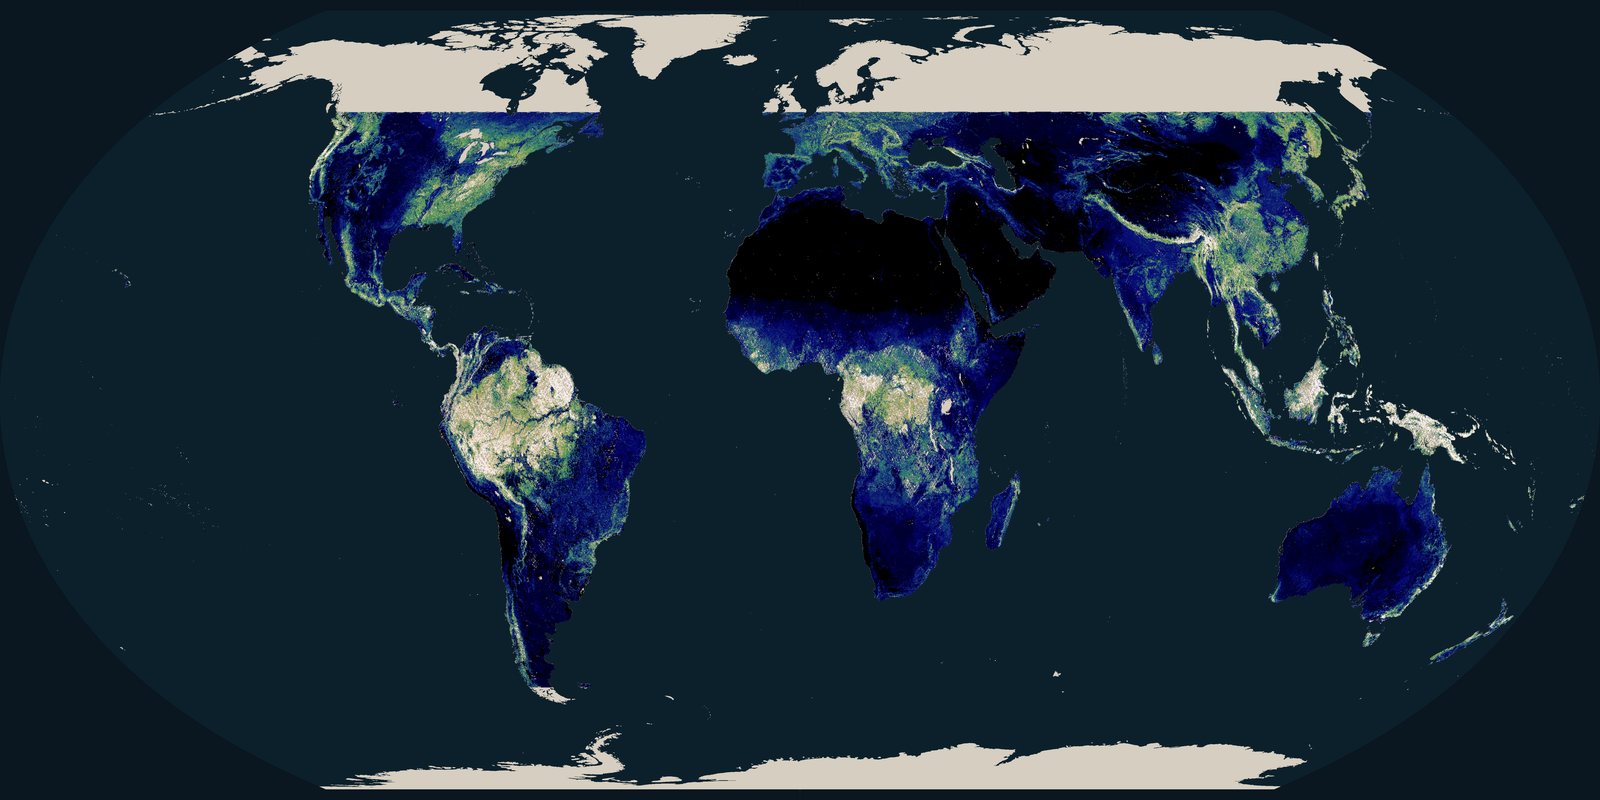
The Ellis 12K chart reconstructs anthromes: wild, cultured, and intensive land: from 10,000 BCE to 2017. It is not FAO hectares. After 2000 the satellite figures are tighter.

World anthrome map for 2017 above a stacked timeline of wild, cultured, and intensive land from 10,000 BCE to 2017
Erle Ellis, Anthromes 12K DGG v1, after Ellis et al. 2021, PNAS. CC BY 2.0. Map face is ~2017; the stacked strip is the long reconstruction. Wild woodland shrinks; cropland, rangeland, and settlements grow. Coarse on purpose.

Wild woodland has shrunk over the Holocene as cropland, pasture, and settlements grew. After 2000 the satellite record is tighter. Tropical primary conversion is not the same as boreal fire, and neither is a calendar date when “the forests end.”

Paths, not fate

If the recent rate of tropical primary loss continues, that forest keeps shrinking. A quieter fire year or a real moratorium can bend the line the other way: 2025 already did, once. Neither path is a date when forest disappears.

If the recent tropical-primary band holds

UMD/GFW humid-tropical primary loss was 6.7 million ha in 2024 (a fire-heavy record) and 4.3 million ha in 2025 (36 percent lower, still about 46 percent above a decade earlier). If a 4-7 million ha/year band persists, remaining primary humid tropics keep shrinking. Remaining primary area is not a single published GFW stock on this page; boreal FAO forest is a different ledger.
If policy and fire management hold

FRA 2025 already shows slower net loss than the 1990s (4.12 vs 10.7 million ha/year). Brazil’s 2025 share of the tropical-primary drop is the usual reminder that enforcement and commodity rules can move a global total in one year. The same WRI note says fire is a new normal: a lull is not a lock.

If restoration is real forest, not a pledge

FAO forest expansion (6.78 million ha/year, 2015-2025) already offsets part of deforestation. Plantations and young secondary stands can grow that number without restoring primary structure or species. A better path is less conversion plus restoration that is measured as ecosystem, not as a press-release hectare.

What has moved the line

Loss is not only weather. Commodity rules, fire enforcement, tenure, and parks have shifted the totals in named years.

Amazon soy moratorium

After 2006, soy-linked clearing in the Brazilian Amazon fell sharply in the peer-reviewed record (Gibbs et al. 2015, Science). Leakage into the Cerrado is the honest caveat. Rules on who buys the crop changed the frontier. They can be undone.

Indonesia forest and peat rules

Primary-forest and peat moratoria, plus fire enforcement after 2015, show up in GFW year notes as years when Indonesia’s loss cooled. El Niño and plantation demand can heat it again. Policy is a switch, not a vaccine.

Indigenous and local territories

Across several tropical basins, titled Indigenous lands often show lower conversion than nearby undesignated forest in GFW/WRI compilations. That is governance and presence, not a romantic “untouched” myth. Tenure still needs defending.

Protected forest (FAO)

FRA 2025: about 813 million ha of forest: 20 percent: sits in legally established protected areas (+251 million ha since 1990). Paper parks exist. So do parks that hold. Protection is one tool next to commodity rules and fire crews.

The Maps room also keeps a Hansen / Global Forest Watch schematic of well-known loss frontiers. Open the forest-cover-loss card →