


Crime
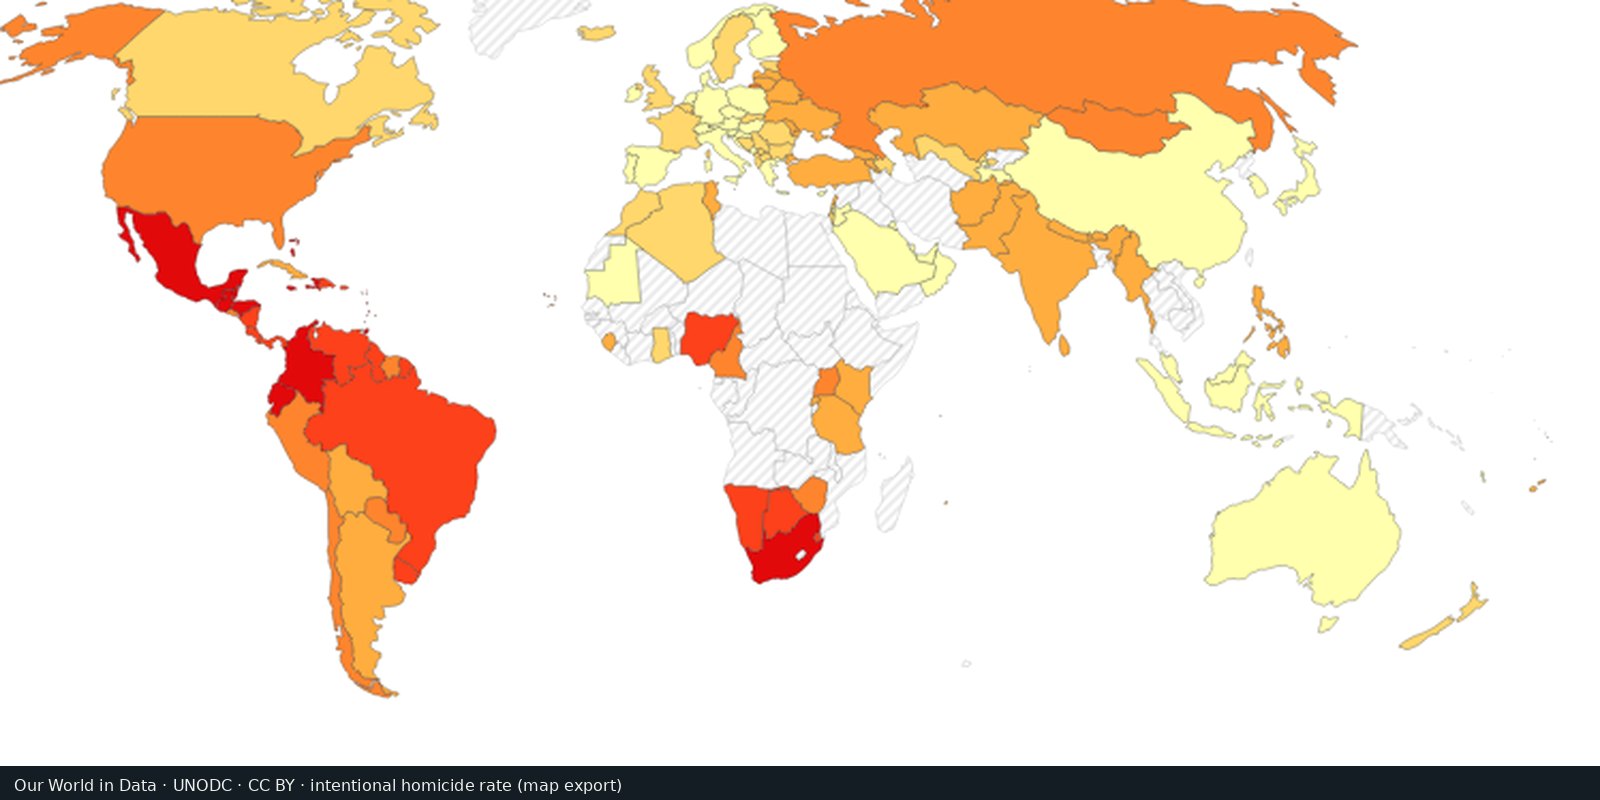
Intentional homicide rates
Comparable rates of intentional homicide from the UN Office on Drugs and Crime, one measure of violent crime.
Read the card →How many people each country holds in prison for every 100,000 residents, counting pre-trial detainees, from the World Prison Brief database.
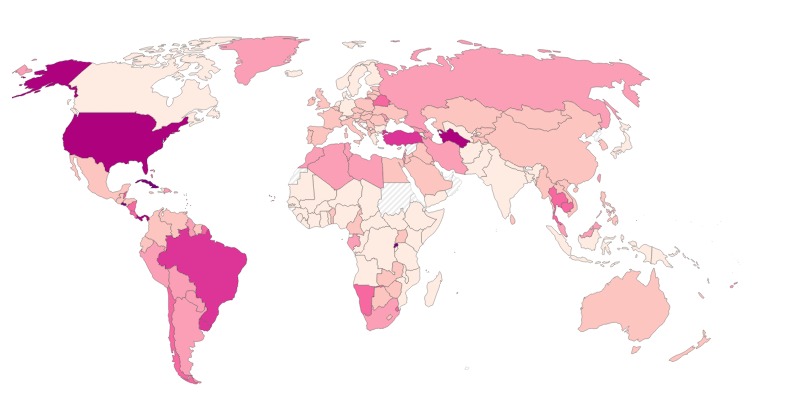
Prisoners per 100,000 people
Prisoners per 100,000 people by country in 2026 or the latest year available, including pre-trial detainees.
Chart: Our World in Data, CC BY 4.0. Data: Institute for Crime & Justice Policy Research, World Prison Brief (2026); population from various sources (2024), with minor processing by Our World in Data. The map was cropped from the Our World in Data chart.
The World Prison Brief is a free online database of prison systems around the world, hosted by the Institute for Crime & Justice Policy Research (ICPR) at Birkbeck, University of London. It ranks countries by prison population rate: everyone held in prison, including pre-trial detainees and remand prisoners, per 100,000 people. Our World in Data, a non-profit statistics website, shows the same series on a world map (data from 1993 to 2026).
The rate shows how heavily a country relies on imprisonment. In the list of 224 prison systems, El Salvador has the highest rate at 1,659 per 100,000 people, followed by Cuba (794), Turkmenistan (about 576) and the United States (542).
Figures come mainly from governments and other official sources, and country pages are updated monthly, so the latest year differs from country to country. The rate reflects sentencing laws, the use of pre-trial detention and the capacity of courts as well as crime levels. On the map, darker shades mean more prisoners per 100,000 people; where a 2026 figure is missing, the closest year between 2018 and 2025 is shown.
The World Prison Brief publishes the shares of pre-trial detainees, women and foreign nationals among prisoners, and prison occupancy, as separate lists; the map shows the overall rate only. Countries define who counts as a prisoner in different ways.
Chart: Our World in Data, CC BY 4.0. Data: Institute for Crime & Justice Policy Research, World Prison Brief (2026); population from various sources (2024), with minor processing by Our World in Data. The map was cropped from the Our World in Data chart.
Open source map → Comparable rates of intentional homicide from the UN Office on Drugs and Crime, one measure of violent crime.
Read the card →
Country scores for criminal markets, criminal actors, and resilience: an expert-assessment heatmap of organized crime.
Read the card →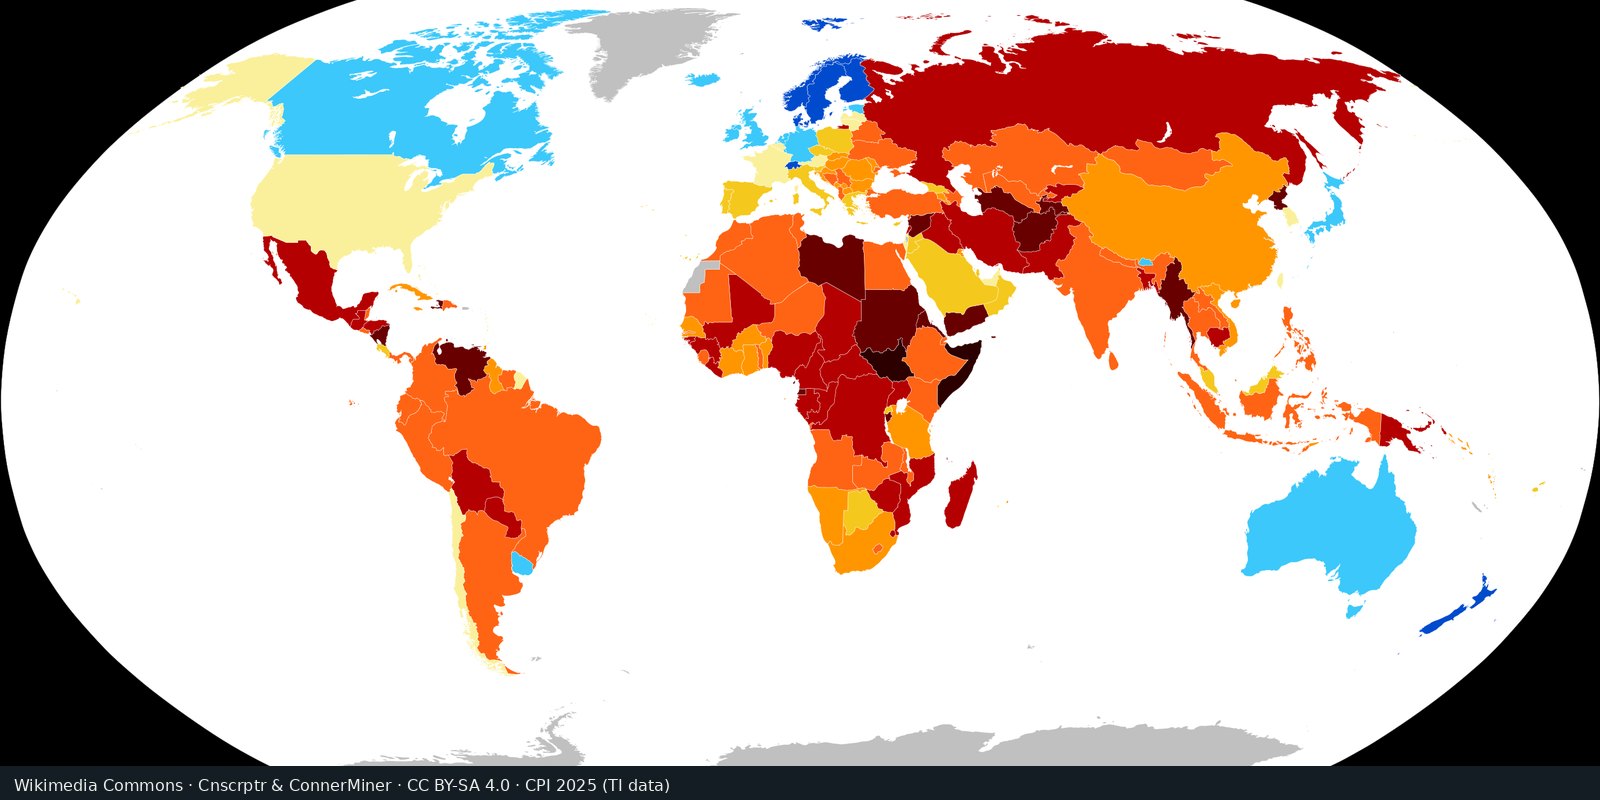
Perceived public-sector corruption on a scale from 0 to 100, from expert and business surveys: a measure of governance risk.
Read the card →
Detected victims of trafficking in persons, and the patterns in the UN Office on Drugs and Crime Global Report on Trafficking in Persons: exploitation and coercion.
Read the card →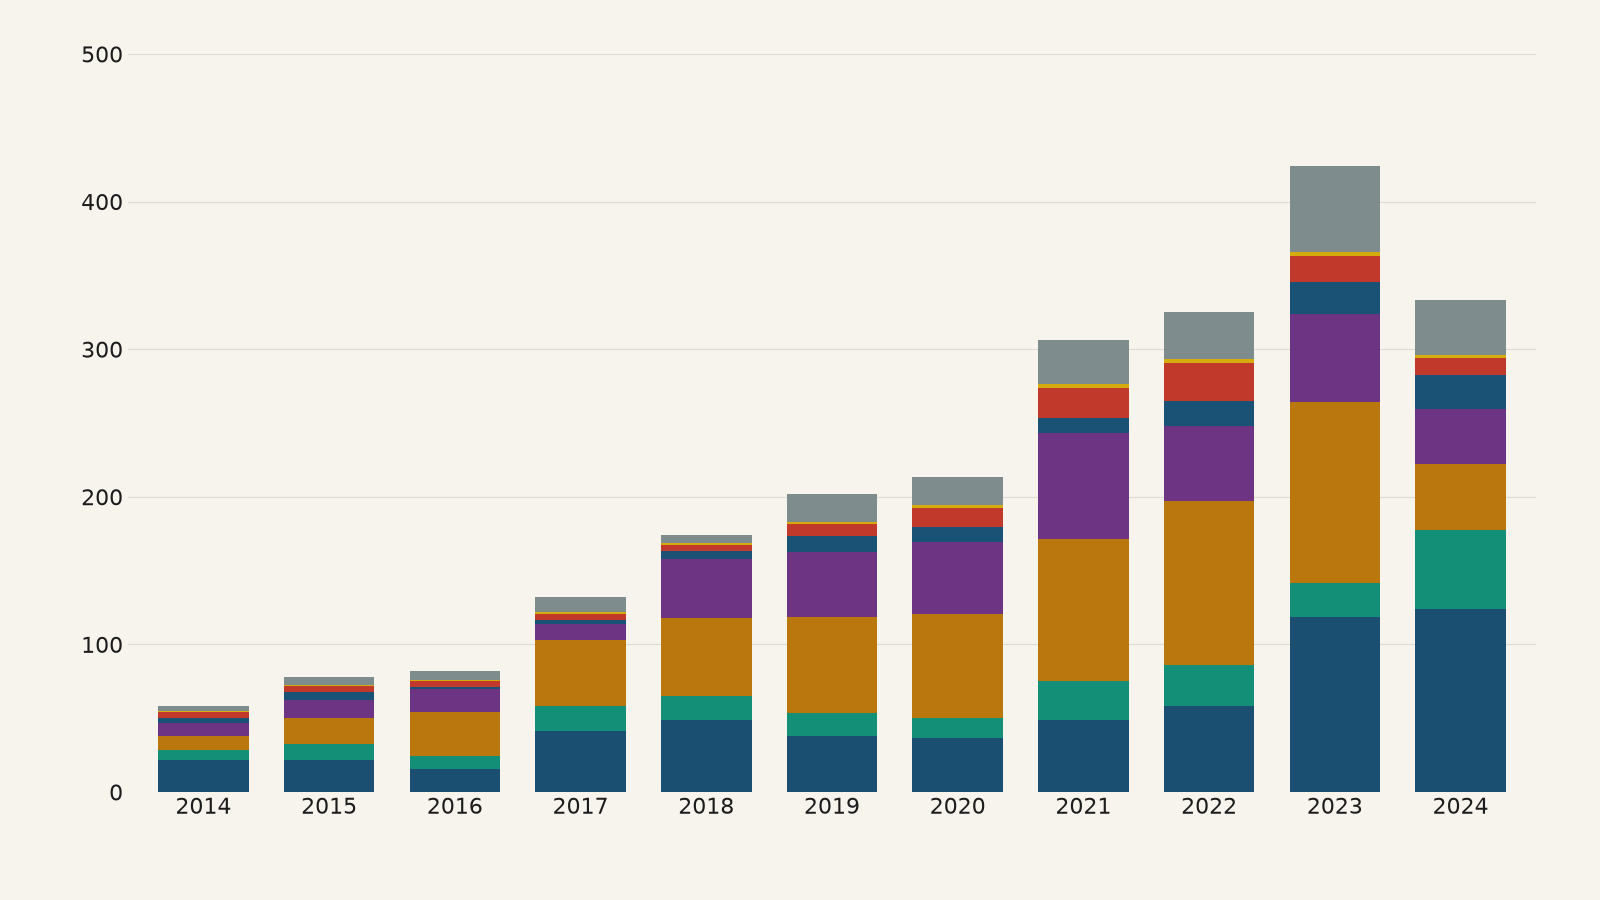
The main routes of cocaine, heroin and methamphetamine trafficking between world regions, mapped by the UN Office on Drugs and Crime from drug seizures reported for 2021 to 2024.
Read the card →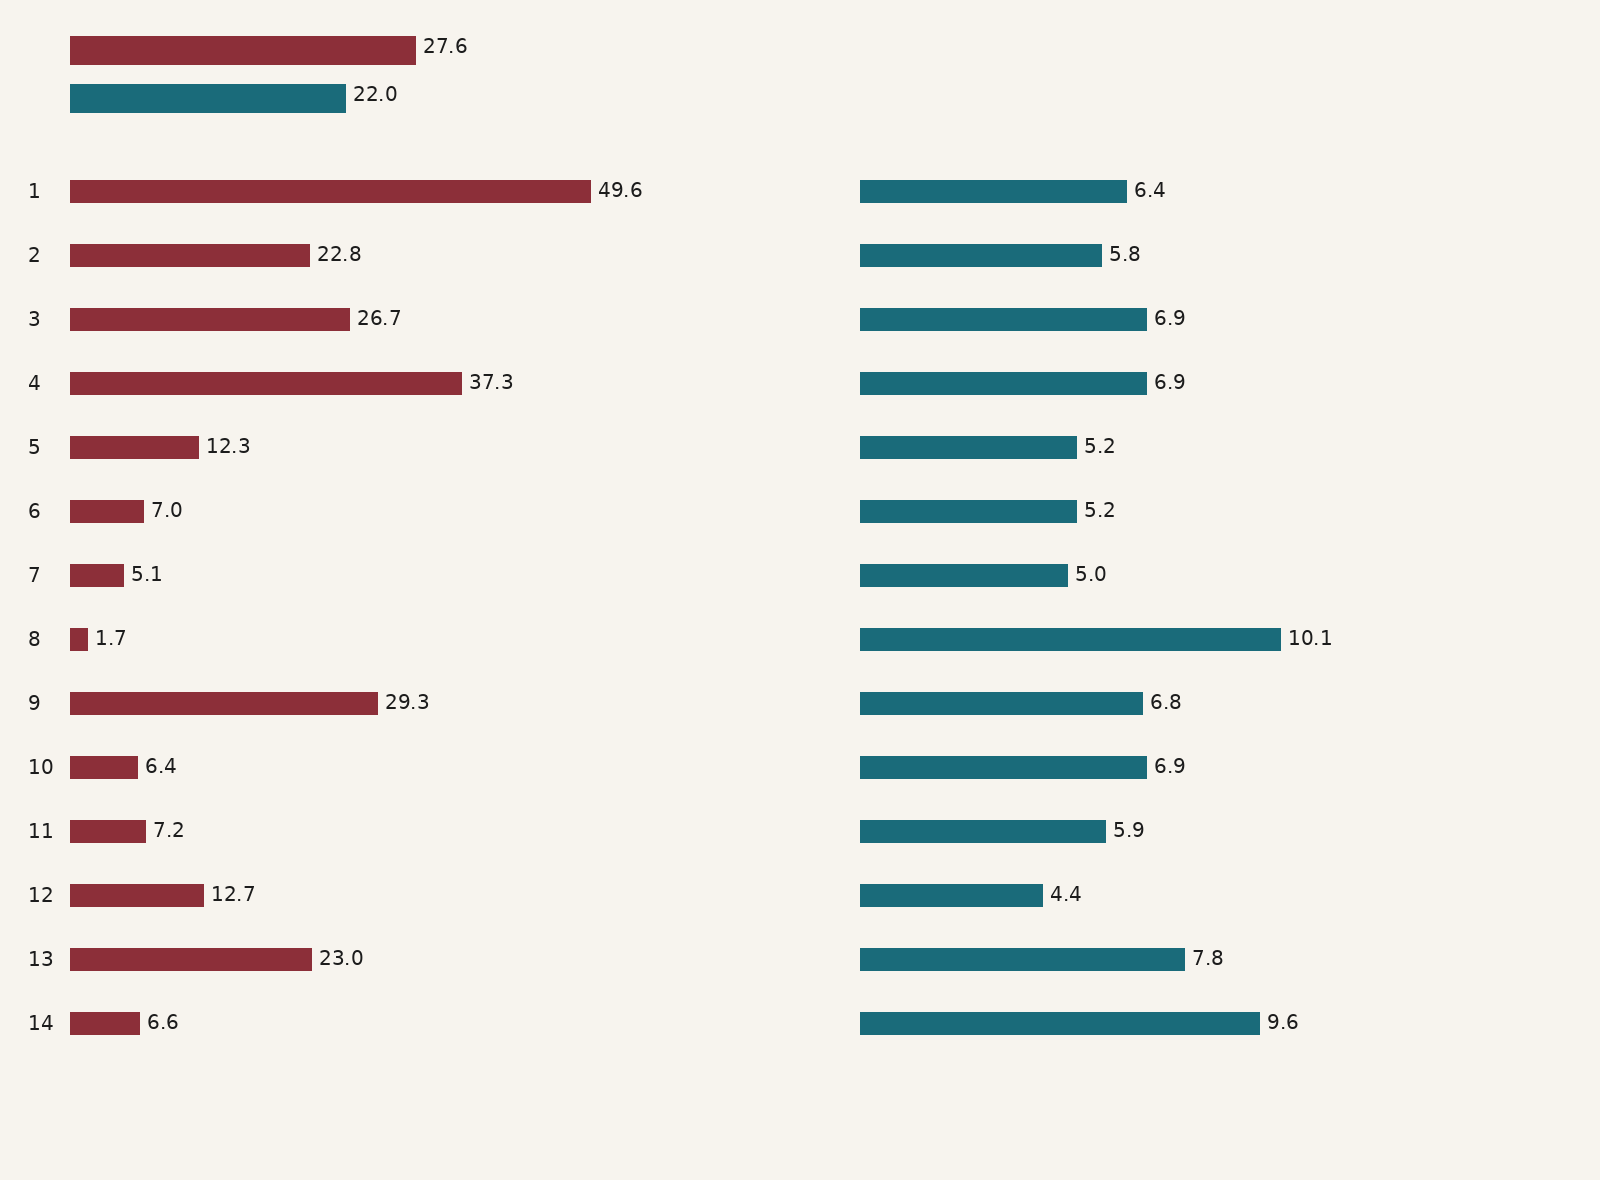
Estimated prevalence of modern slavery, meaning forced labour and forced marriage, in 160 countries, from Walk Free's Global Slavery Index, built on global estimates of about 50 million people in modern slavery in 2021.
Read the card →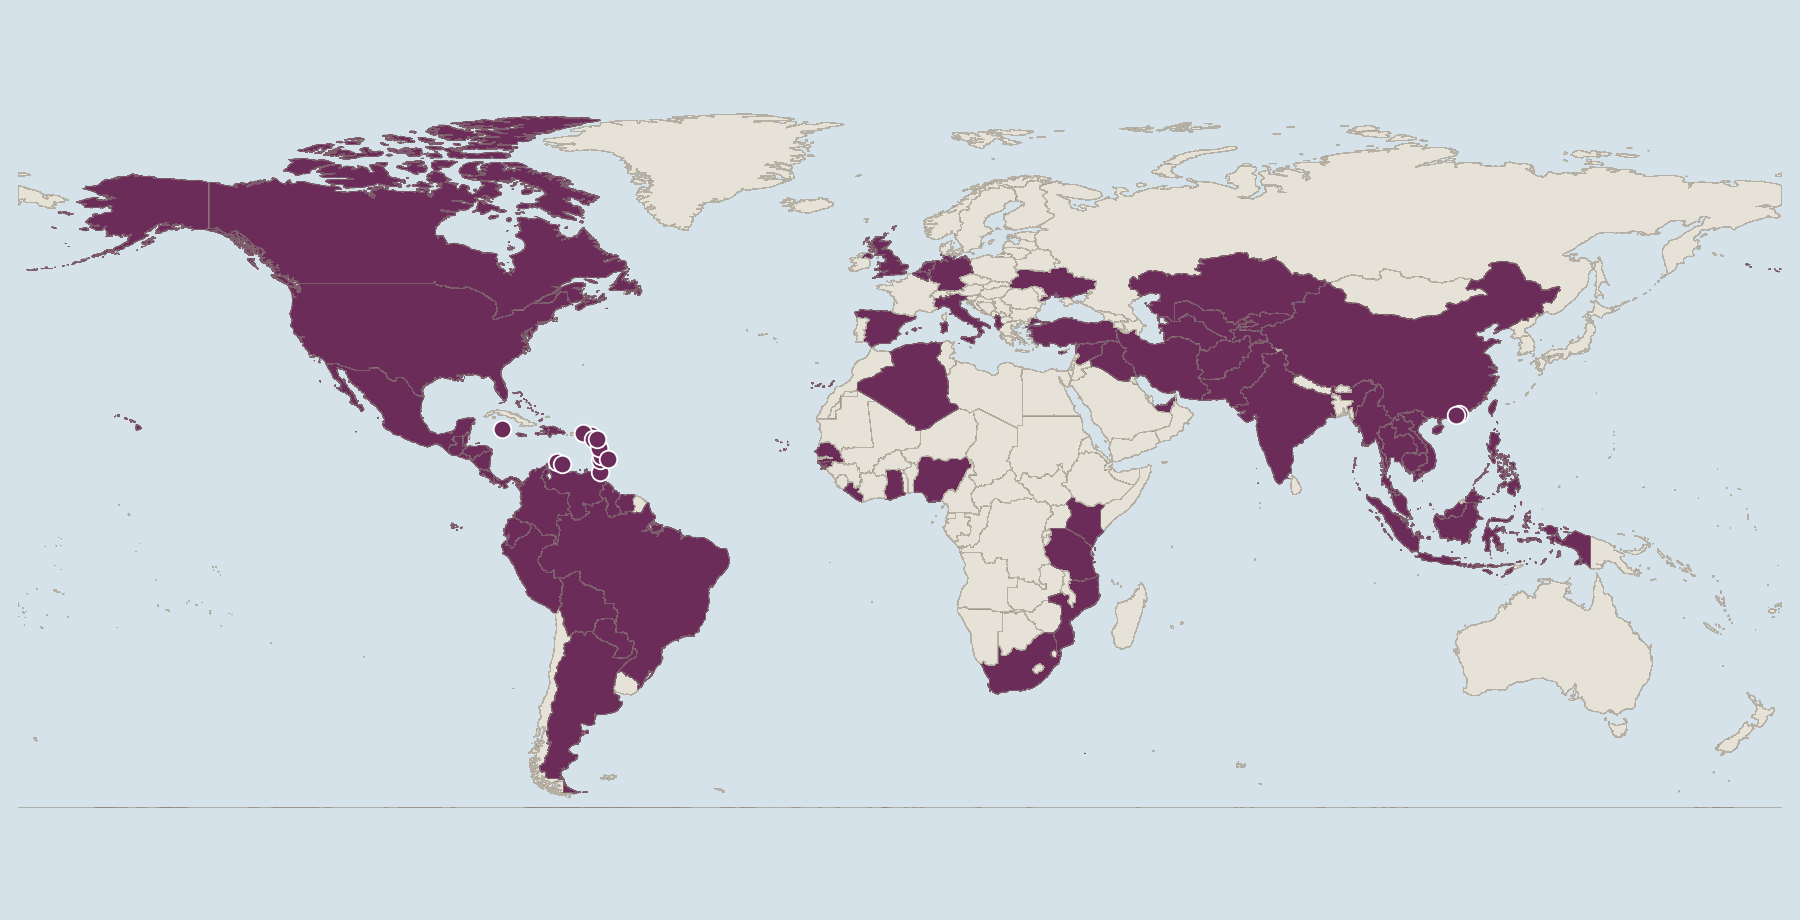
Risk scores from 0 to 10 for how exposed each country is to money laundering and related financial crime, and how well it can counter them, from the Basel Institute on Governance.
Read the card →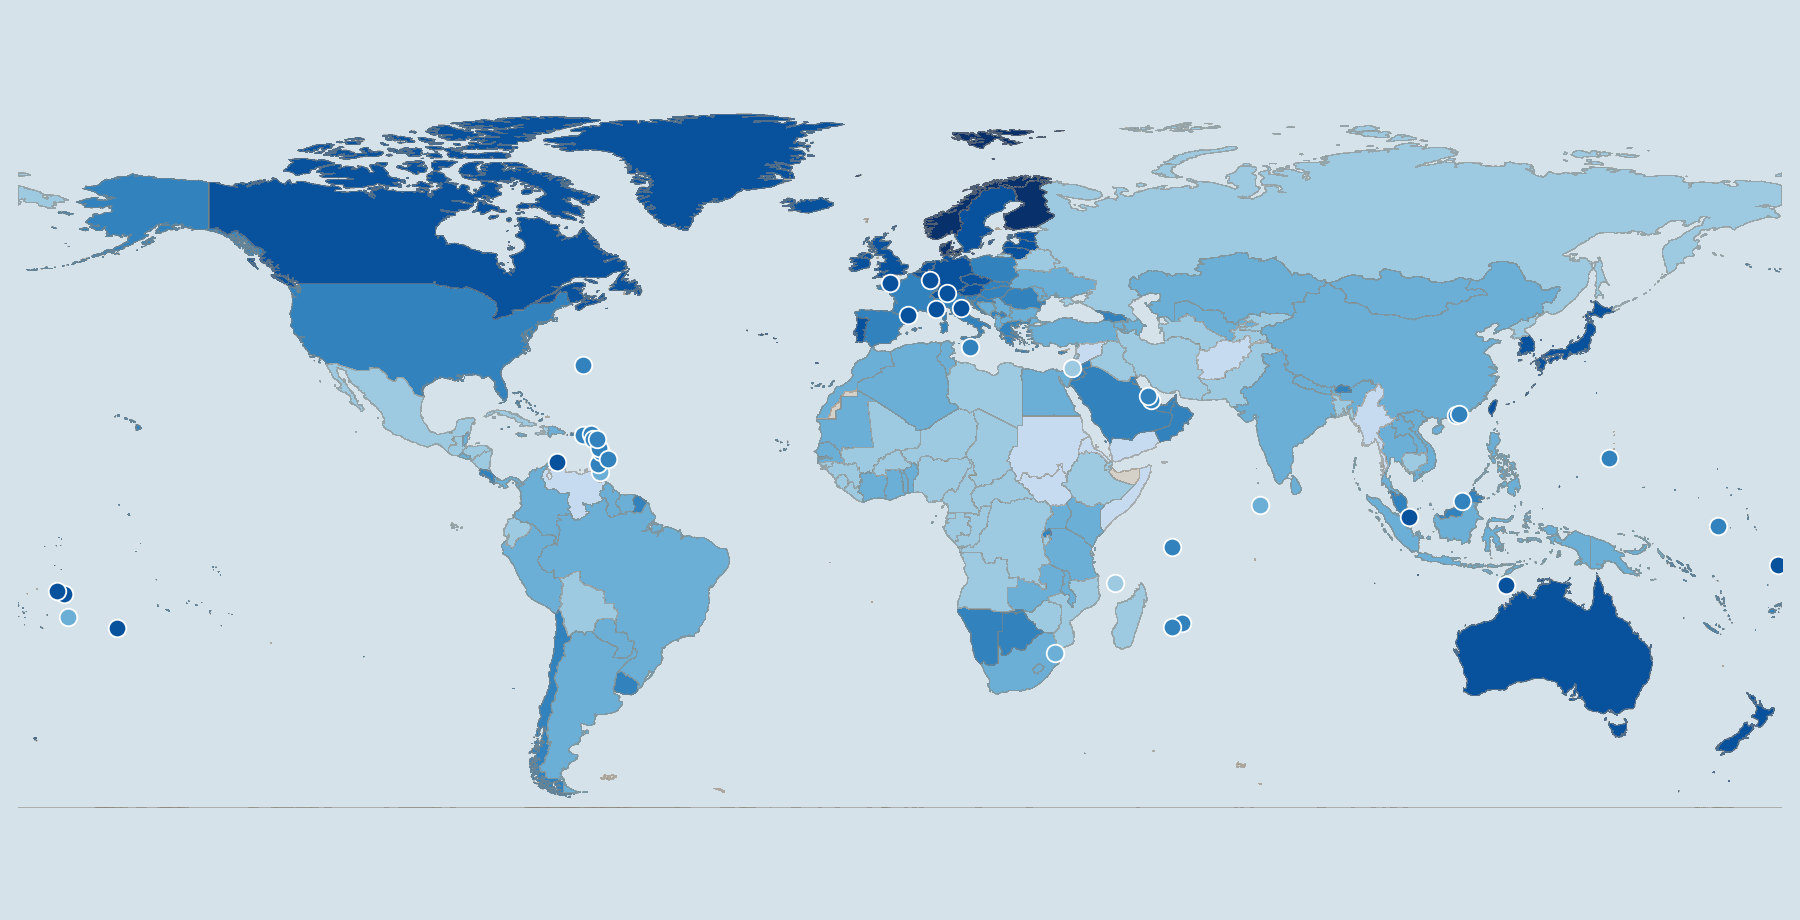
How people and legal experts in 143 countries experience limits on government power, corruption, open government, fundamental rights, order and security, regulation, and civil and criminal justice, scored from 0 to 1 by the World Justice Project.
Read the card →