

Crime
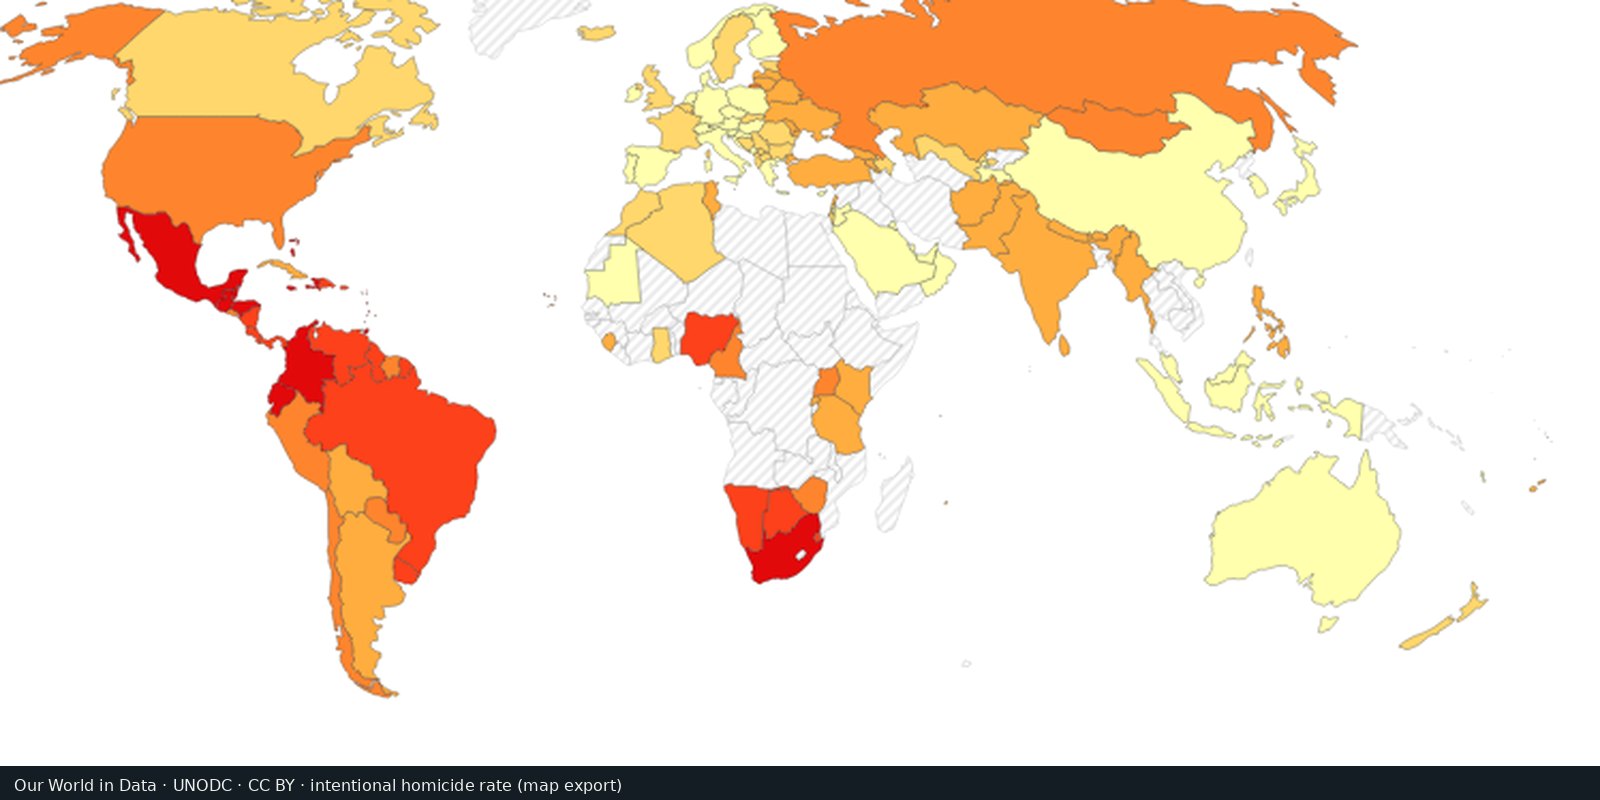
Intentional homicide rates
Comparable rates of intentional homicide from the UN Office on Drugs and Crime, one measure of violent crime.
Read the card →Estimated prevalence of modern slavery, meaning forced labour and forced marriage, in 160 countries, from Walk Free's Global Slavery Index, built on global estimates of about 50 million people in modern slavery in 2021.
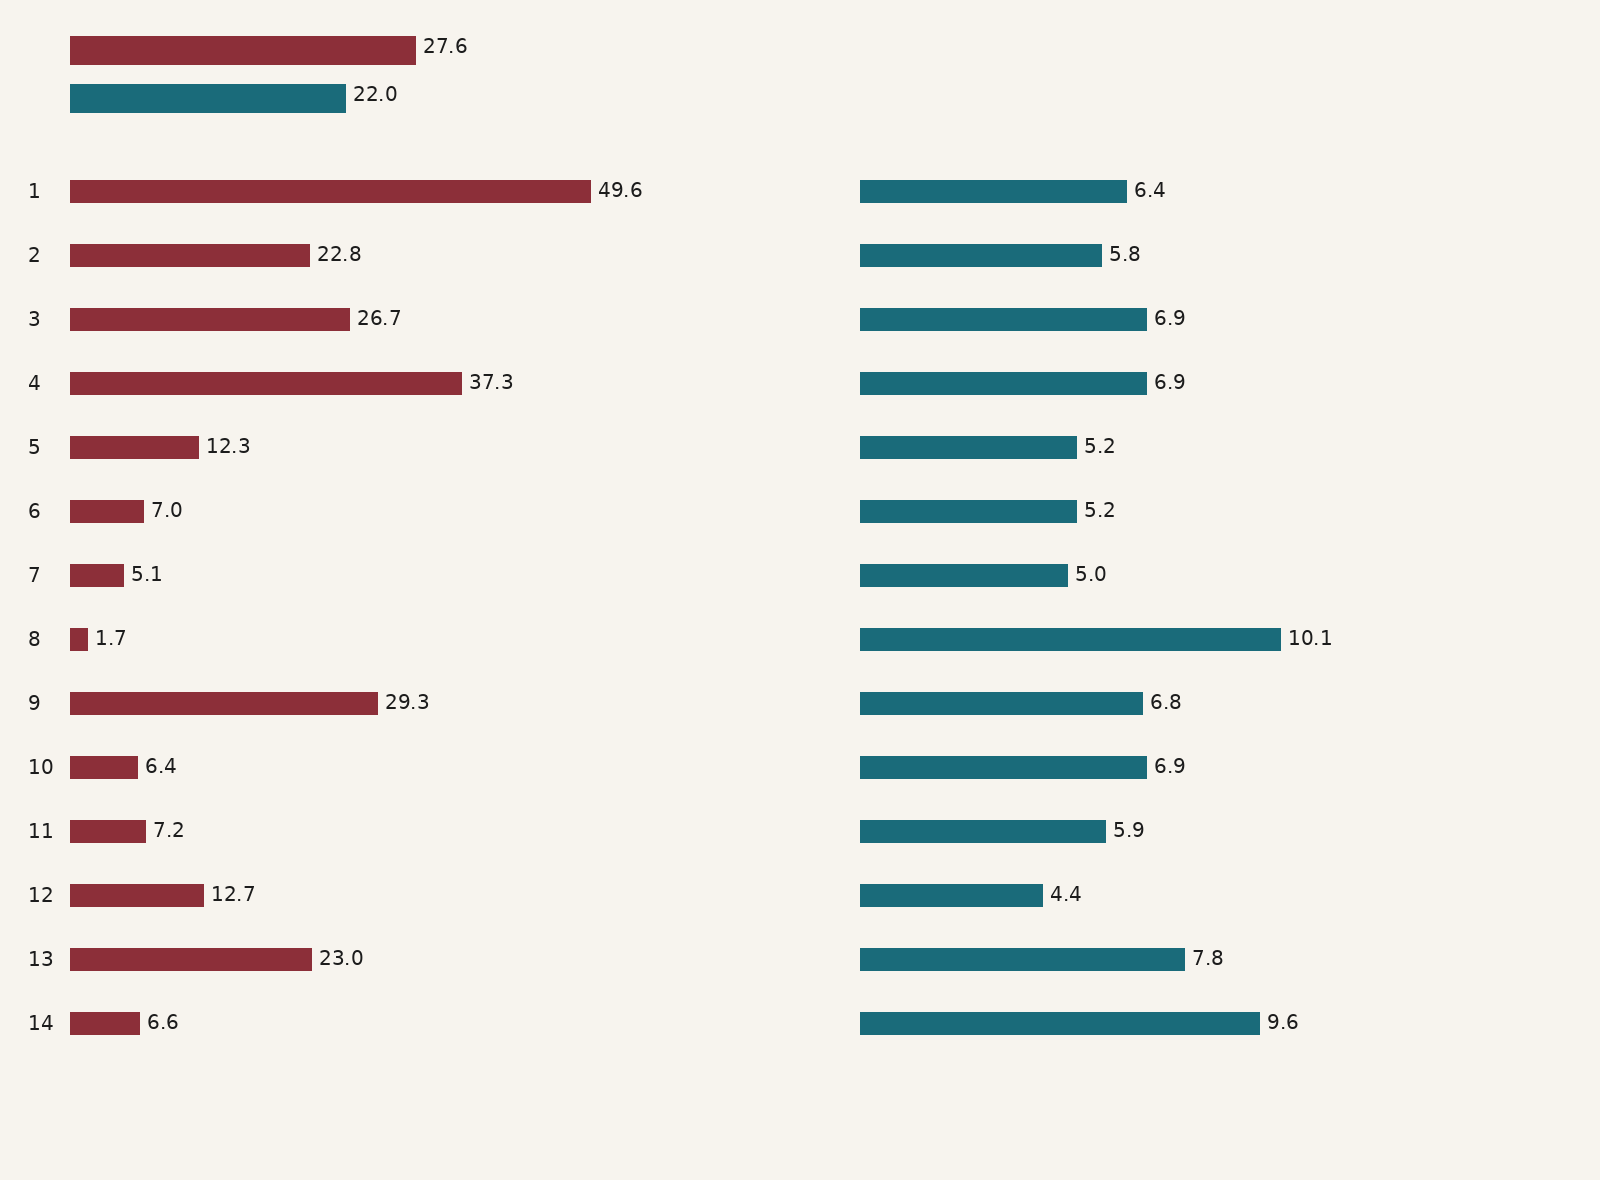
Forced labour and forced marriage, millions of people
Number of people, millions (left bars, same row numbers)
Prevalence per 1,000 population (right bars)
People in modern slavery in 2021, in millions and per 1,000 population, by sex, age, region and income group.
Chart: Figure 1 of Global Estimates of Modern Slavery: Forced Labour and Forced Marriage (2022), © ILO, Walk Free and IOM, CC BY 4.0. This is an adaptation of an original work by the ILO, Walk Free and IOM. Responsibility for the views and opinions expressed in the adaptation rests solely with the author or authors of the adaptation and are not endorsed by the ILO, Walk Free or IOM.
Walk Free, an international human rights group, publishes the Global Slavery Index. Its 2023 edition estimates how many people live in modern slavery in 160 countries, using nationally representative household surveys and a statistical model of each country’s vulnerability. It builds on the Global Estimates of Modern Slavery by the International Labour Organization (ILO), Walk Free and the International Organization for Migration (IOM): about 50 million people (49.6 million) were in modern slavery on any given day in 2021, about 28 million in forced labour and 22 million in forced marriage, about 10 million more than in the 2016 estimates.
The estimates include people who never appear in police or court records. The Index finds the highest prevalence in North Korea (104.6 per 1,000 people), Eritrea (90.3) and Mauritania (32.0), and the strongest government responses in the United Kingdom, Australia and the Netherlands. By region, the global estimates show the highest prevalence in the Arab States (10.1 per 1,000 people) and the largest number of people in Asia and the Pacific (29.3 million).
Country figures are estimated prevalence per 1,000 people, based on surveys and modelling, so each figure carries a margin of uncertainty. Walk Free's interactive map shows each country's estimated prevalence, vulnerability and government response. The preview chart shows the global estimates by sex, age, region and income group, in millions of people and per 1,000 population.
The global estimates leave out some forms of exploitation, such as organ trafficking and the recruitment of children by armed forces, and surveys are difficult and dangerous in countries in deep, ongoing conflict. Walk Free describes its estimate as conservative.
Chart: Figure 1 of Global Estimates of Modern Slavery: Forced Labour and Forced Marriage (2022), © ILO, Walk Free and IOM, CC BY 4.0. This is an adaptation of an original work by the ILO, Walk Free and IOM. Responsibility for the views and opinions expressed in the adaptation rests solely with the author or authors of the adaptation and are not endorsed by the ILO, Walk Free or IOM.
Open source map → Comparable rates of intentional homicide from the UN Office on Drugs and Crime, one measure of violent crime.
Read the card →
Country scores for criminal markets, criminal actors, and resilience: an expert-assessment heatmap of organized crime.
Read the card →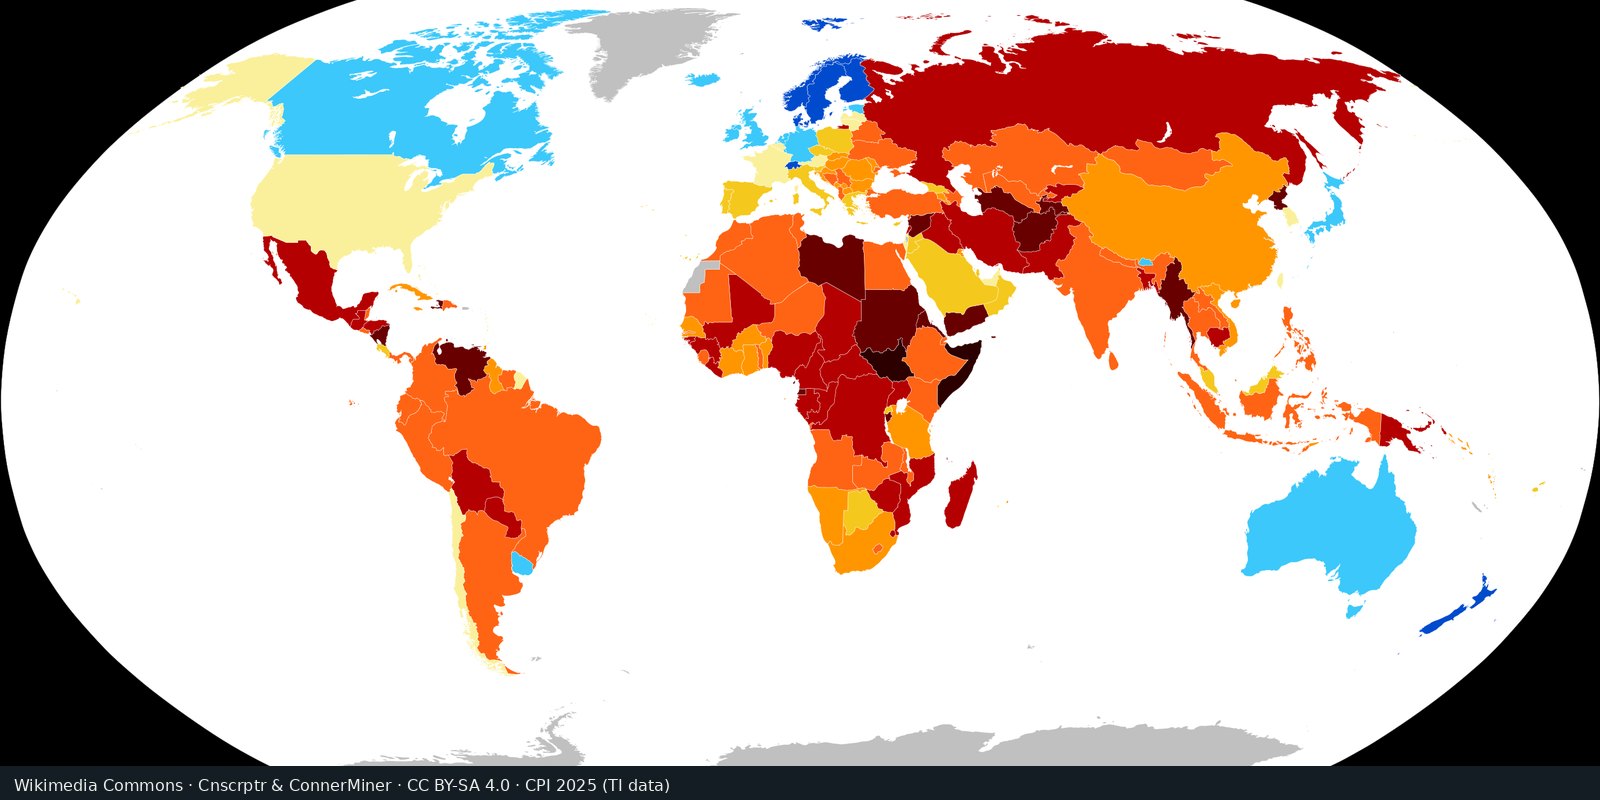
Perceived public-sector corruption on a scale from 0 to 100, from expert and business surveys: a measure of governance risk.
Read the card →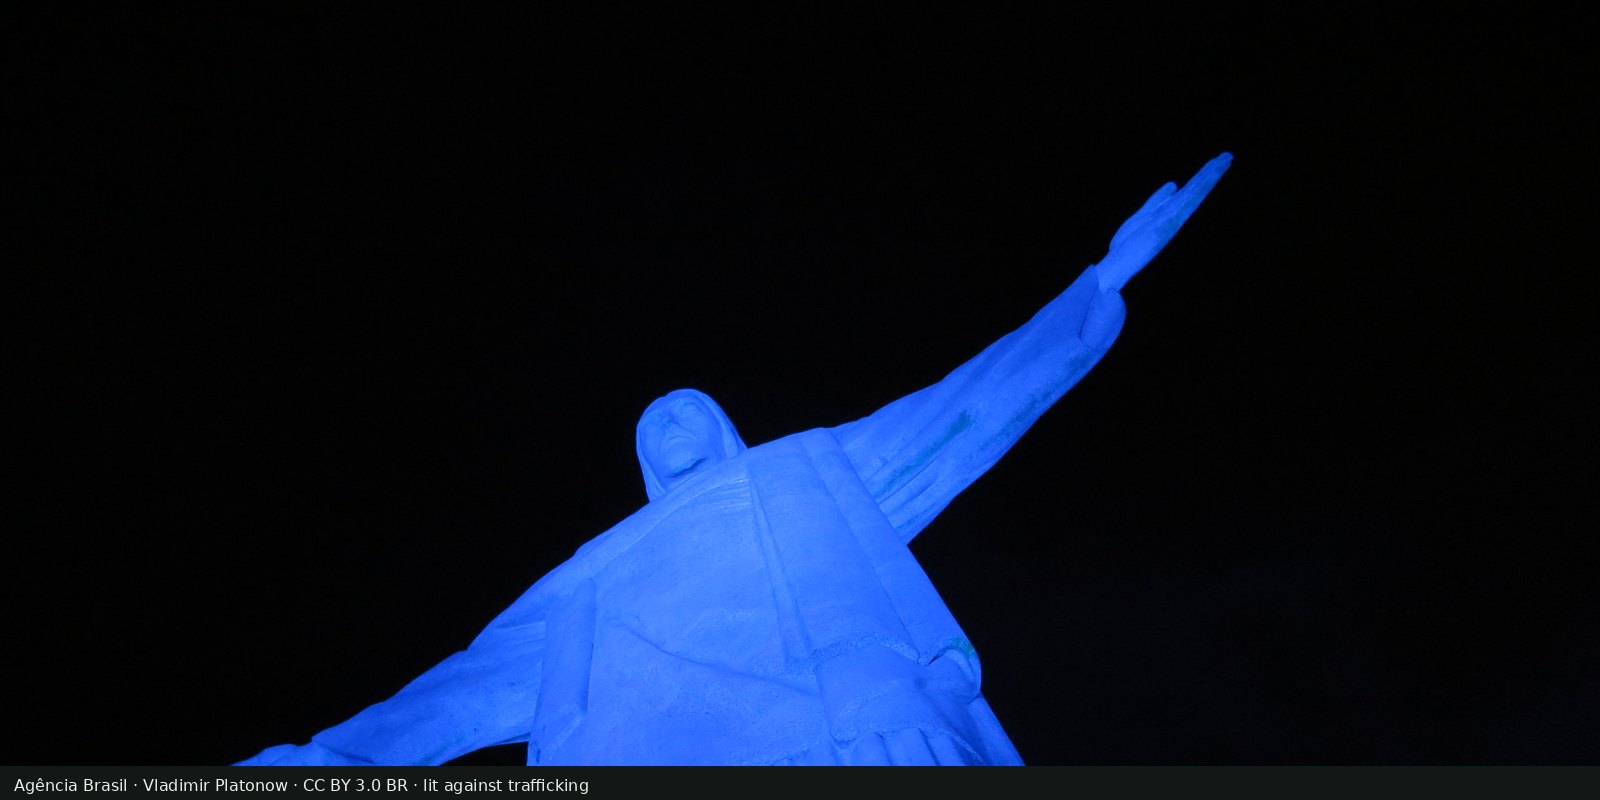
Detected victims of trafficking in persons, and the patterns in the UN Office on Drugs and Crime Global Report on Trafficking in Persons: exploitation and coercion.
Read the card →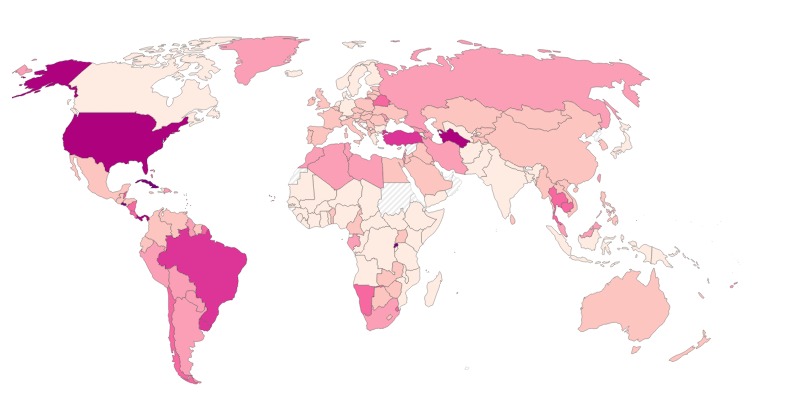
How many people each country holds in prison for every 100,000 residents, counting pre-trial detainees, from the World Prison Brief database.
Read the card →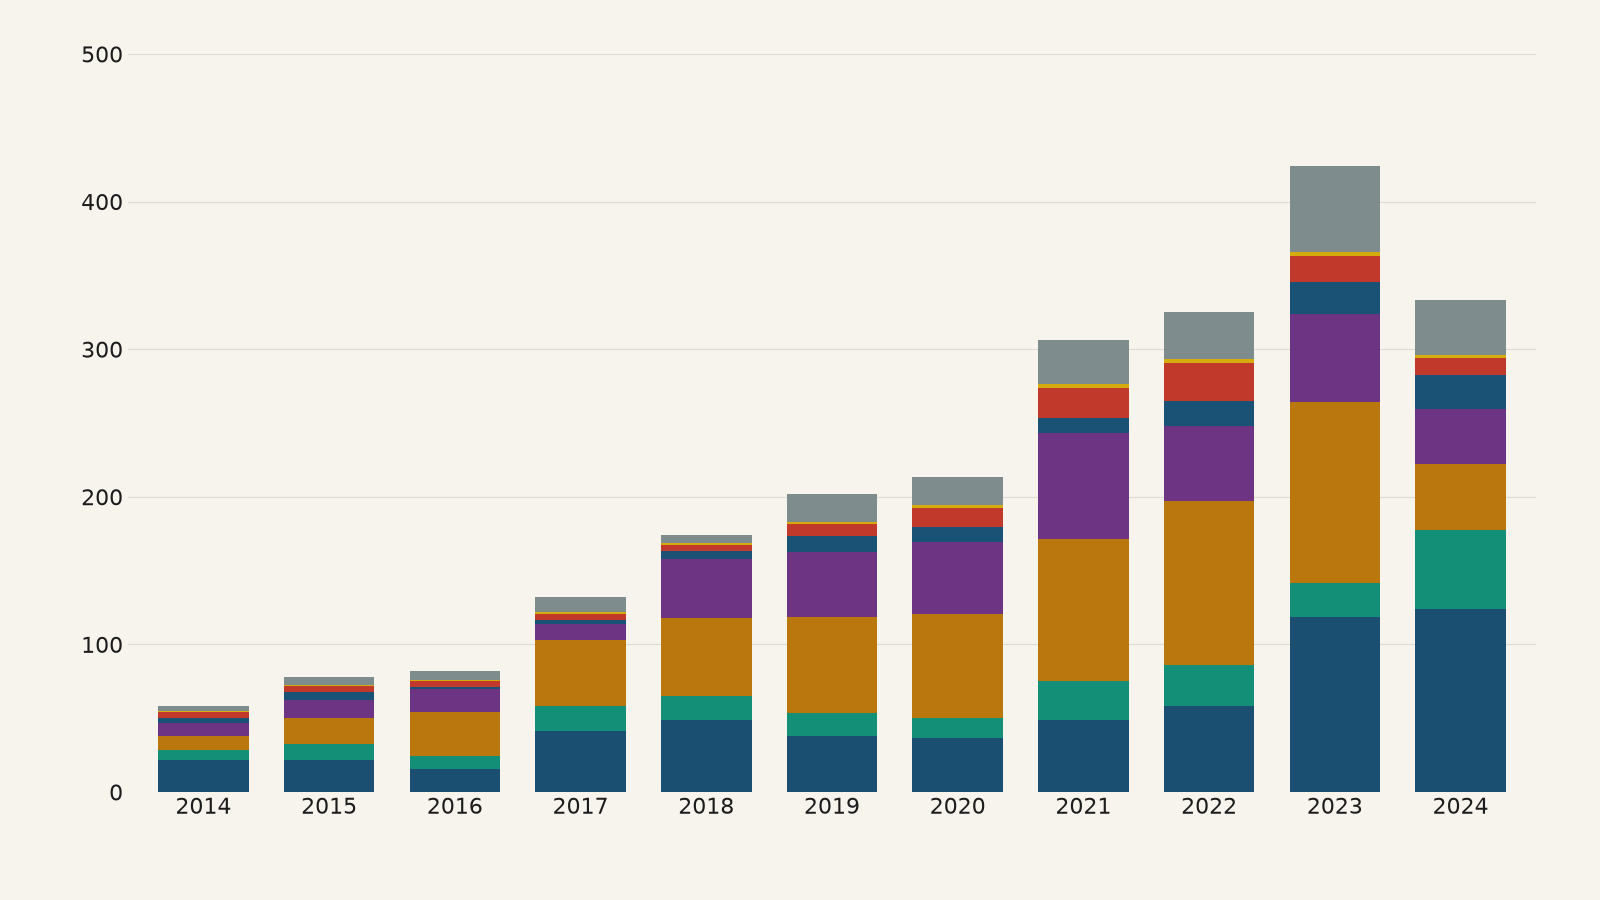
The main routes of cocaine, heroin and methamphetamine trafficking between world regions, mapped by the UN Office on Drugs and Crime from drug seizures reported for 2021 to 2024.
Read the card →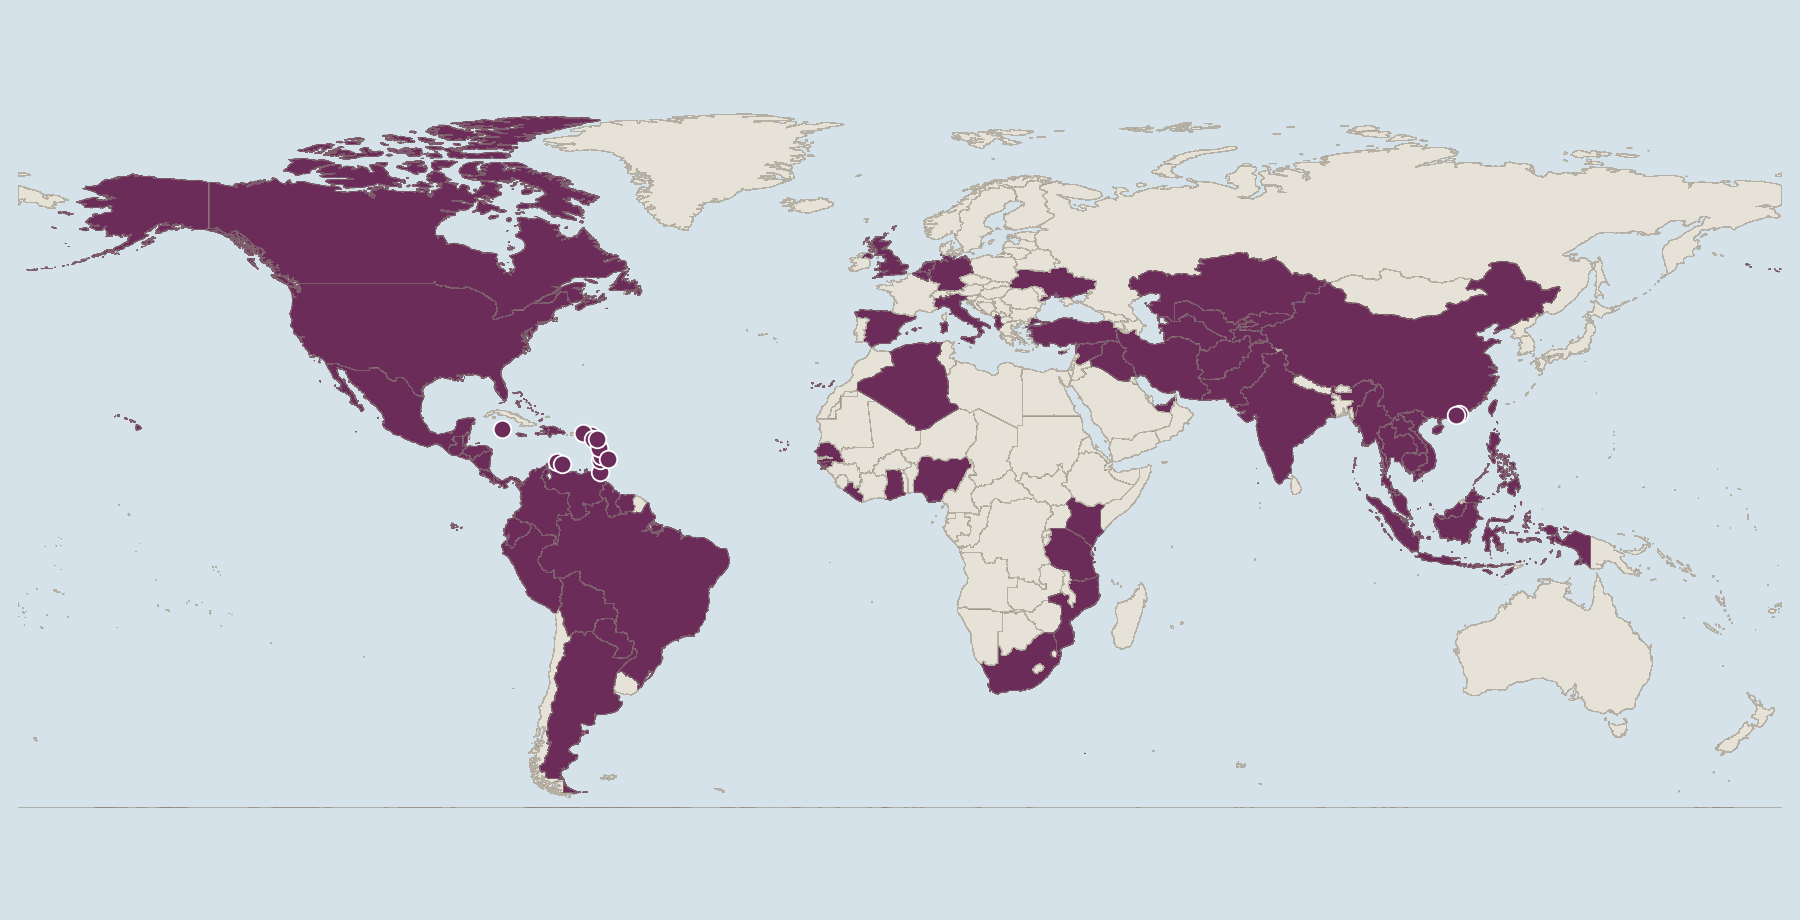
Risk scores from 0 to 10 for how exposed each country is to money laundering and related financial crime, and how well it can counter them, from the Basel Institute on Governance.
Read the card →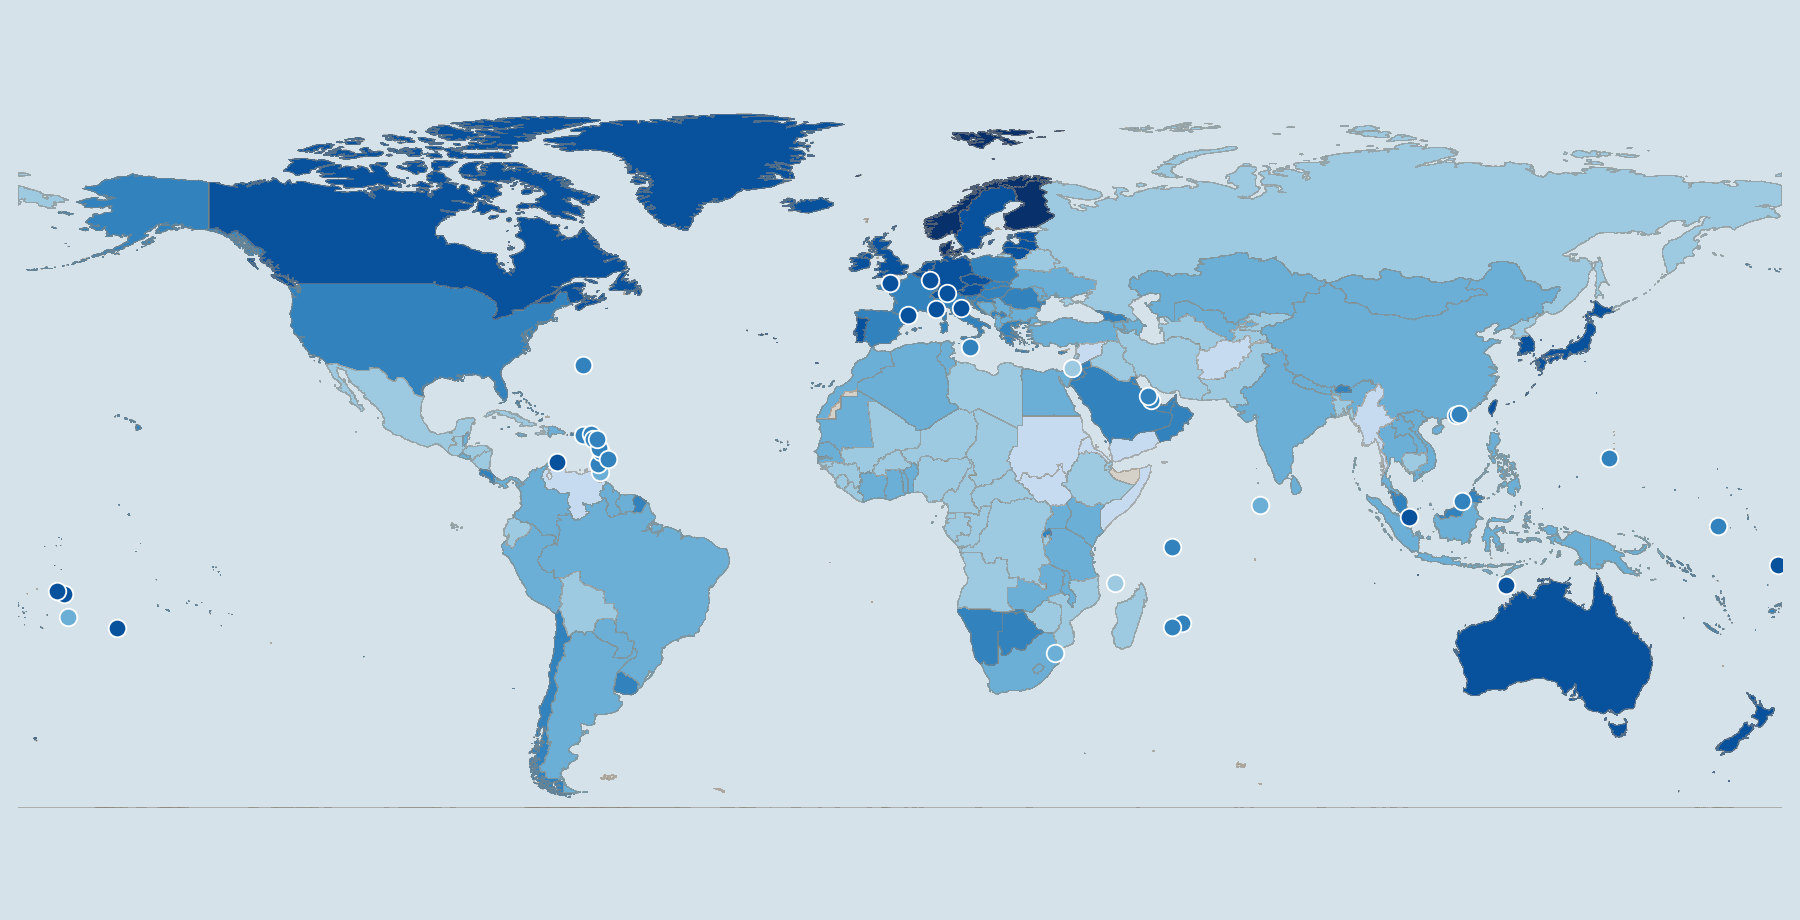
How people and legal experts in 143 countries experience limits on government power, corruption, open government, fundamental rights, order and security, regulation, and civil and criminal justice, scored from 0 to 1 by the World Justice Project.
Read the card →