

Crime
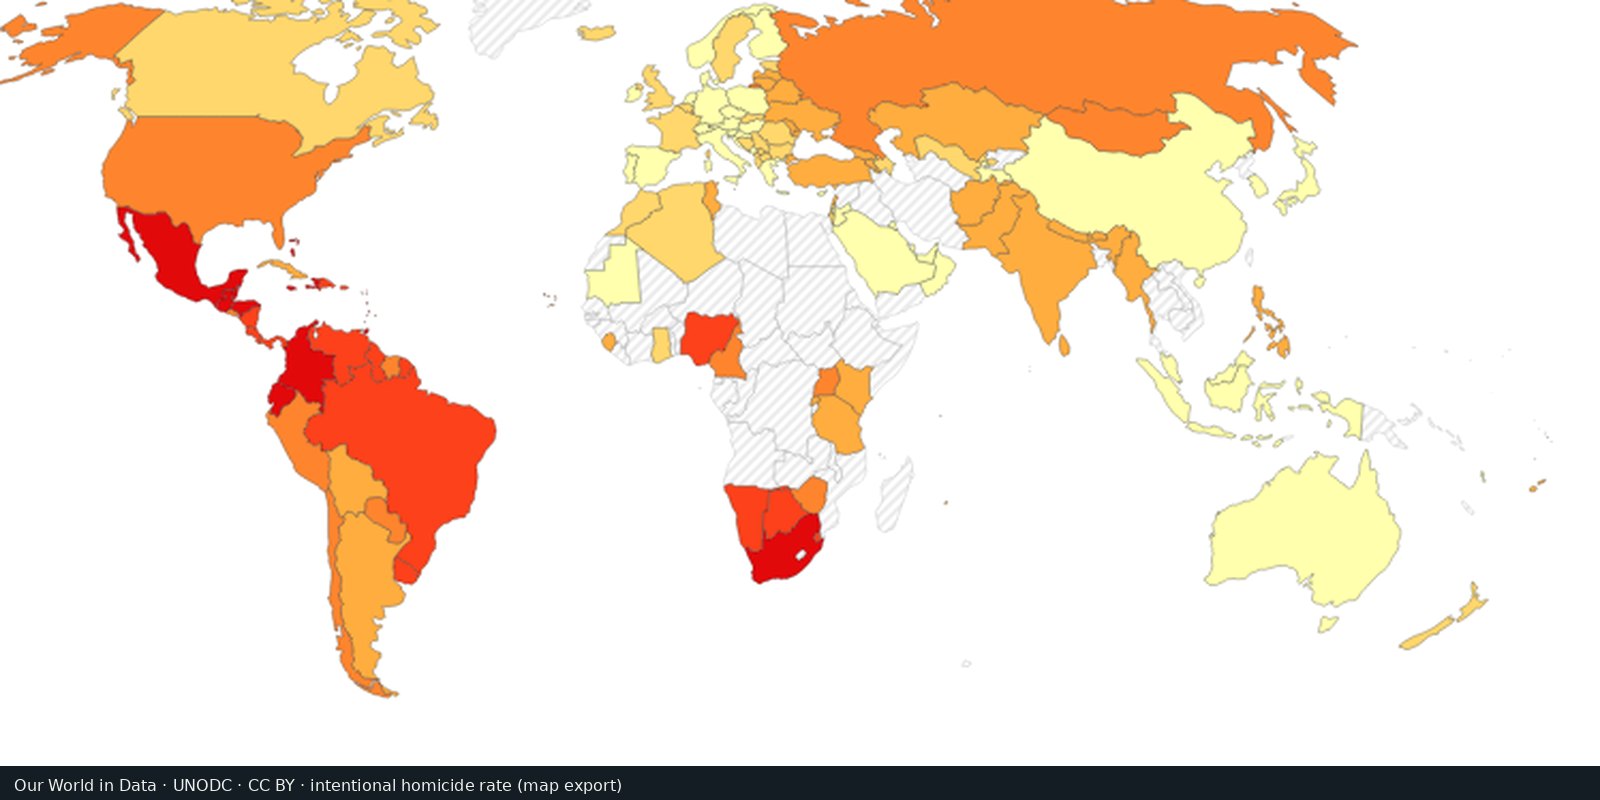
Intentional homicide rates
Comparable rates of intentional homicide from the UN Office on Drugs and Crime, one measure of violent crime.
Read the card →Perceived public-sector corruption on a scale from 0 to 100, from expert and business surveys: a measure of governance risk.
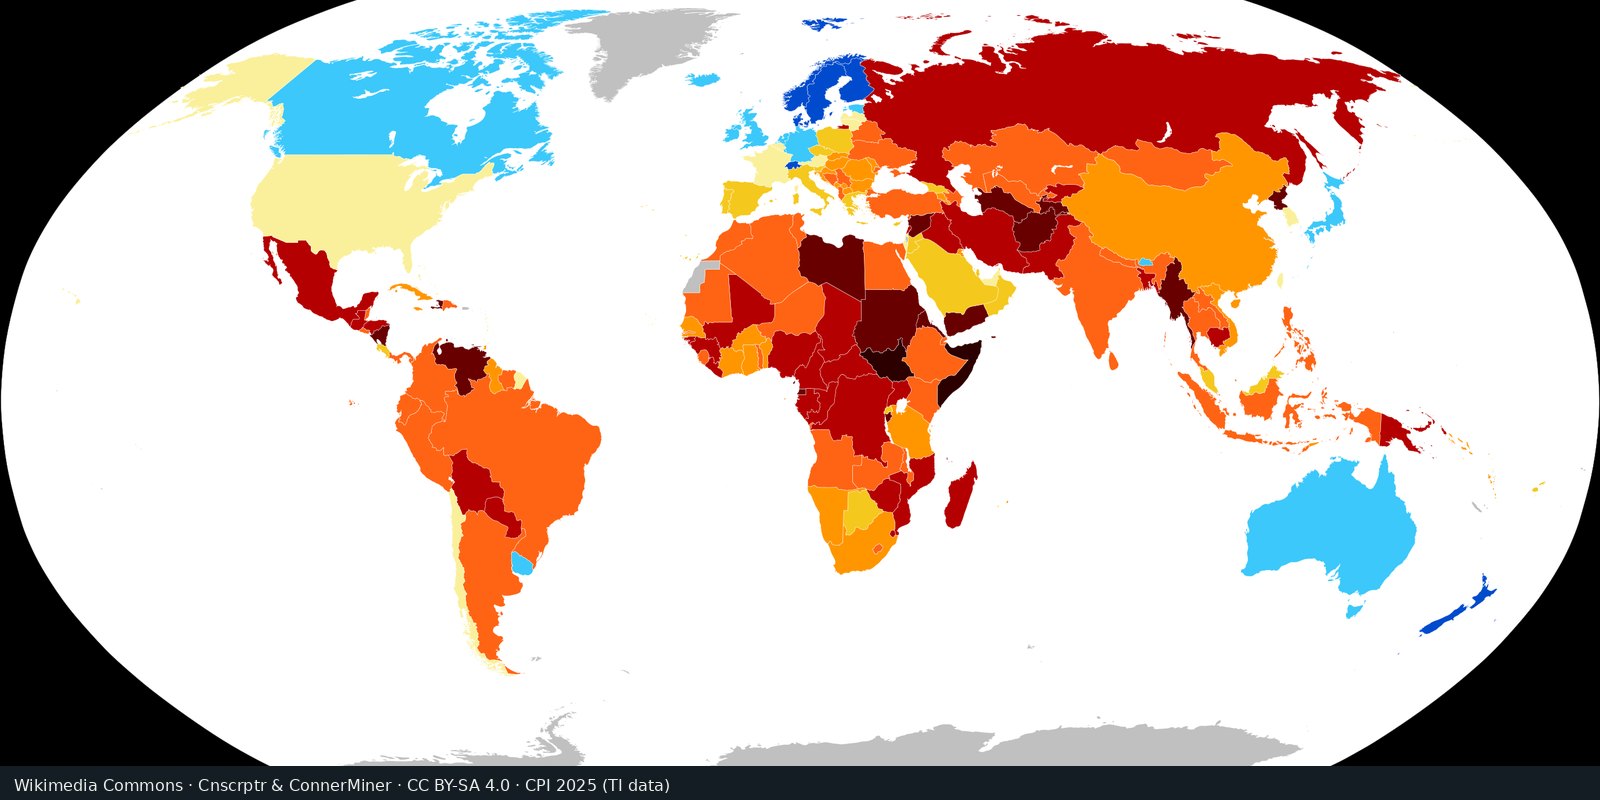
Transparency International; Our World in Data. CPI 2025.
Transparency International’s Corruption Perceptions Index (CPI) 2025 ranks countries on perceived public-sector corruption. The scale runs from 0 (highly corrupt) to 100 (very clean), combining expert and business surveys. Our World in Data republishes the series as an open map. This is a governance-risk composite, not a count of bribery cases and not a violent-crime rate.
Perceived public-sector corruption is a different public-harm signal from UNODC intentional homicide. Never merge this card with the homicide layer.
A score is a perception composite, not a tally of prosecutions or street crime. The year label is the CPI edition year (here 2025), not necessarily the calendar year of every underlying survey. Higher is cleaner. Compare nearby editions; one- or two-point moves are often noise. Open the Transparency International edition page for the official scores; open the OWID grapher for the interactive map.
Missing countries are not “clean.” Household experience of bribery is a different series. Do not read the thumbnail as a most-corrupt-country list. This is not a homicide choropleth.
We host a cropped Wikimedia Commons CPI 2025 country choropleth (Cnscrptr and ConnerMiner, CC BY-SA 4.0), drawn from Transparency International CPI 2025 data. Our World in Data republishes the CPI as an open map (CC BY). Open transparency.org/en/cpi/2025 for the edition.
Open source map → Comparable rates of intentional homicide from the UN Office on Drugs and Crime, one measure of violent crime.
Read the card →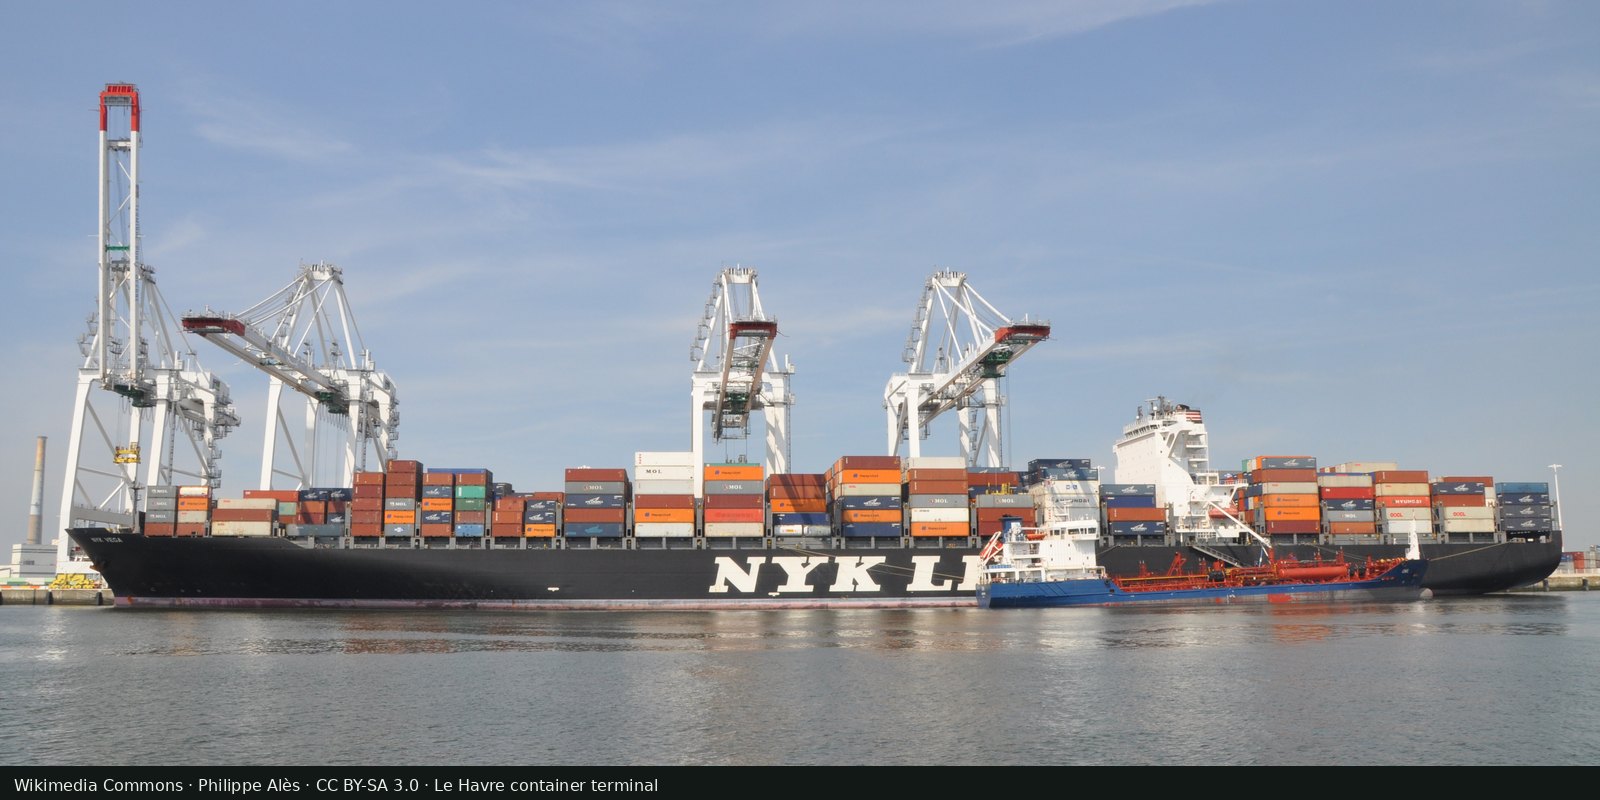
Country scores for criminal markets, criminal actors, and resilience: an expert-assessment heatmap of organized crime.
Read the card →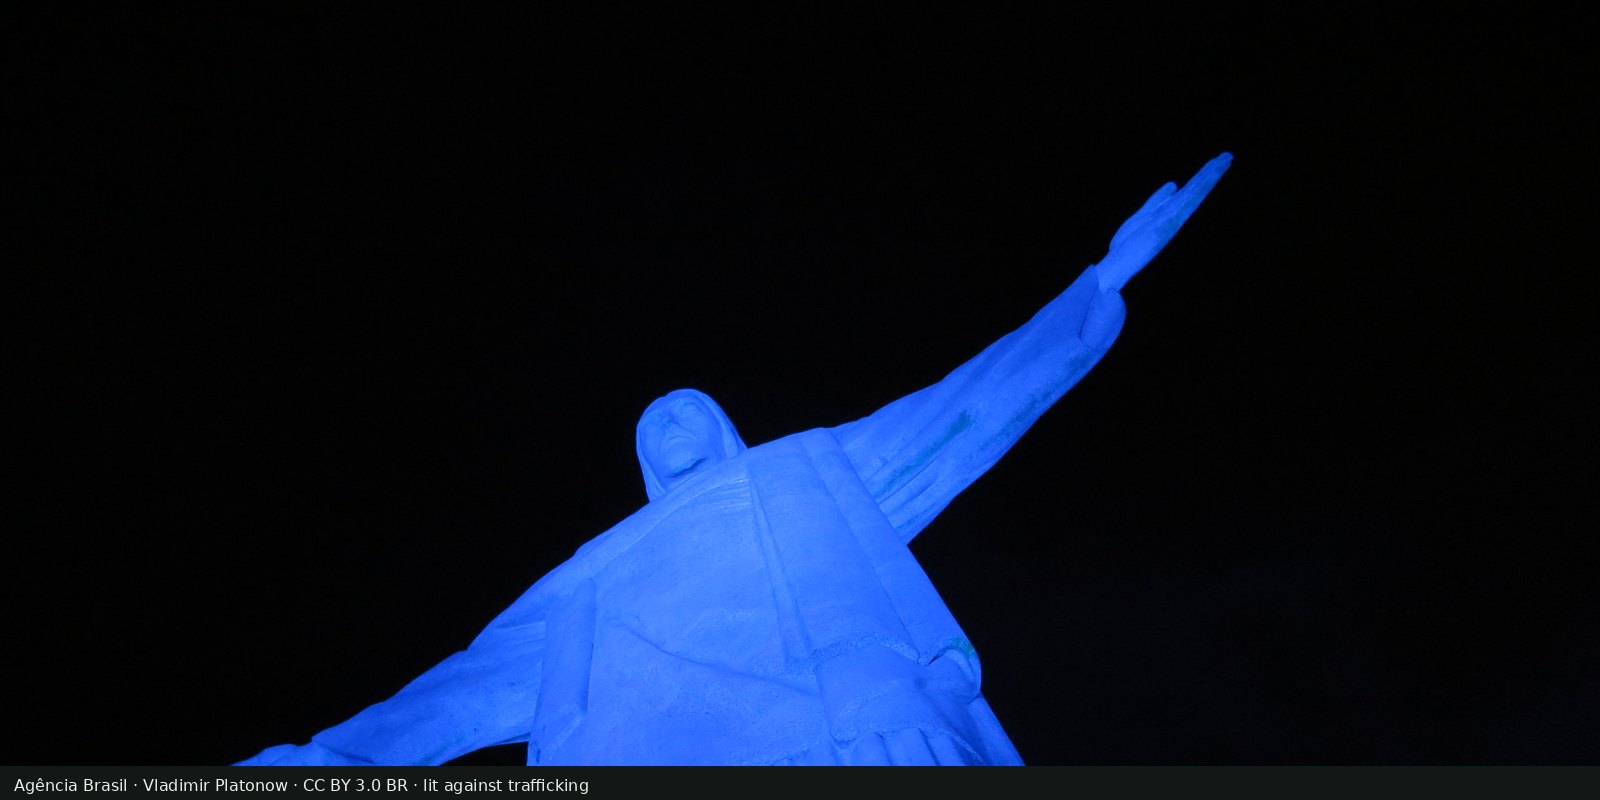
Detected victims of trafficking in persons, and the patterns in the UN Office on Drugs and Crime Global Report on Trafficking in Persons: exploitation and coercion.
Read the card →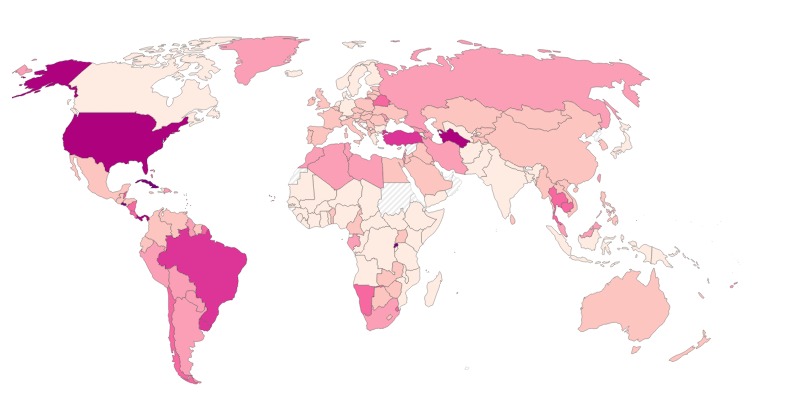
How many people each country holds in prison for every 100,000 residents, counting pre-trial detainees, from the World Prison Brief database.
Read the card →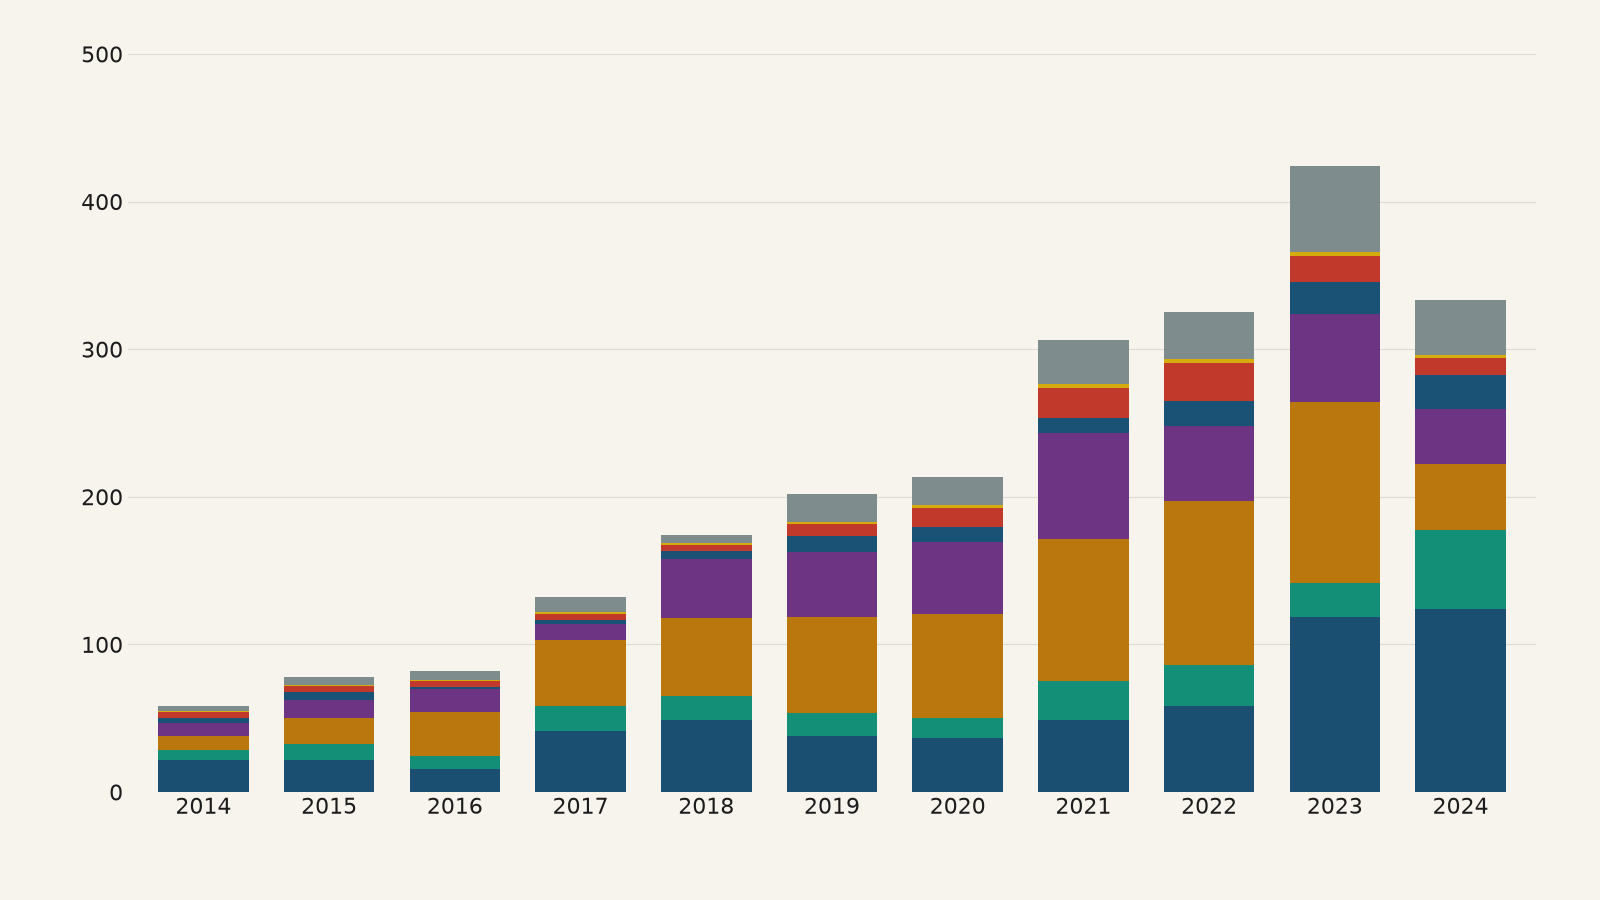
The main routes of cocaine, heroin and methamphetamine trafficking between world regions, mapped by the UN Office on Drugs and Crime from drug seizures reported for 2021 to 2024.
Read the card →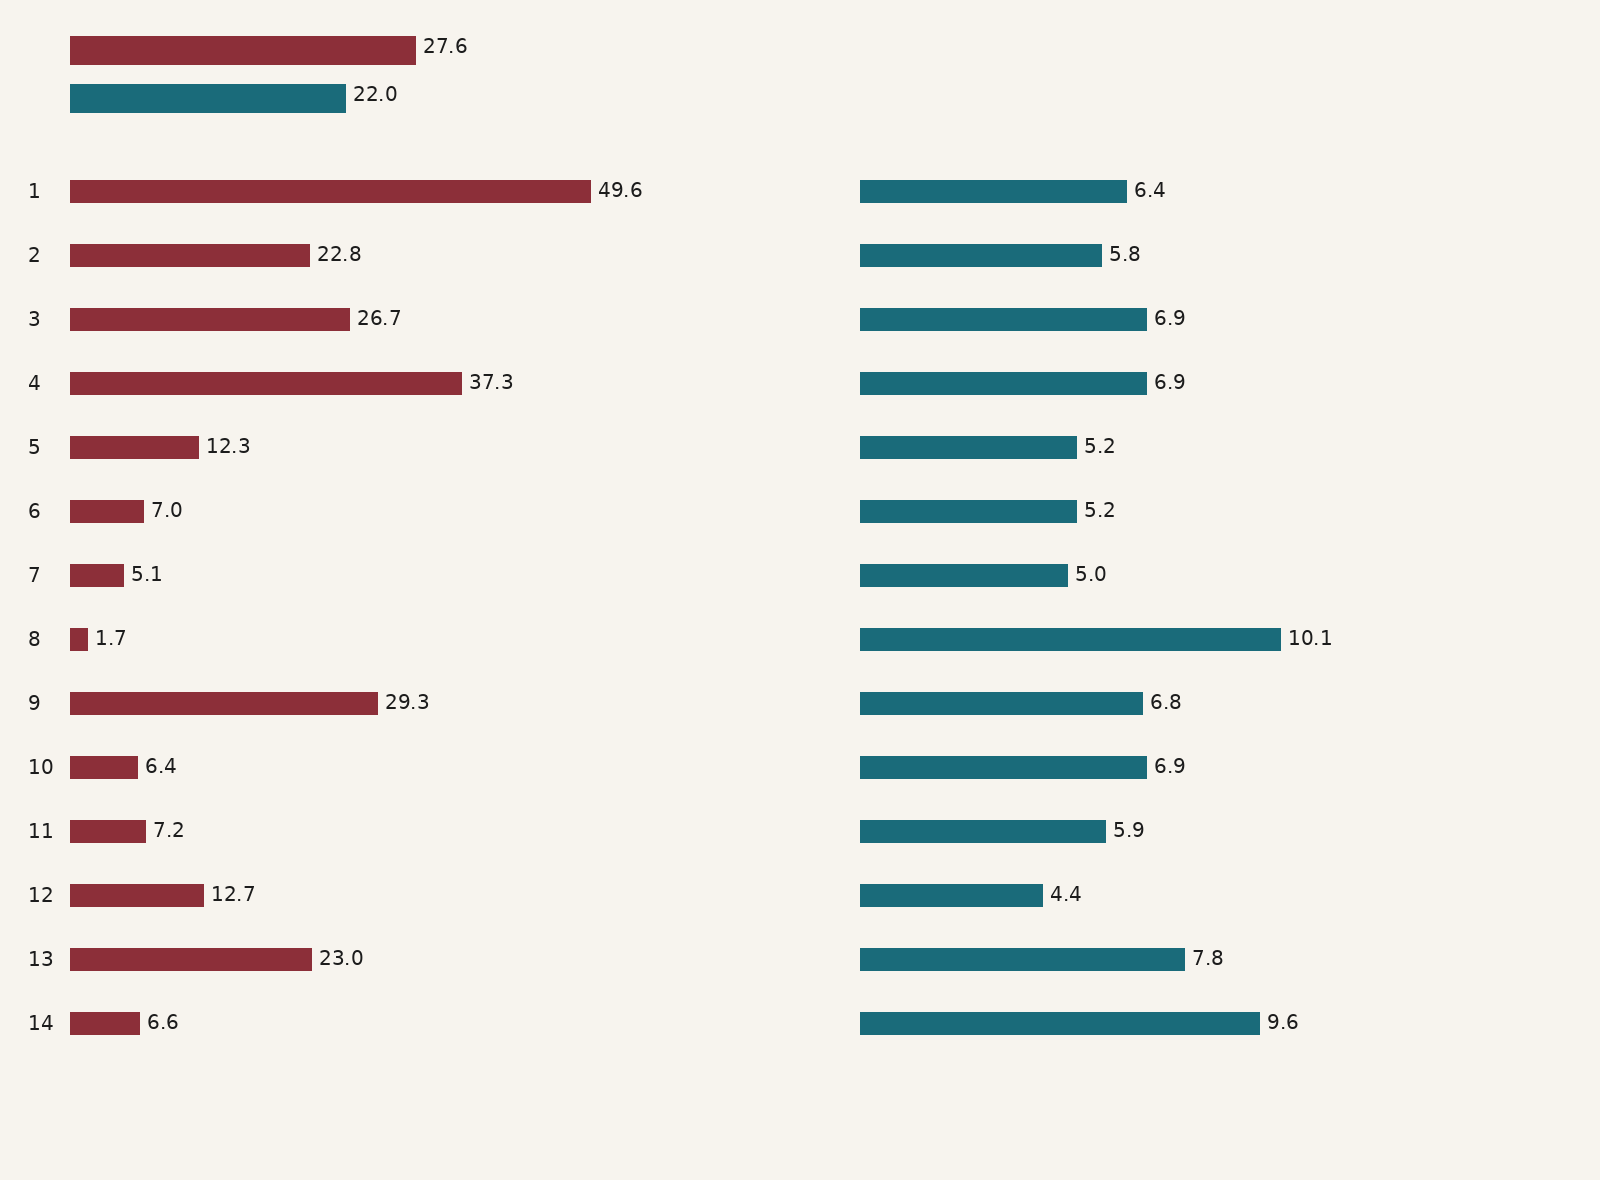
Estimated prevalence of modern slavery, meaning forced labour and forced marriage, in 160 countries, from Walk Free's Global Slavery Index, built on global estimates of about 50 million people in modern slavery in 2021.
Read the card →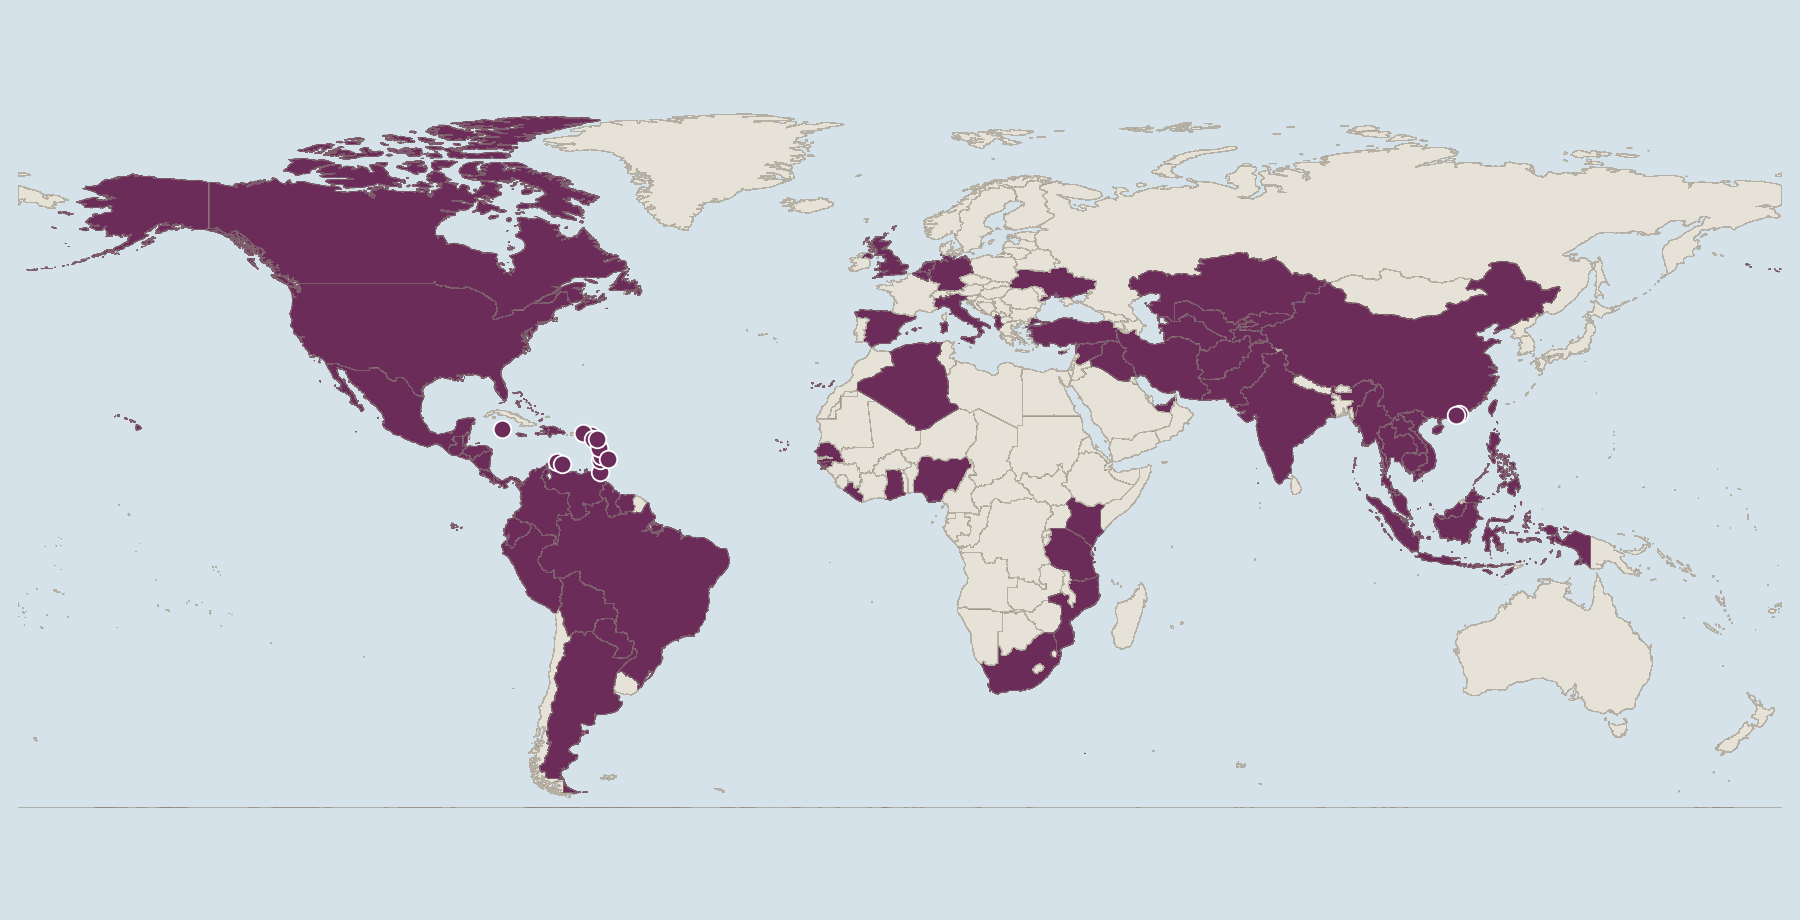
Risk scores from 0 to 10 for how exposed each country is to money laundering and related financial crime, and how well it can counter them, from the Basel Institute on Governance.
Read the card →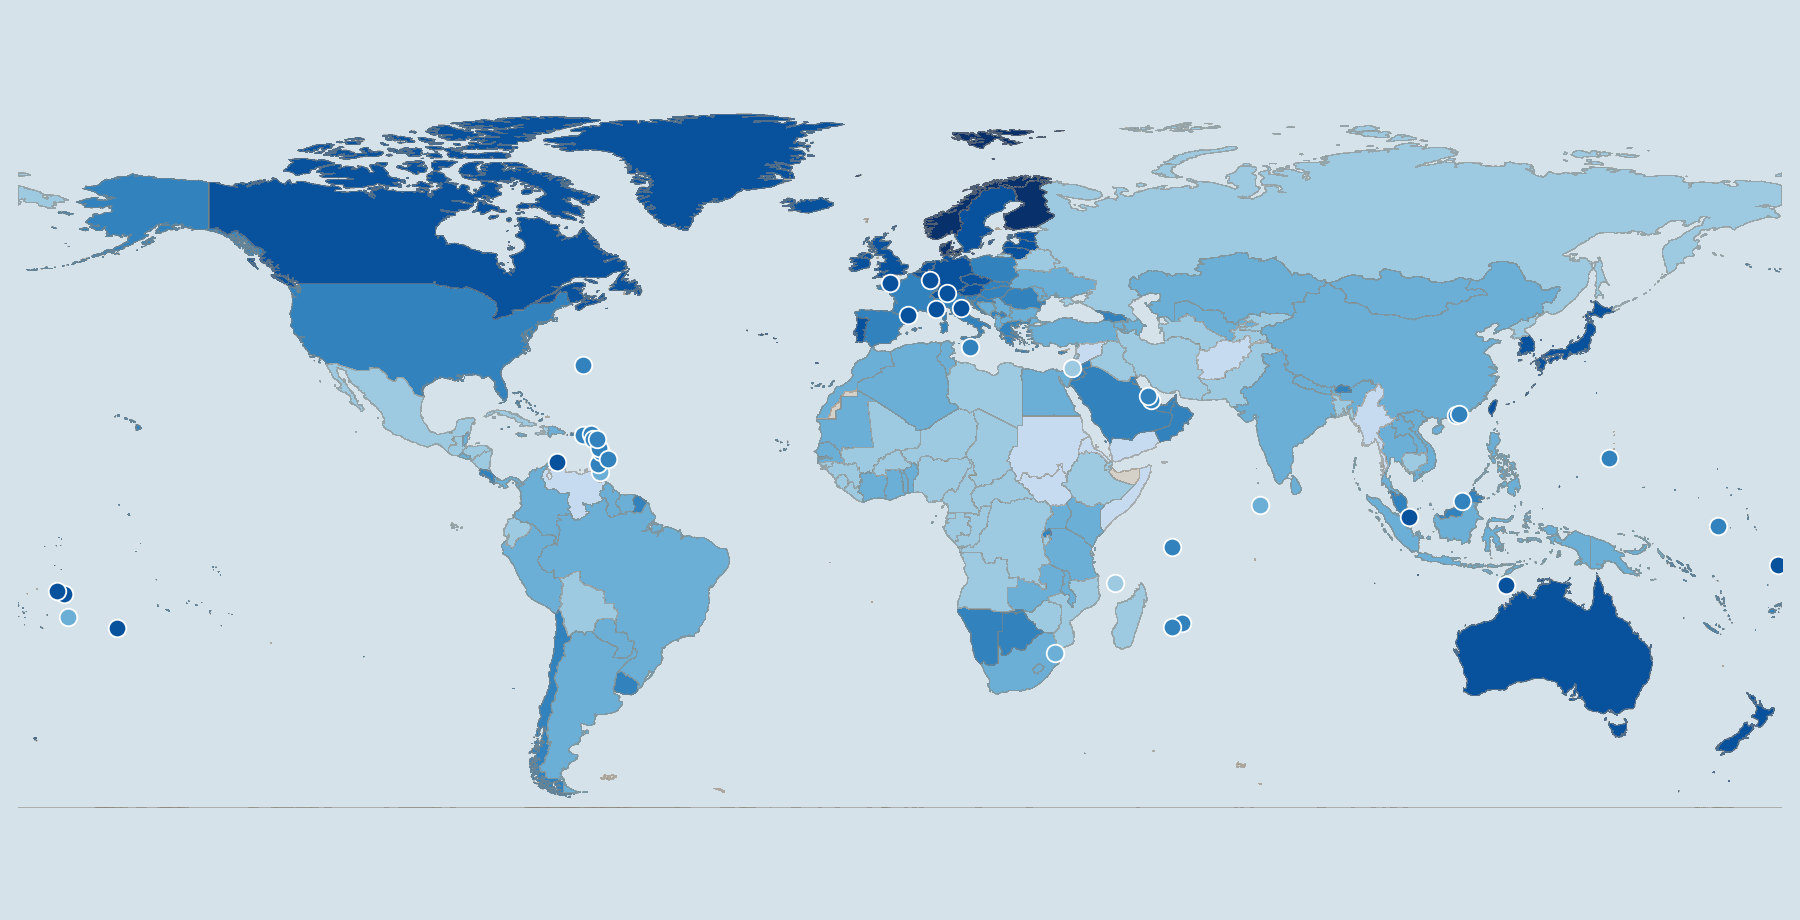
How people and legal experts in 143 countries experience limits on government power, corruption, open government, fundamental rights, order and security, regulation, and civil and criminal justice, scored from 0 to 1 by the World Justice Project.
Read the card →