

Crime
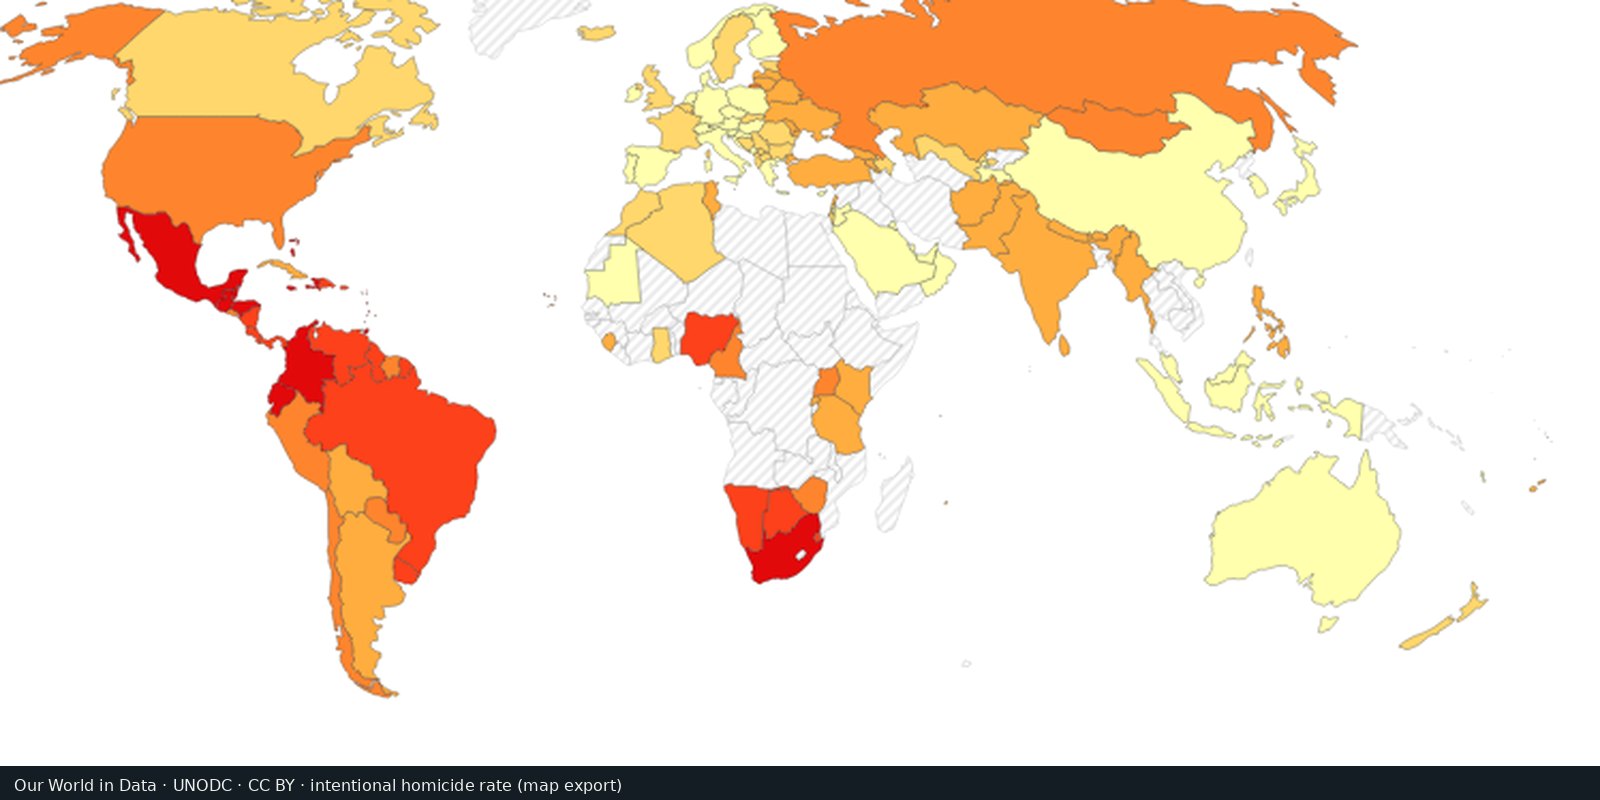
Intentional homicide rates
Comparable rates of intentional homicide from the UN Office on Drugs and Crime, one measure of violent crime.
Read the card →The main routes of cocaine, heroin and methamphetamine trafficking between world regions, mapped by the UN Office on Drugs and Crime from drug seizures reported for 2021 to 2024.
Cocaine seized in Europe, 2014 to 2024
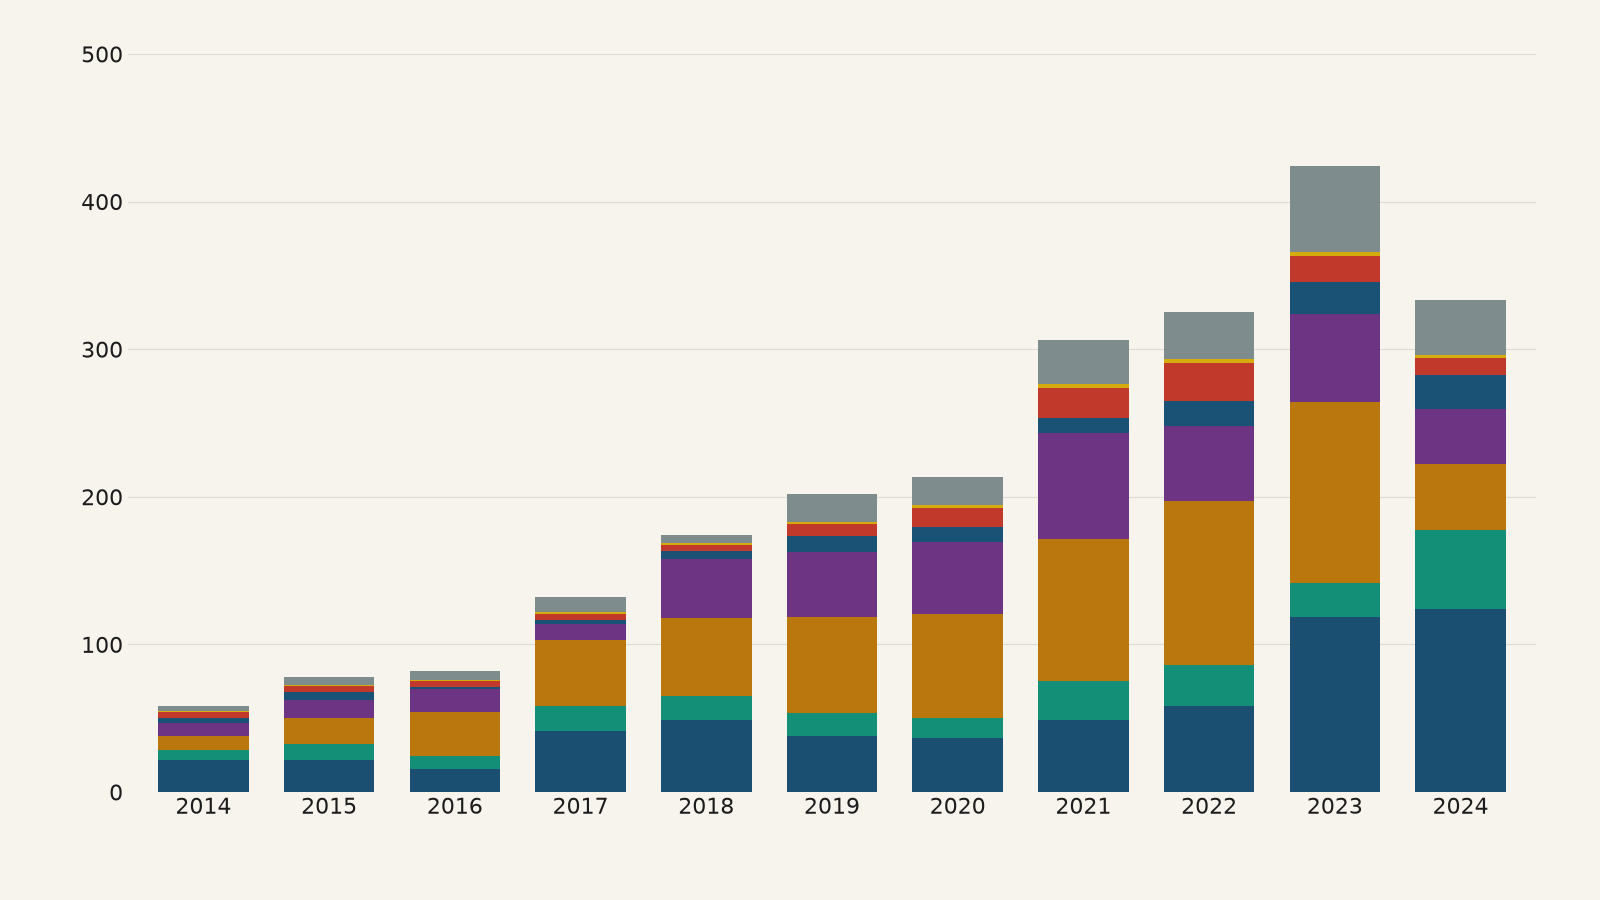
Tonnes, from the bottom of each column
Cocaine seized in the 27 EU countries, Norway and Türkiye, 2014 to 2024, in tonnes, by country.
Chart: Fix Planet, drawn from European Union Drugs Agency (EUDA) data, European Drug Report 2026, table EDR26-Cocaine-6. Reuse permitted with acknowledgement (compatible with CC BY 4.0).
The World Drug Report 2026 from the United Nations Office on Drugs and Crime (UNODC) comes with a statistical annex that includes three world maps of the main trafficking flows of methamphetamine, cocaine and heroin. Each map summarises drug seizures reported for 2021 to 2024. Companion maps show the main departure or transit countries and the main destination countries for each drug, and annex tables cover cultivation, manufacture, seizures, prices and purity.
The maps show how drugs travel from producing regions through transit hubs to consumer markets. Europe is one example: the European Union Drugs Agency (EUDA) reports that EU countries seized 330 tonnes of cocaine in 2024, after a record 419 tonnes in 2023, with Spain (124 tonnes) and France (53.5 tonnes) reporting the largest amounts.
The width of each route reflects the total amount seized on it, rated from very low to very high. Routes come from what UN Member States report in their annual questionnaires, in reports of individual seizures and in other official documents. Arrows point in the direction of trafficking: a route starts where a shipment departed or was last seen and ends where it was consumed or headed next, so the start of an arrow can lie in a different country from the one where the drug was produced. UNODC describes the routes as broadly indicative; smaller secondary routes may be missing.
Seizures depend on where and how intensively authorities search, so heavily policed routes can look larger. The preview chart covers the 27 EU countries, Norway and Türkiye; the UNODC maps cover the whole world.
Chart: Fix Planet, drawn from European Union Drugs Agency (EUDA) data, European Drug Report 2026, table EDR26-Cocaine-6. Reuse permitted with acknowledgement (compatible with CC BY 4.0).
Open source map → Comparable rates of intentional homicide from the UN Office on Drugs and Crime, one measure of violent crime.
Read the card →
Country scores for criminal markets, criminal actors, and resilience: an expert-assessment heatmap of organized crime.
Read the card →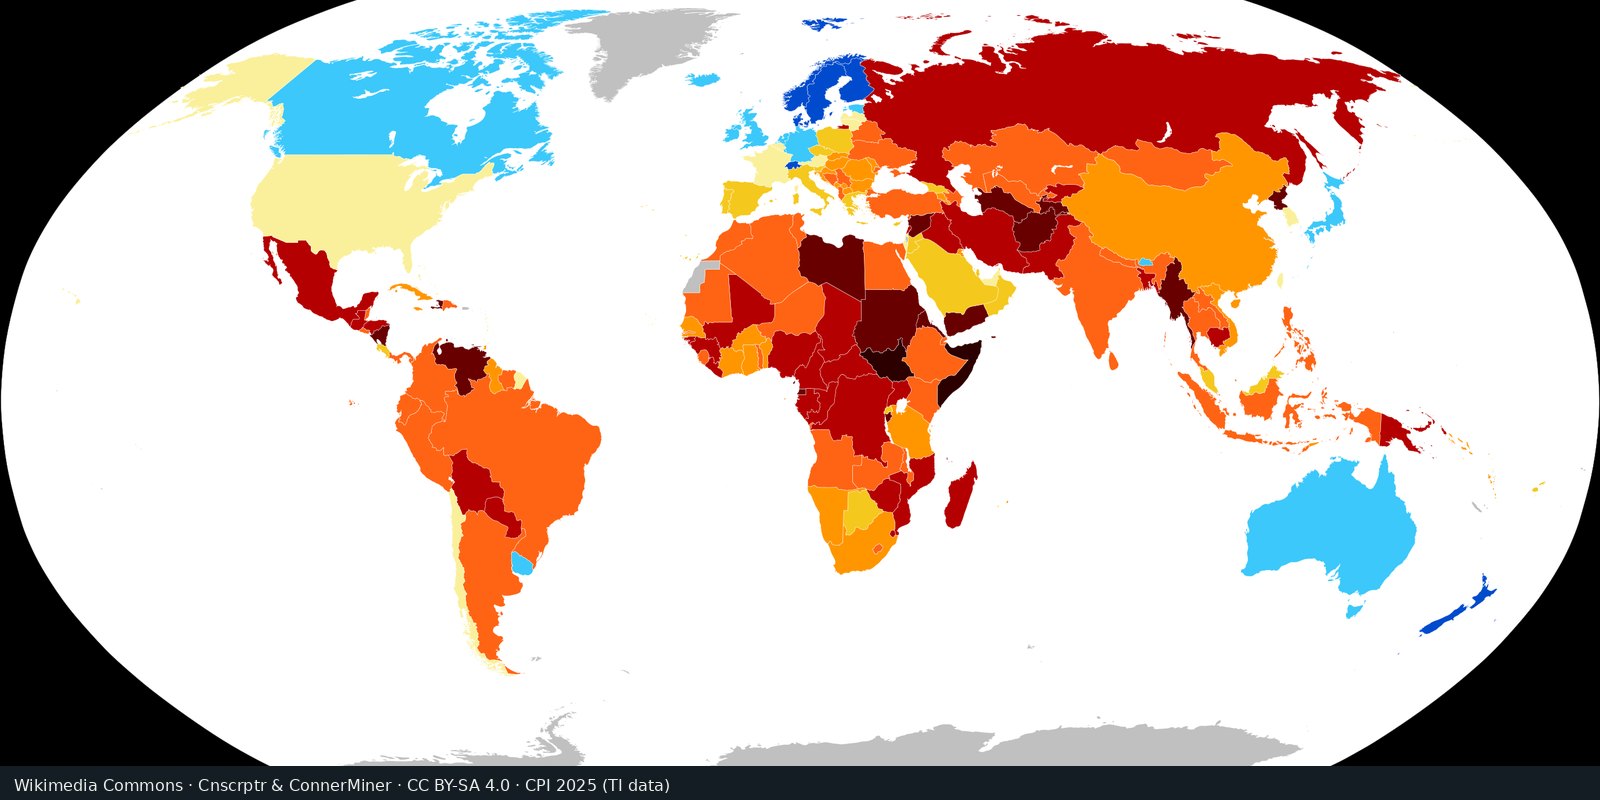
Perceived public-sector corruption on a scale from 0 to 100, from expert and business surveys: a measure of governance risk.
Read the card →
Detected victims of trafficking in persons, and the patterns in the UN Office on Drugs and Crime Global Report on Trafficking in Persons: exploitation and coercion.
Read the card →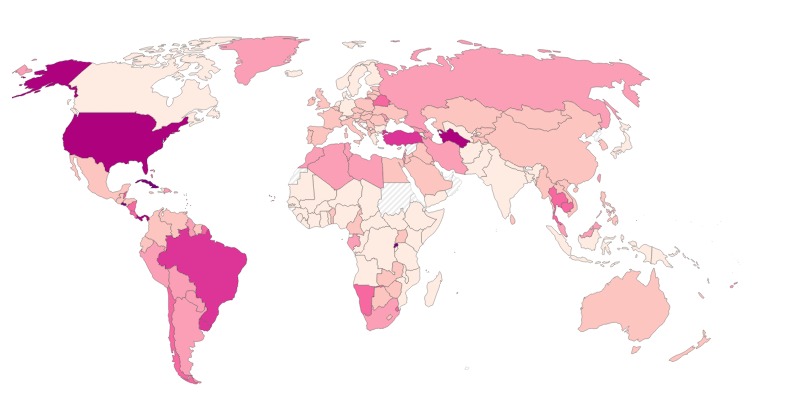
How many people each country holds in prison for every 100,000 residents, counting pre-trial detainees, from the World Prison Brief database.
Read the card →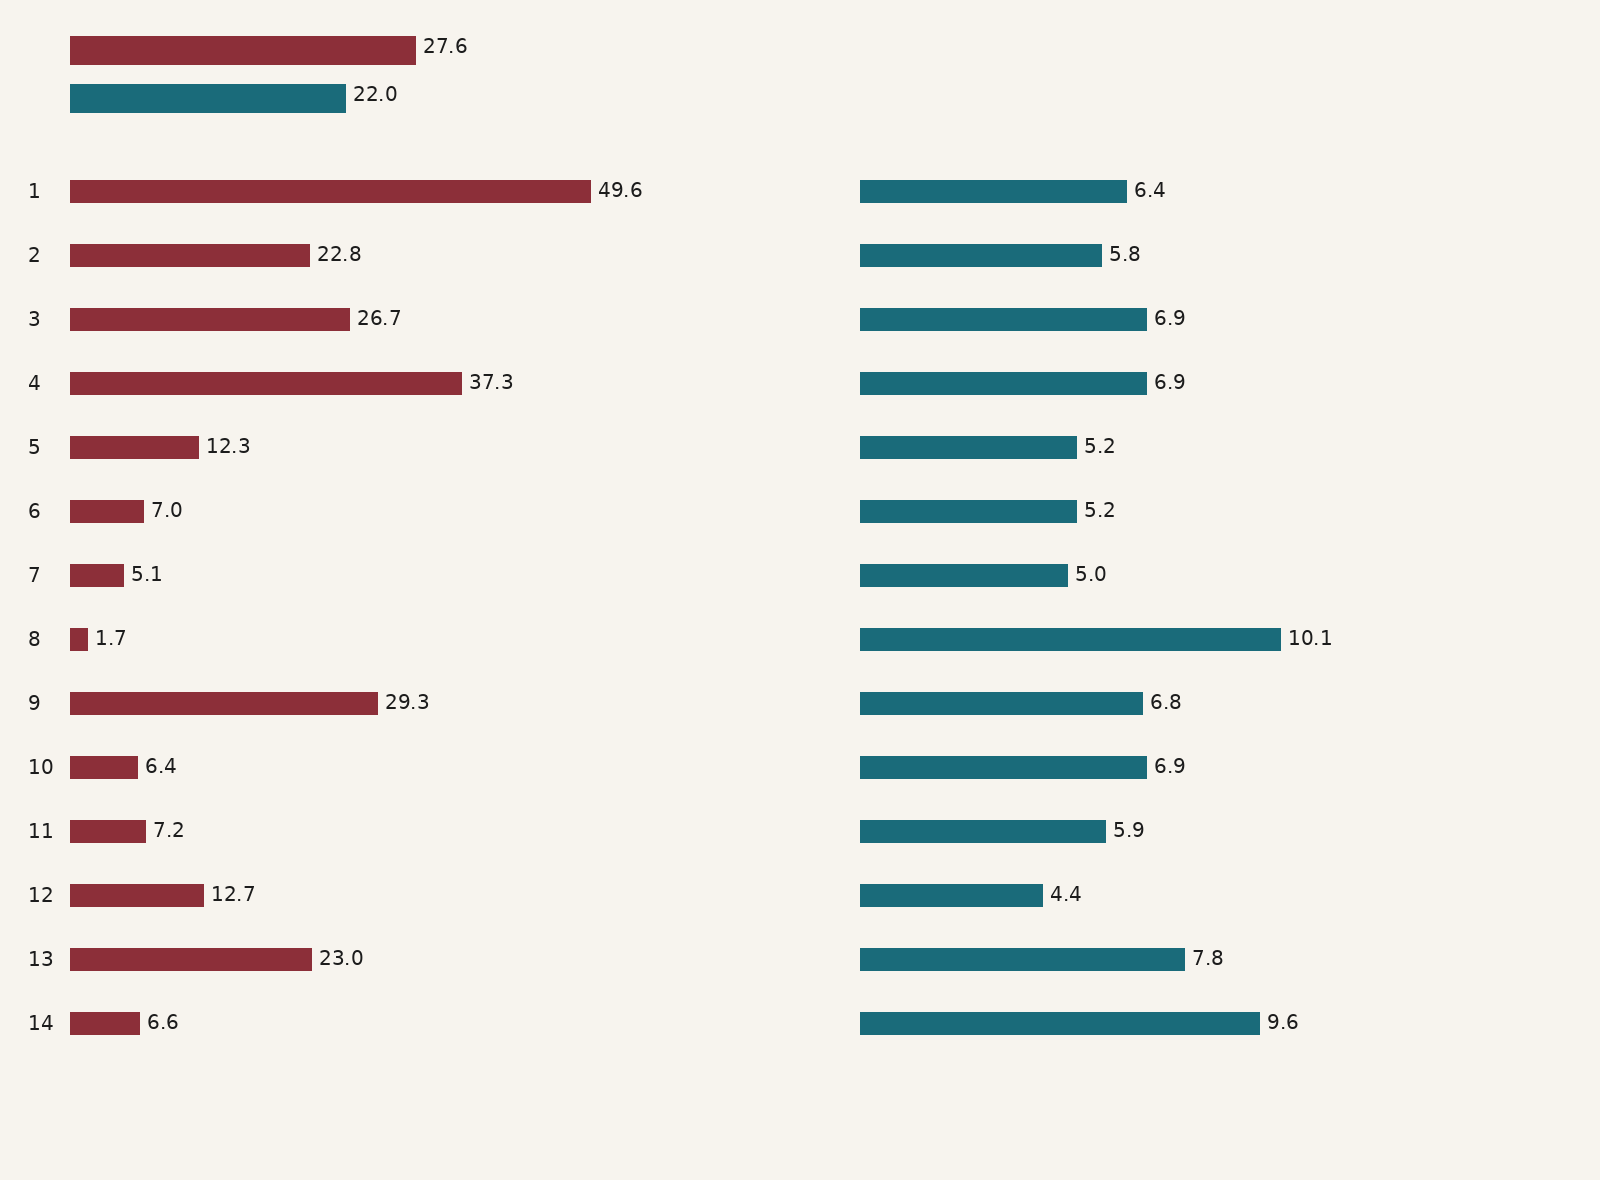
Estimated prevalence of modern slavery, meaning forced labour and forced marriage, in 160 countries, from Walk Free's Global Slavery Index, built on global estimates of about 50 million people in modern slavery in 2021.
Read the card →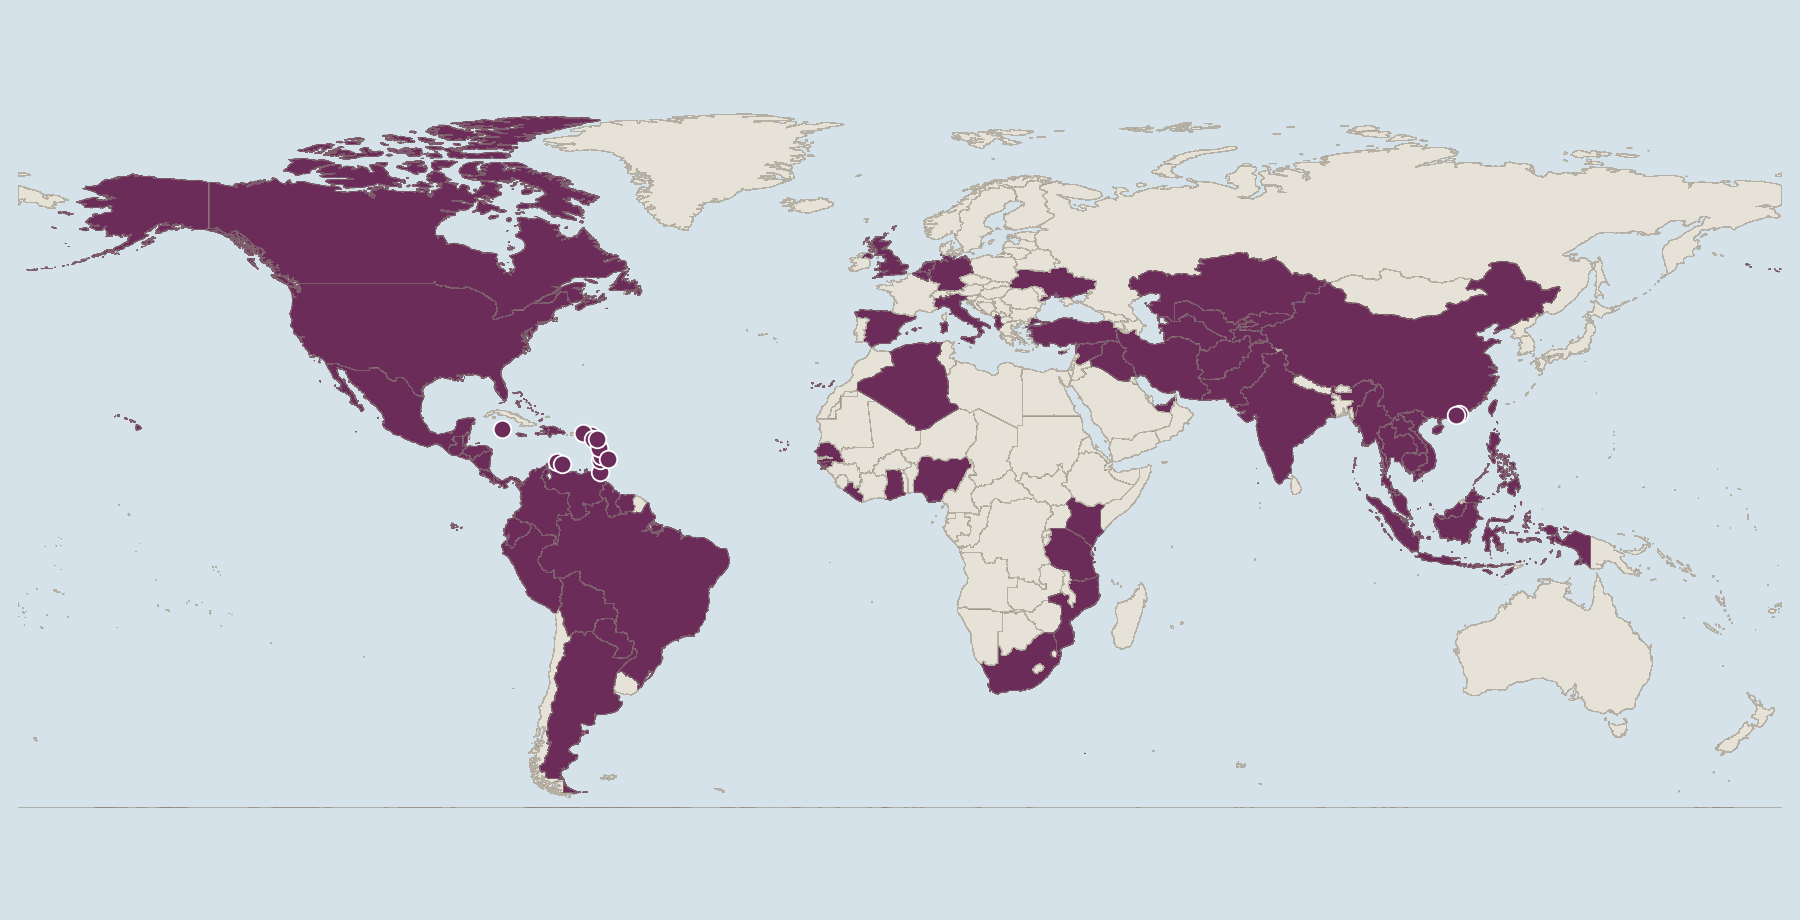
Risk scores from 0 to 10 for how exposed each country is to money laundering and related financial crime, and how well it can counter them, from the Basel Institute on Governance.
Read the card →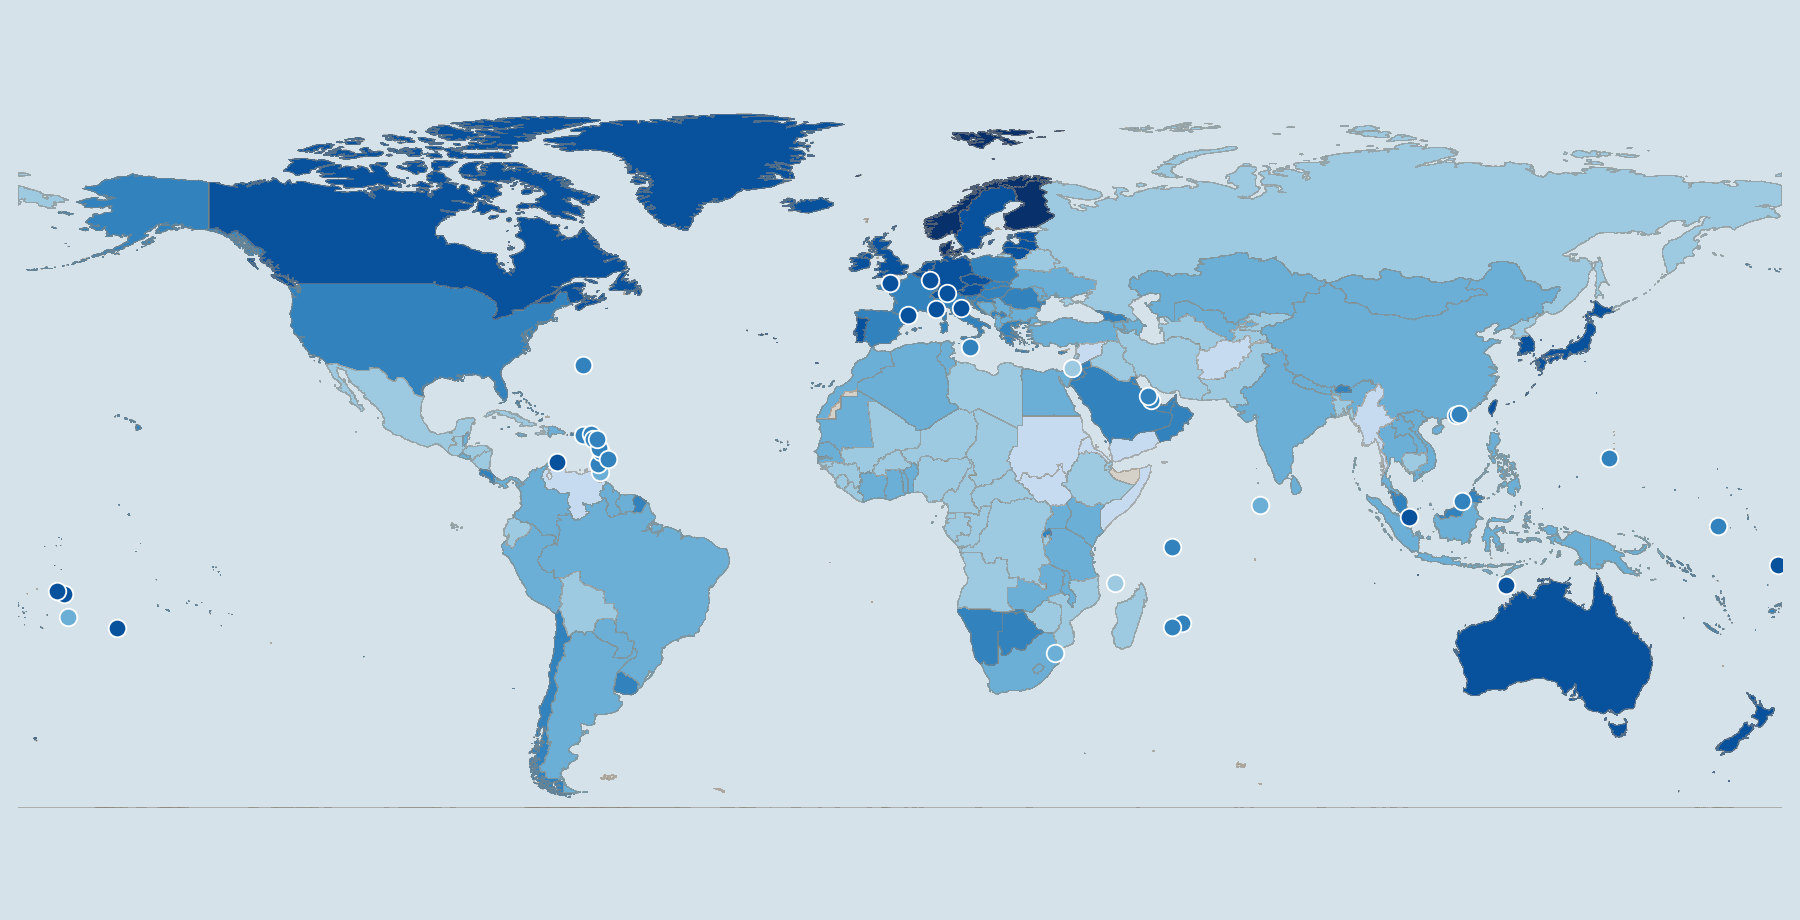
How people and legal experts in 143 countries experience limits on government power, corruption, open government, fundamental rights, order and security, regulation, and civil and criminal justice, scored from 0 to 1 by the World Justice Project.
Read the card →