

Subsurface
Oil and gas around the world
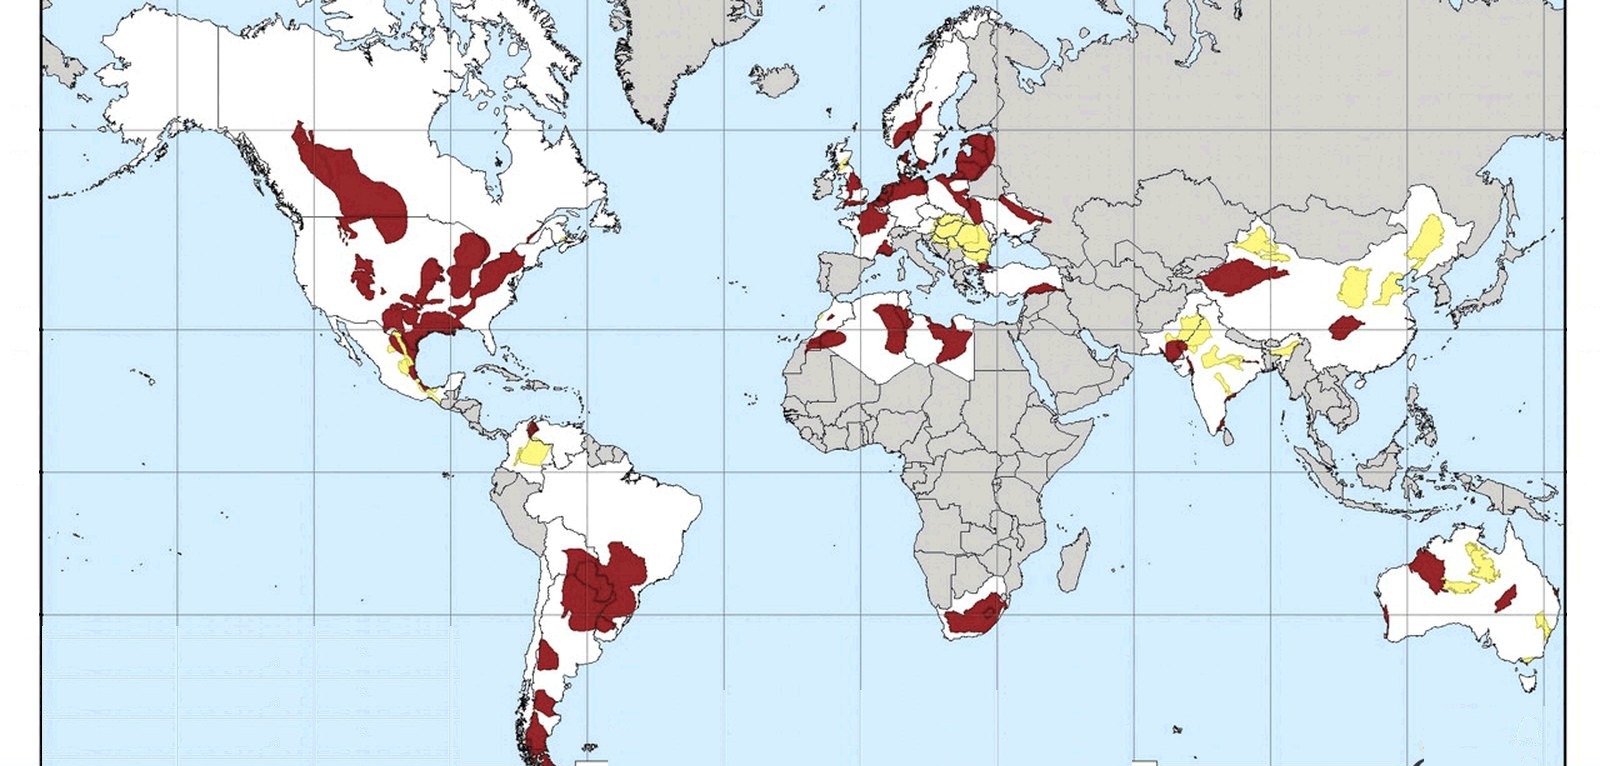
Petroleum and natural-gas deposits, reserves, and trade, published by the U.S. Energy Information Administration.
Read the card →Source: U.S. Energy Information Administration, international energy data
The countries that produced at least 5% of world output of key minerals in 2023, at the mine and at the refinery.
Minerals with at least 5% of world mine output
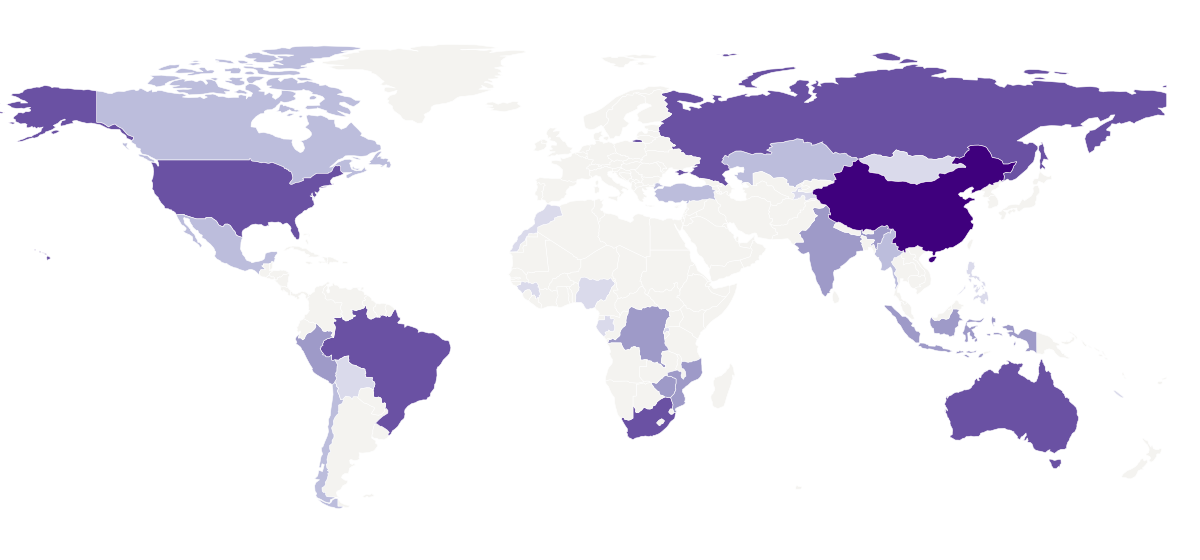
Countries that mined at least 5% of world output of one or more selected minerals, 2023.
Map: Fix Planet, redrawn from the U.S. Geological Survey map of leading mining countries in Global Maps of Critical Mineral Production in 2023, public domain. Boundaries: Natural Earth, public domain.
In August 2025 the U.S. Geological Survey, the science agency of the United States Department of the Interior, published global maps of critical mineral production in 2023. They show every country that produced 5% or more of world output of a mineral, first at the mining stage, for 29 minerals, and then at the processing stage, for 18 minerals, where ores are refined and smelted into oxides, metals or alloys. The production figures come from the survey’s yearbook, Mineral Commodity Summaries 2025.
A few countries dominate. China mined at least 5% of world output of 18 of the 29 minerals, followed by South Africa (10), Australia (8), Russia (8), the United States (8) and Brazil (7). In processing, China leads with 14 of the 18, followed by Japan (7), Russia (6), Canada (4) and the Republic of Korea (4). China’s share grows from mine to refinery: for cobalt it rises from 1% of mine output to 80% of processed output, and for aluminium from 21% to 59%.
The map shows the mining stage. The darker a country, the more minerals for which it mined at least 5% of world output. Trade shows where ore goes next: in 2023 Australia supplied 33% of world exports of metal ores and concentrates by value, followed by Brazil (11%), Chile and Peru (9% each) and South Africa (5%), while China bought 64% of imports.
Some minor metals, such as gallium, germanium and indium, are recovered as by-products of processing copper and lead-zinc ores, so they appear only at the processing stage. Some processing figures for 2023 were estimated from earlier years. A pale country may still produce a mineral in smaller amounts. The maps were drawn when the official United States list of critical minerals, from 2022, had 50 entries; the final 2025 list, published on 7 November 2025, has 60. The maps also cover cadmium, copper, gold and molybdenum.
Map: Fix Planet, redrawn from the U.S. Geological Survey map of leading mining countries in Global Maps of Critical Mineral Production in 2023, public domain. Boundaries: Natural Earth, public domain.
Open source map → Petroleum and natural-gas deposits, reserves, and trade, published by the U.S. Energy Information Administration.
Read the card →Source: U.S. Energy Information Administration, international energy data
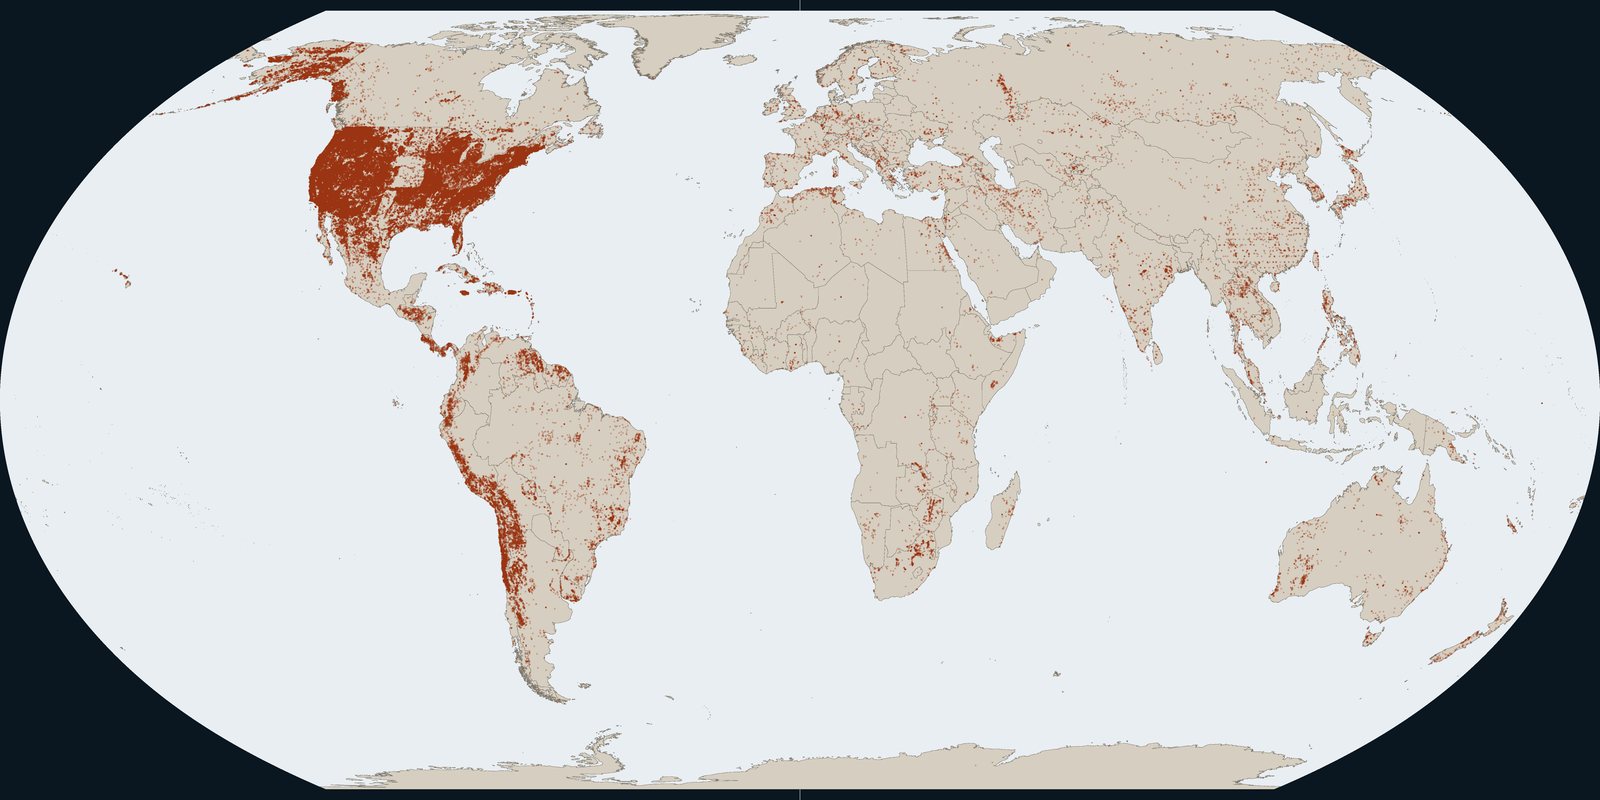
Known deposits of metals and industrial minerals, including gold, from the U.S. Geological Survey.
Read the card →Source: U.S. Geological Survey, Mineral Resources Data System
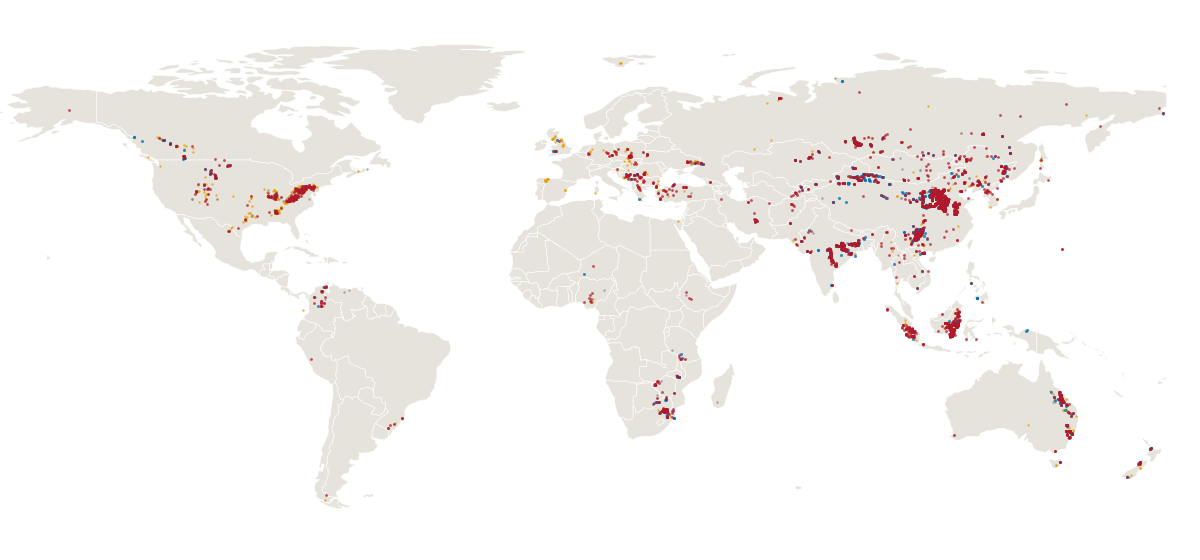
Operating, proposed and recently closed coal mines around the world, with their status, owners and output.
Read the card →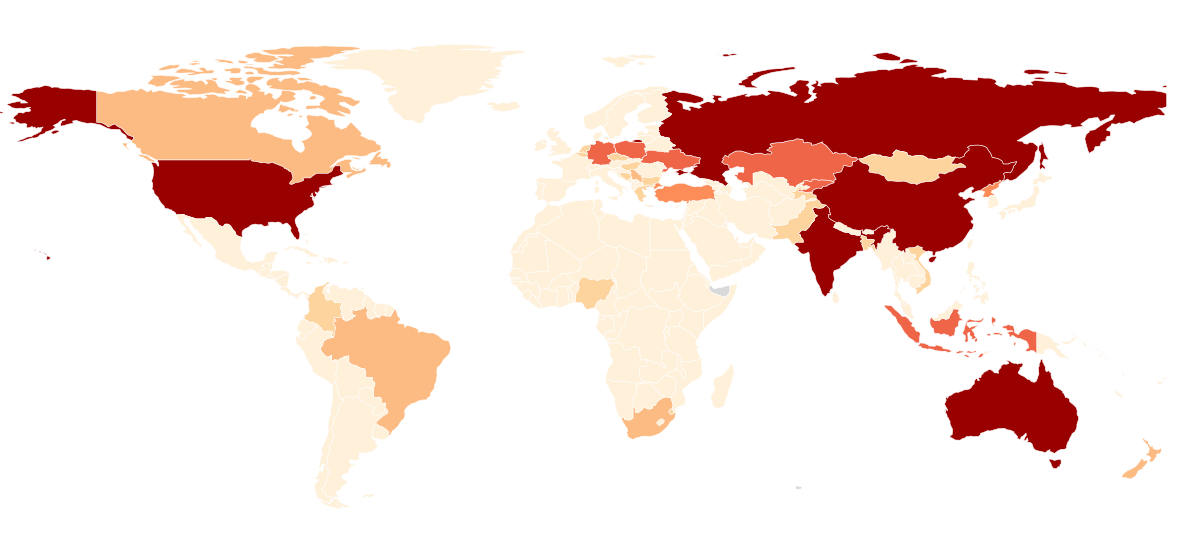
How much coal each country reports as proved reserves, the coal that known deposits can yield at today’s prices and with today’s technology.
Read the card →Source: U.S. Energy Information Administration, via Our World in Data
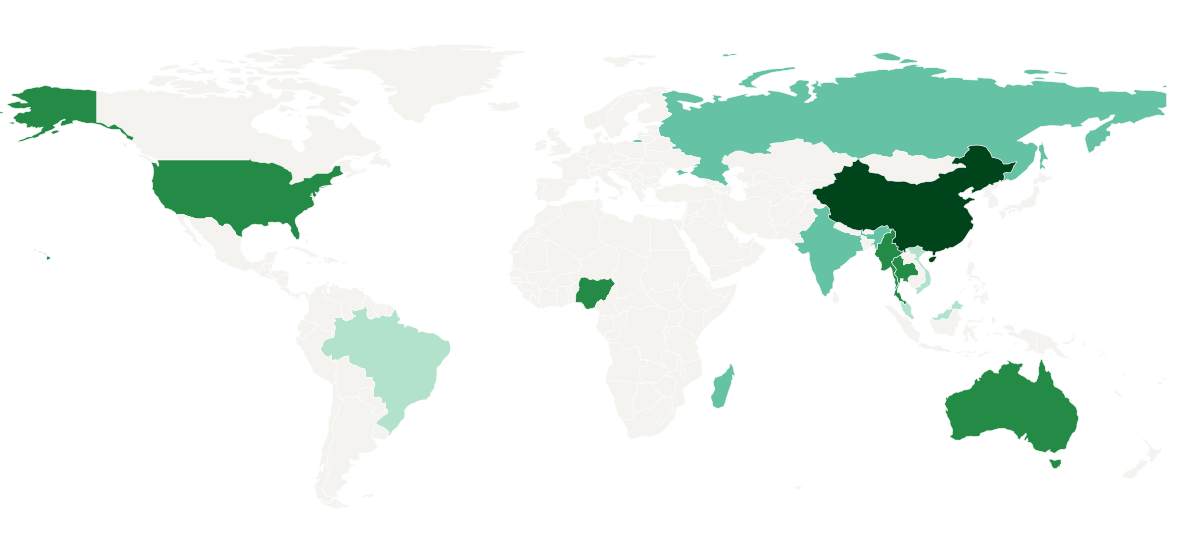
Where rare earths, the metals in permanent magnets and catalysts, are mined, and how large known reserves are.
Read the card →Source: U.S. Geological Survey, Rare Earths Statistics and Information
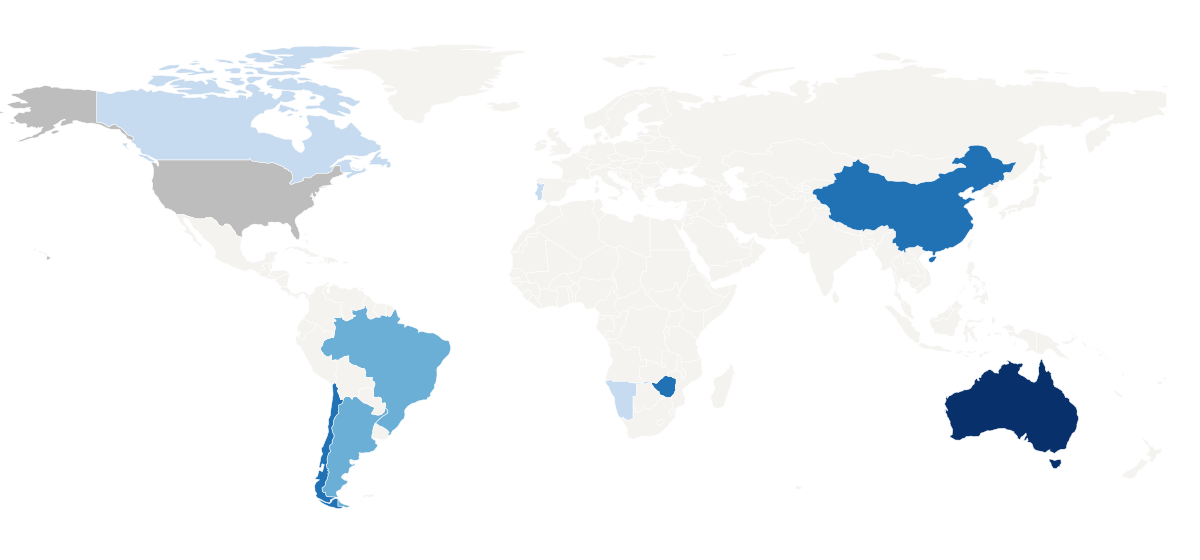
Where lithium, the light metal in rechargeable batteries, is mined, and how large known reserves are.
Read the card →Source: U.S. Geological Survey, Lithium Statistics and Information