

Subsurface
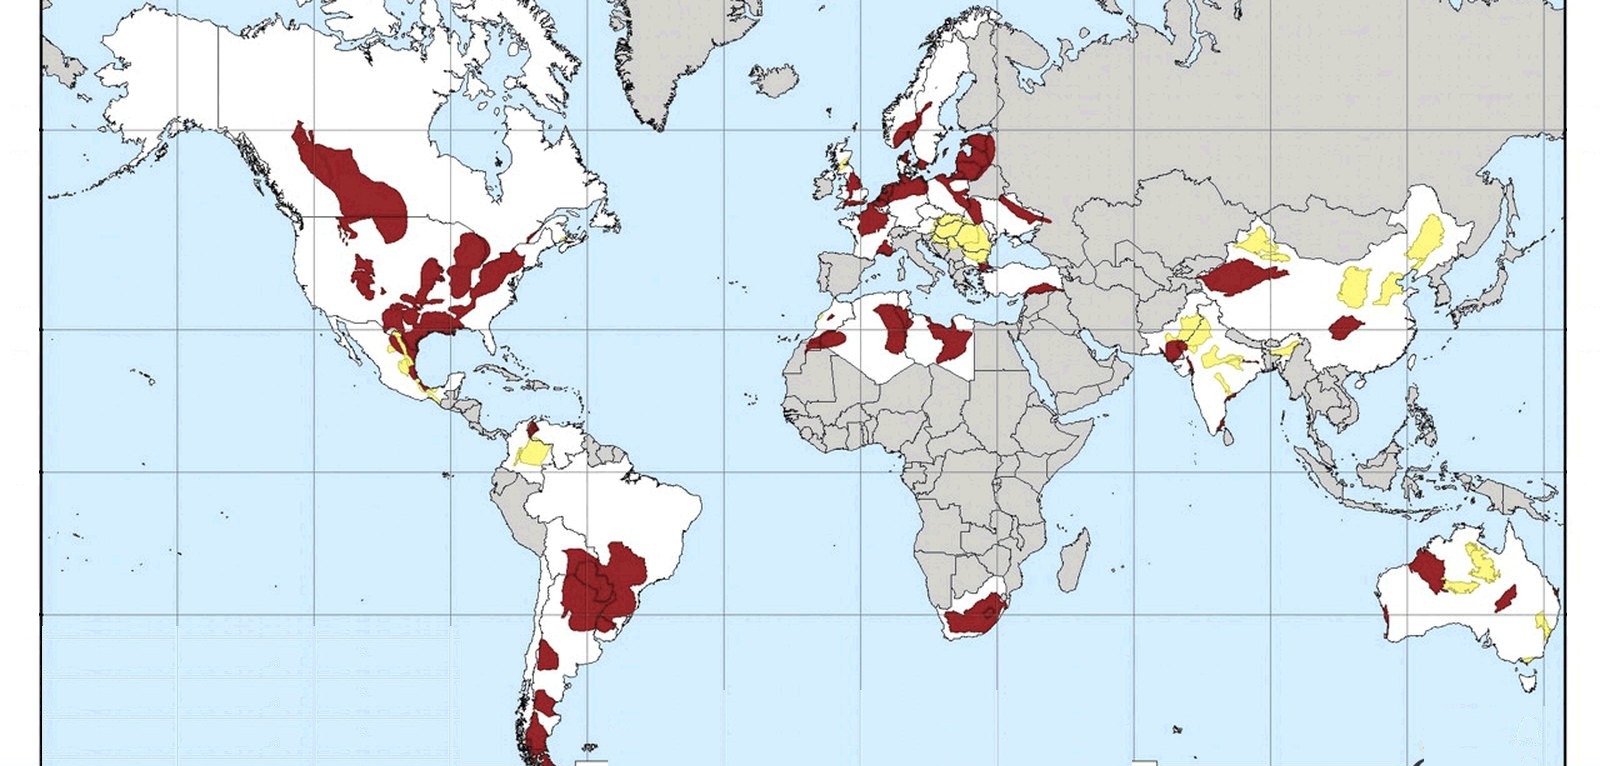
Oil and gas around the world
Petroleum and natural-gas deposits, reserves, and trade, published by the U.S. Energy Information Administration.
Read the card →Source: U.S. Energy Information Administration, international energy data
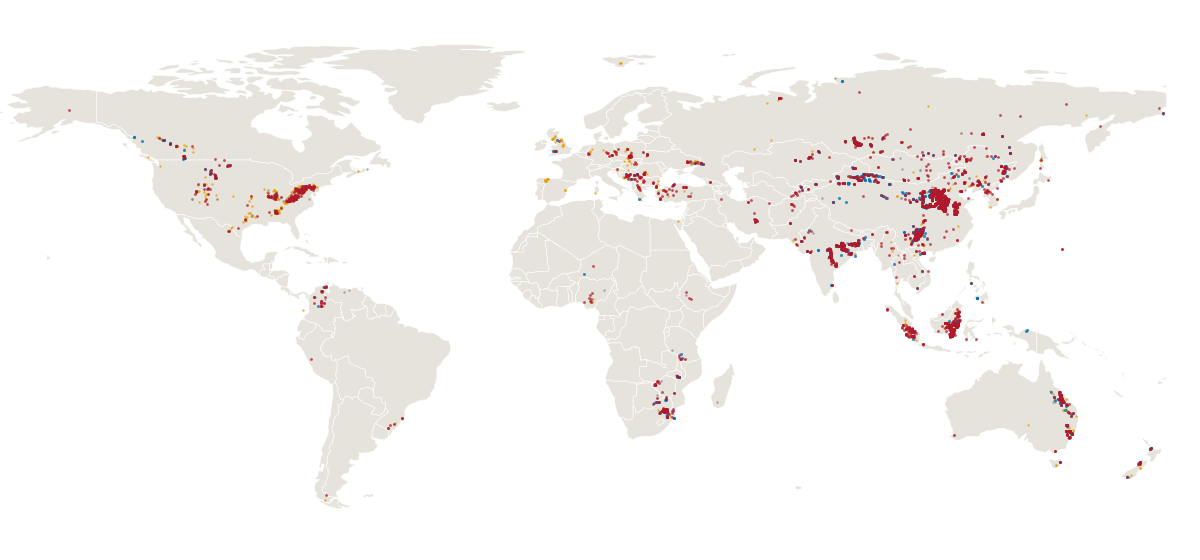
Operating, proposed and recently closed coal mines around the world, with their status, owners and output.
Map key
Coal mines around the world by status, from the August 2026 release.
Map: Fix Planet, from Global Energy Monitor, Global Coal Mine Tracker, August 2026 release, Creative Commons Attribution 4.0 International licence. Boundaries: Natural Earth, public domain.
The Global Coal Mine Tracker, published by the research group Global Energy Monitor, catalogues coal mines around the world. Its public page counts about 7,000 mines in 70 countries and about 5,300 mine owners. In the 2025 mine-level records, coal production from operating mines reached about 9.1 billion tonnes. The August 2026 release is the second version of a dataset first released in May 2026, and the data are updated in the second quarter of each year.
Coal mines lock in decades of production. Global Energy Monitor counts 835 proposed coal mines under development, with a combined capacity of 2,521 million tonnes per year, about 11% more than in 2024. Of that capacity, 781 million tonnes per year is already under construction or in trial operation. Proposed mines alone could release 16.8 million tonnes of methane a year, on top of the carbon dioxide released when the coal is burned.
Each dot is a mine, coloured by status: operating, proposed, shelved or mothballed, and closed or cancelled. It lists operating, inactive and proposed mines that can produce 1 million tonnes per year or more, plus mines closed since 2015; in China the threshold is 0.45 million tonnes per year. China, India, Australia, Russia and South Africa hold over 90% of proposed capacity, and China alone accounts for 1,321 million tonnes per year, more than the rest of the world combined. Thermal coal for power stations makes up around 70% of proposed capacity; most of the rest is coal for steelmaking.
Small mines appear only where the research team has had time to add them. Production figures are for saleable coal where possible, and where recent production is unknown the mine’s capacity is used instead. When a mine’s exact location is unknown, the dot sits at the closest approximate location. A proposed mine may never open.
Map: Fix Planet, from Global Energy Monitor, Global Coal Mine Tracker, August 2026 release, Creative Commons Attribution 4.0 International licence. Boundaries: Natural Earth, public domain.
Open source map → Petroleum and natural-gas deposits, reserves, and trade, published by the U.S. Energy Information Administration.
Read the card →Source: U.S. Energy Information Administration, international energy data
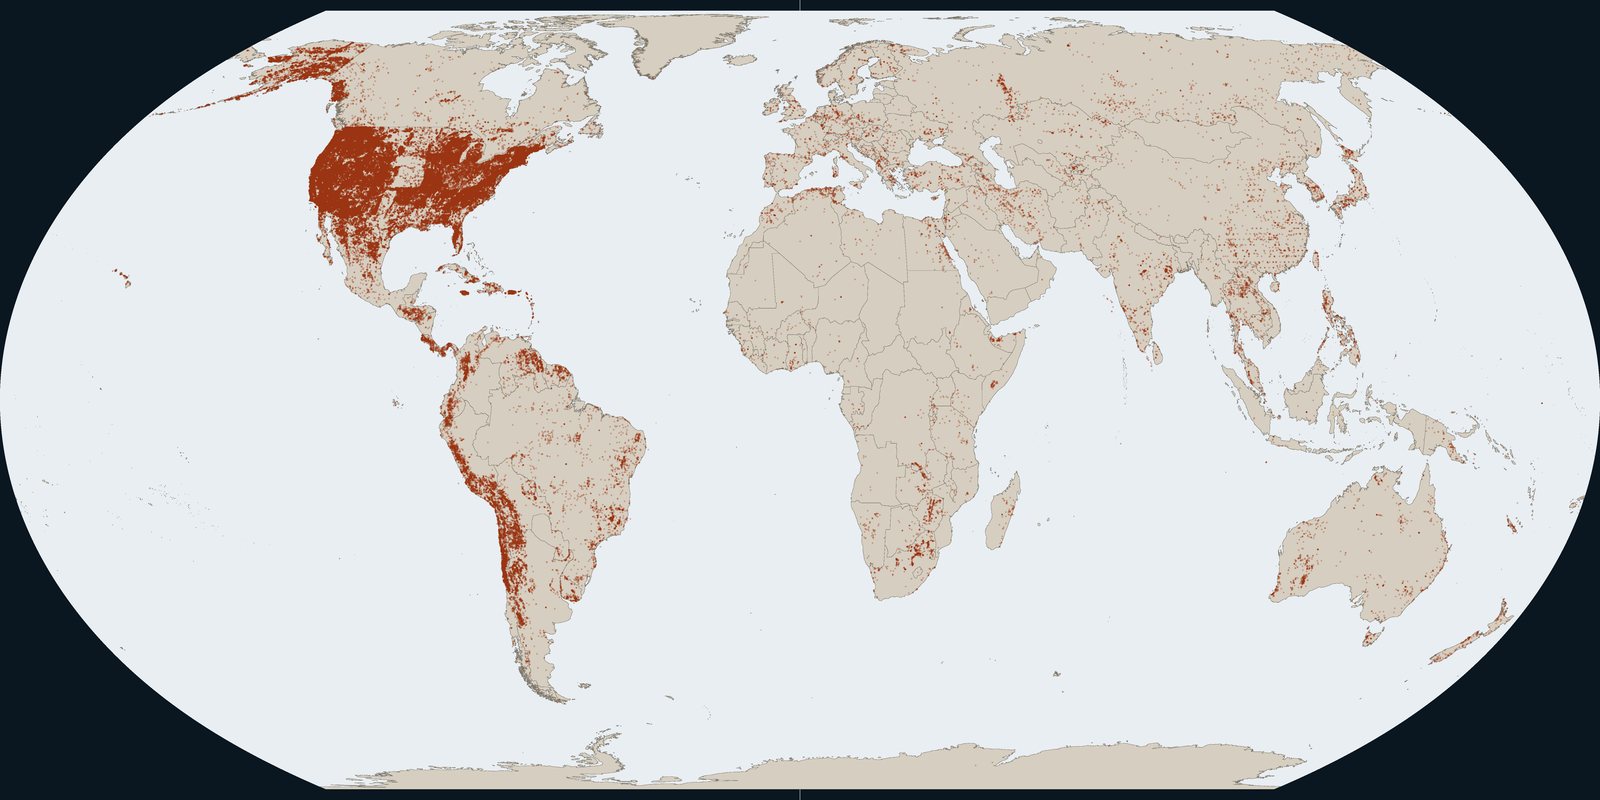
Known deposits of metals and industrial minerals, including gold, from the U.S. Geological Survey.
Read the card →Source: U.S. Geological Survey, Mineral Resources Data System
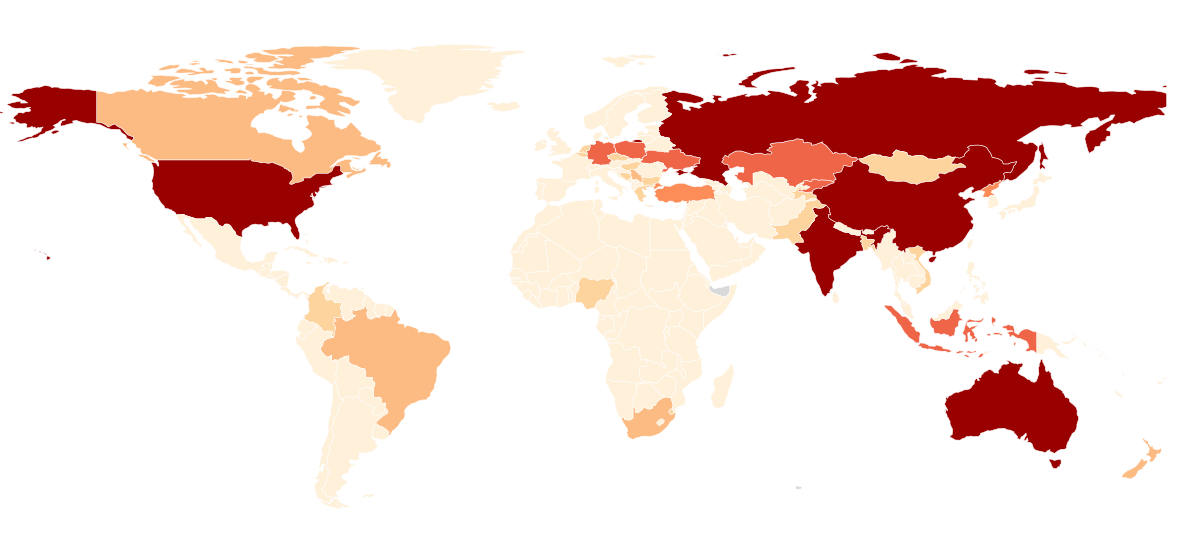
How much coal each country reports as proved reserves, the coal that known deposits can yield at today’s prices and with today’s technology.
Read the card →Source: U.S. Energy Information Administration, via Our World in Data
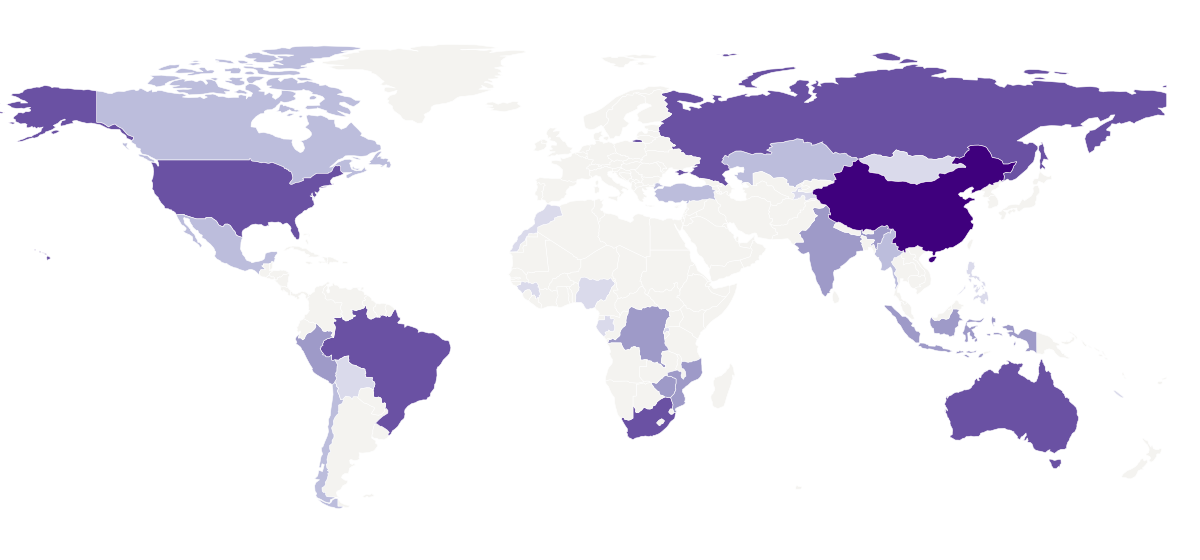
The countries that produced at least 5% of world output of key minerals in 2023, at the mine and at the refinery.
Read the card →Source: U.S. Geological Survey, Global Maps of Critical Mineral Production in 2023
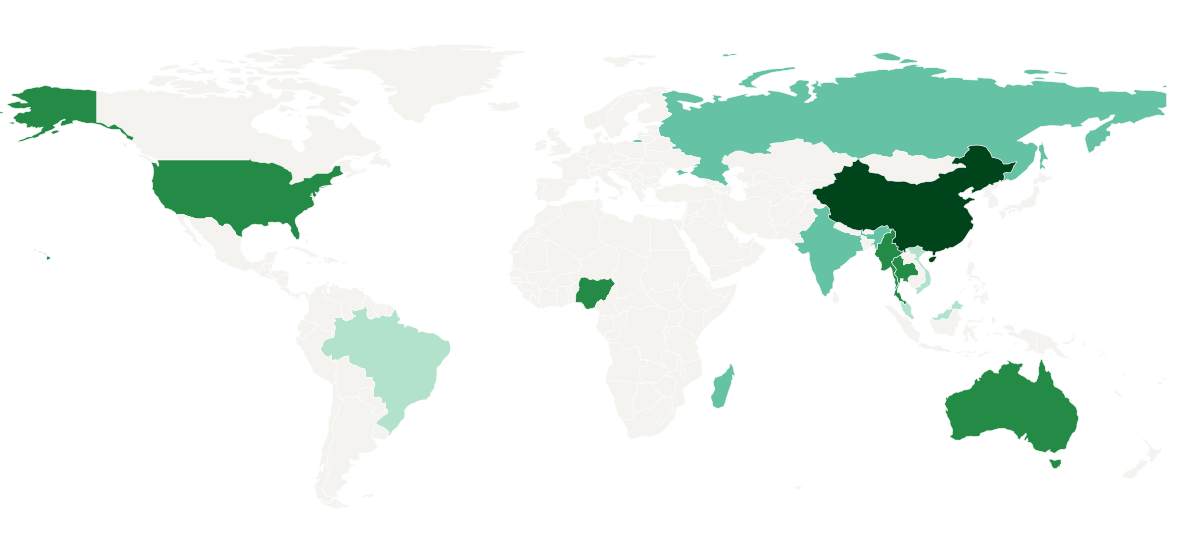
Where rare earths, the metals in permanent magnets and catalysts, are mined, and how large known reserves are.
Read the card →Source: U.S. Geological Survey, Rare Earths Statistics and Information
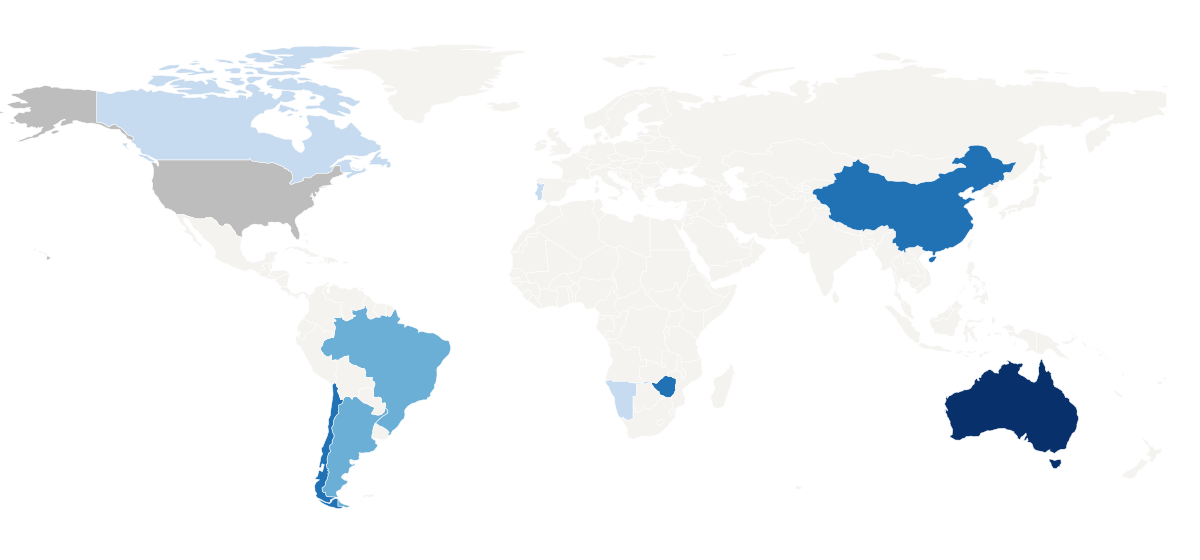
Where lithium, the light metal in rechargeable batteries, is mined, and how large known reserves are.
Read the card →Source: U.S. Geological Survey, Lithium Statistics and Information