

Subsurface
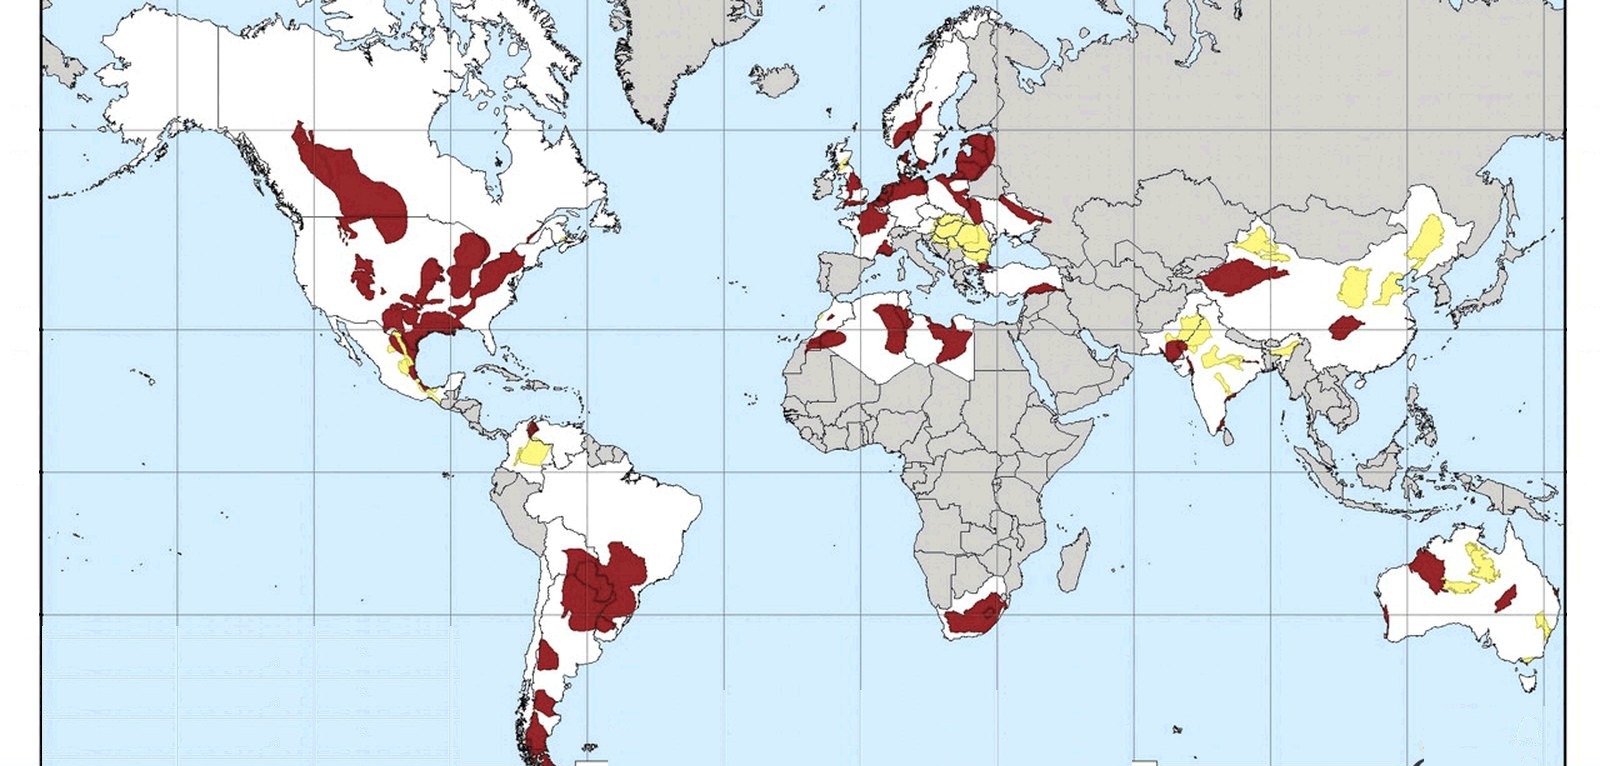
Oil and gas around the world
Petroleum and natural-gas deposits, reserves, and trade, published by the U.S. Energy Information Administration.
Read the card →Source: U.S. Energy Information Administration, international energy data
Where lithium, the light metal in rechargeable batteries, is mined, and how large known reserves are.
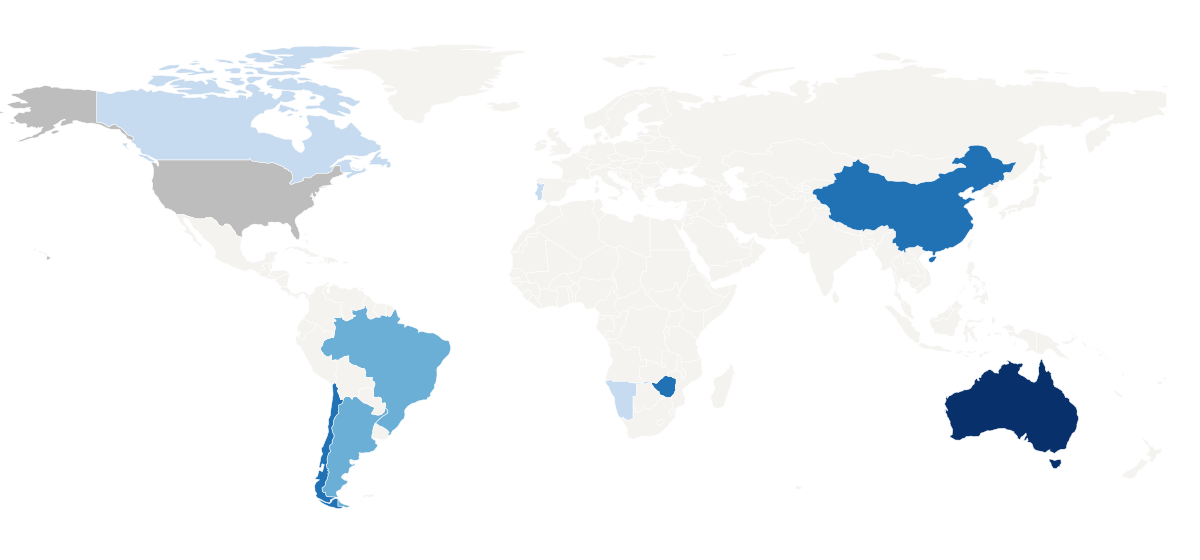
Mine production in 2024, tonnes of lithium content
Estimated lithium mine production by country, 2024.
Map: Fix Planet, from U.S. Geological Survey, Mineral Commodity Summaries 2025 data release, public domain. Boundaries: Natural Earth, public domain.
The lithium chapter of Mineral Commodity Summaries 2025, the yearbook of the U.S. Geological Survey, estimates that world lithium production, excluding the United States, rose by 18% to about 240,000 tonnes of lithium content in 2024, from 204,000 tonnes in 2023. World reserves are about 30 million tonnes, and measured and indicated resources total about 115 million tonnes.
Batteries took an estimated 87% of lithium use worldwide, for electric vehicles, portable electronics, power tools and grid storage. World consumption in 2024 was estimated at 220,000 tonnes, 29% more than in 2023.
The map shows estimated mine production in 2024, in tonnes of lithium content. The darker the colour, the larger the output. Australia led with about 88,000 tonnes, followed by Chile (49,000), China (41,000), Zimbabwe (22,000) and Argentina (18,000). United States production is withheld to protect company data. Chile holds the largest reserves, 9.3 million tonnes.
Prices swing widely. After high prices from 2021 to early 2023, the average United States price for lithium carbonate on fixed contracts fell to $14,000 per tonne in 2024, 66% lower than in 2023. Resource estimates keep growing as exploration continues, and reserve figures are revised from company and government reports.
Map: Fix Planet, from U.S. Geological Survey, Mineral Commodity Summaries 2025 data release, public domain. Boundaries: Natural Earth, public domain.
Open source map → Petroleum and natural-gas deposits, reserves, and trade, published by the U.S. Energy Information Administration.
Read the card →Source: U.S. Energy Information Administration, international energy data
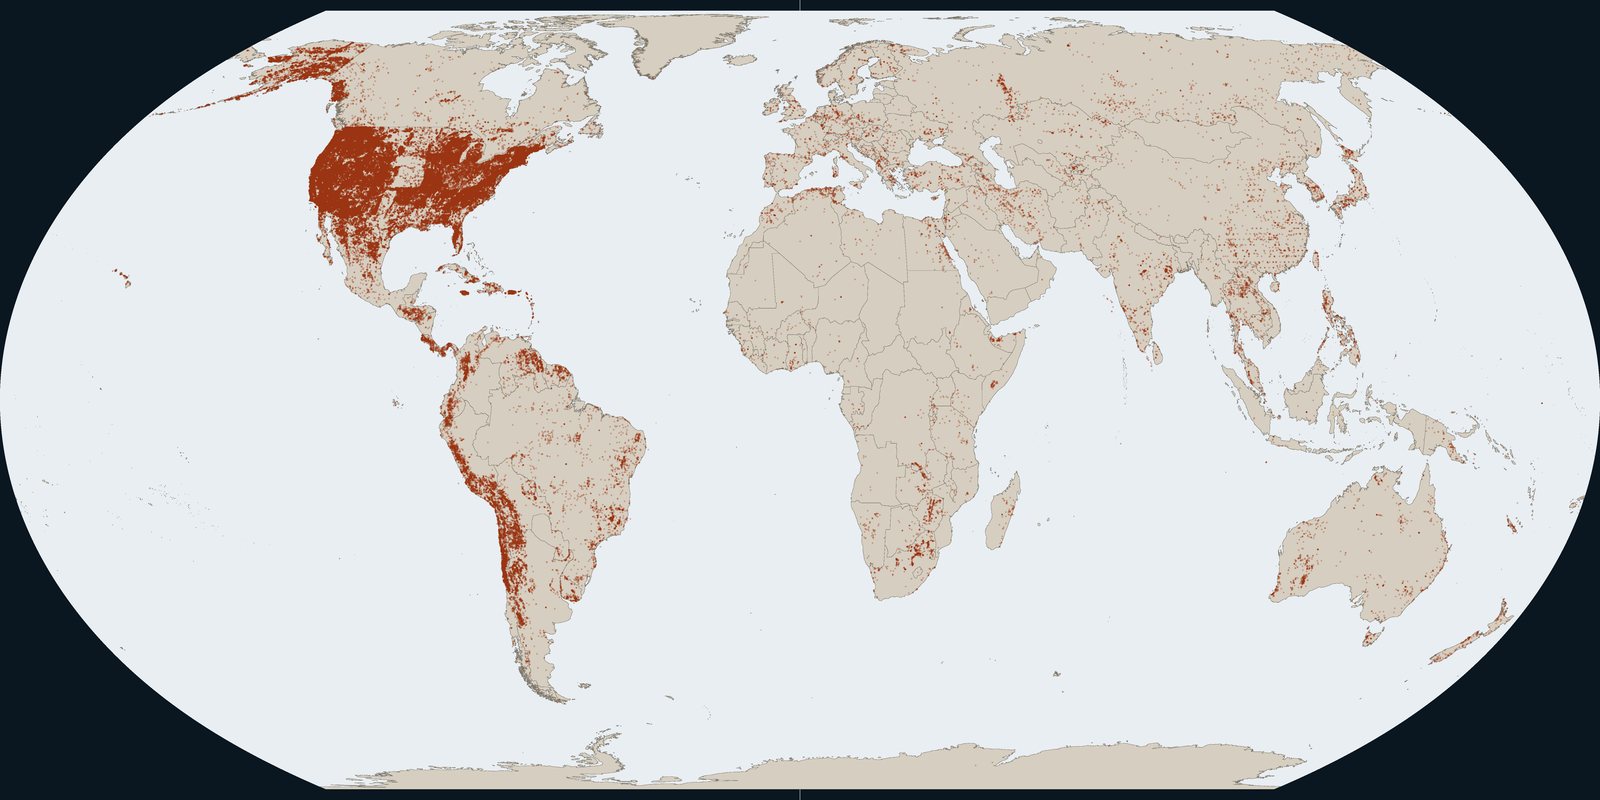
Known deposits of metals and industrial minerals, including gold, from the U.S. Geological Survey.
Read the card →Source: U.S. Geological Survey, Mineral Resources Data System
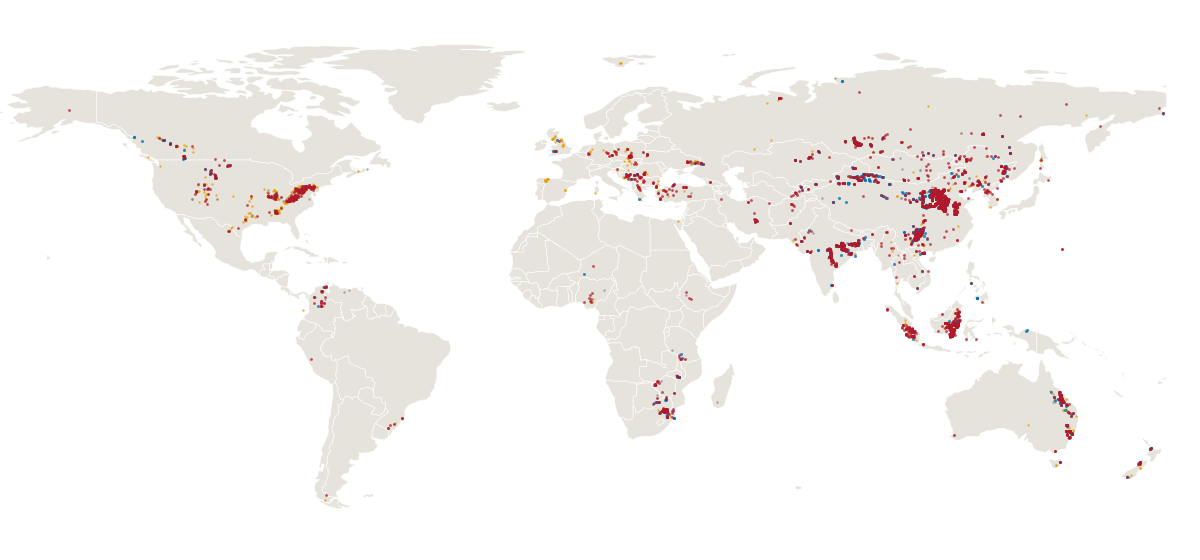
Operating, proposed and recently closed coal mines around the world, with their status, owners and output.
Read the card →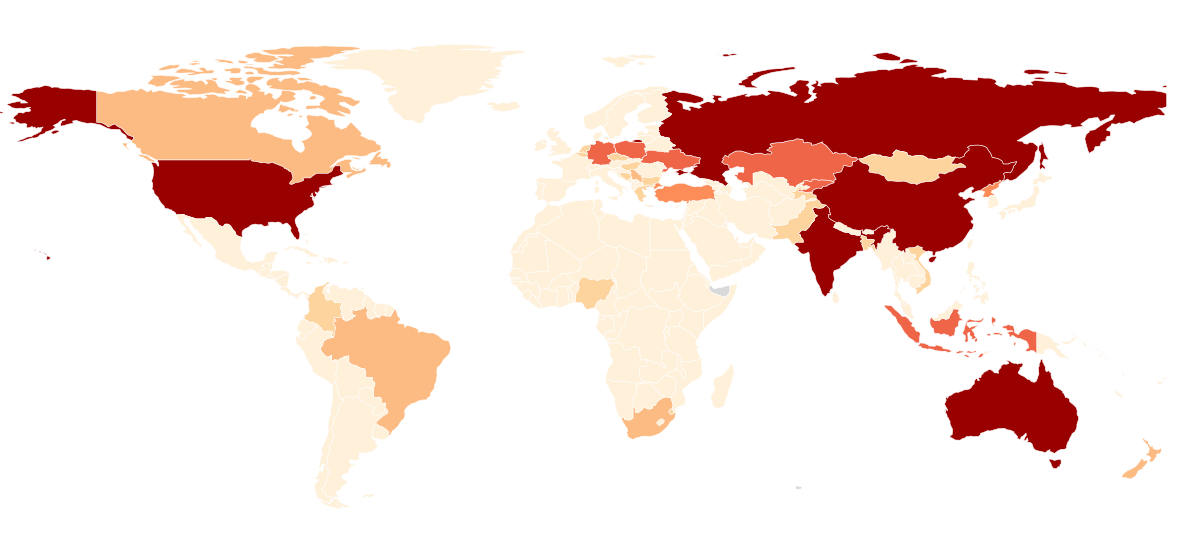
How much coal each country reports as proved reserves, the coal that known deposits can yield at today’s prices and with today’s technology.
Read the card →Source: U.S. Energy Information Administration, via Our World in Data
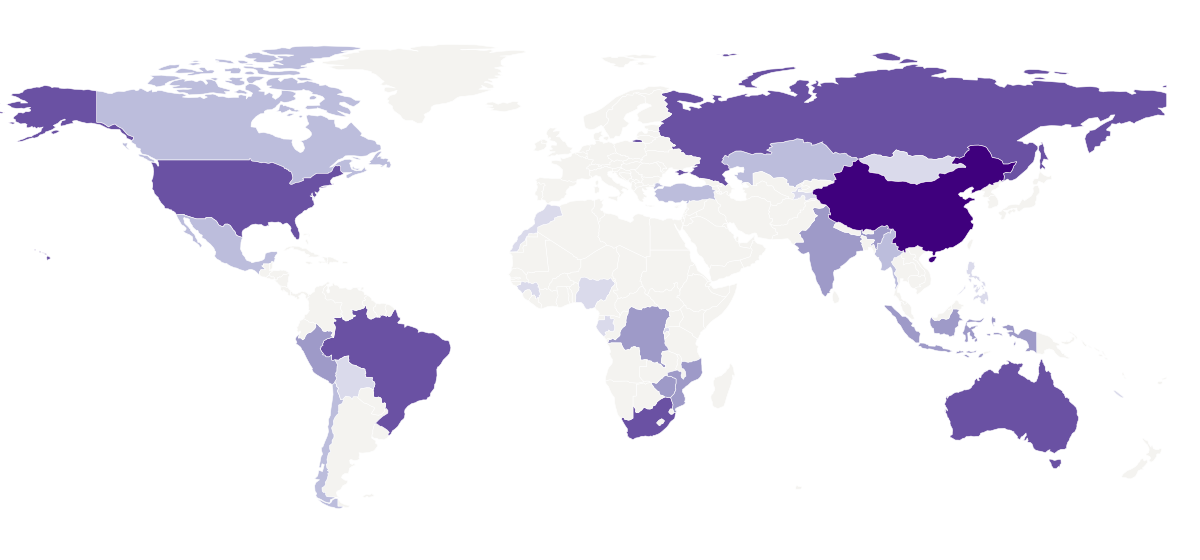
The countries that produced at least 5% of world output of key minerals in 2023, at the mine and at the refinery.
Read the card →Source: U.S. Geological Survey, Global Maps of Critical Mineral Production in 2023
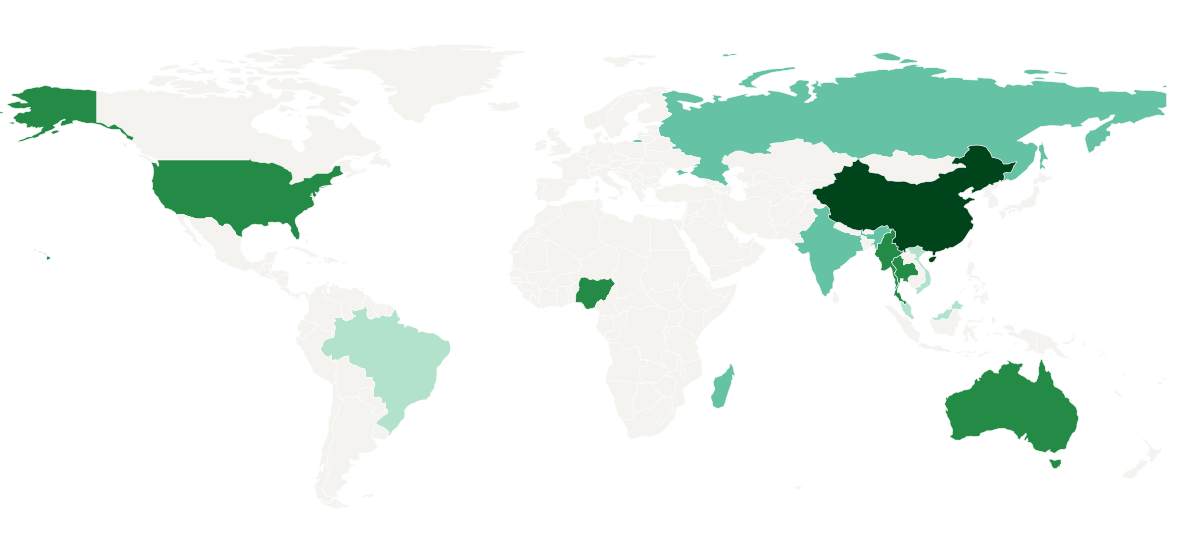
Where rare earths, the metals in permanent magnets and catalysts, are mined, and how large known reserves are.
Read the card →Source: U.S. Geological Survey, Rare Earths Statistics and Information