

Subsurface
Oil and gas around the world
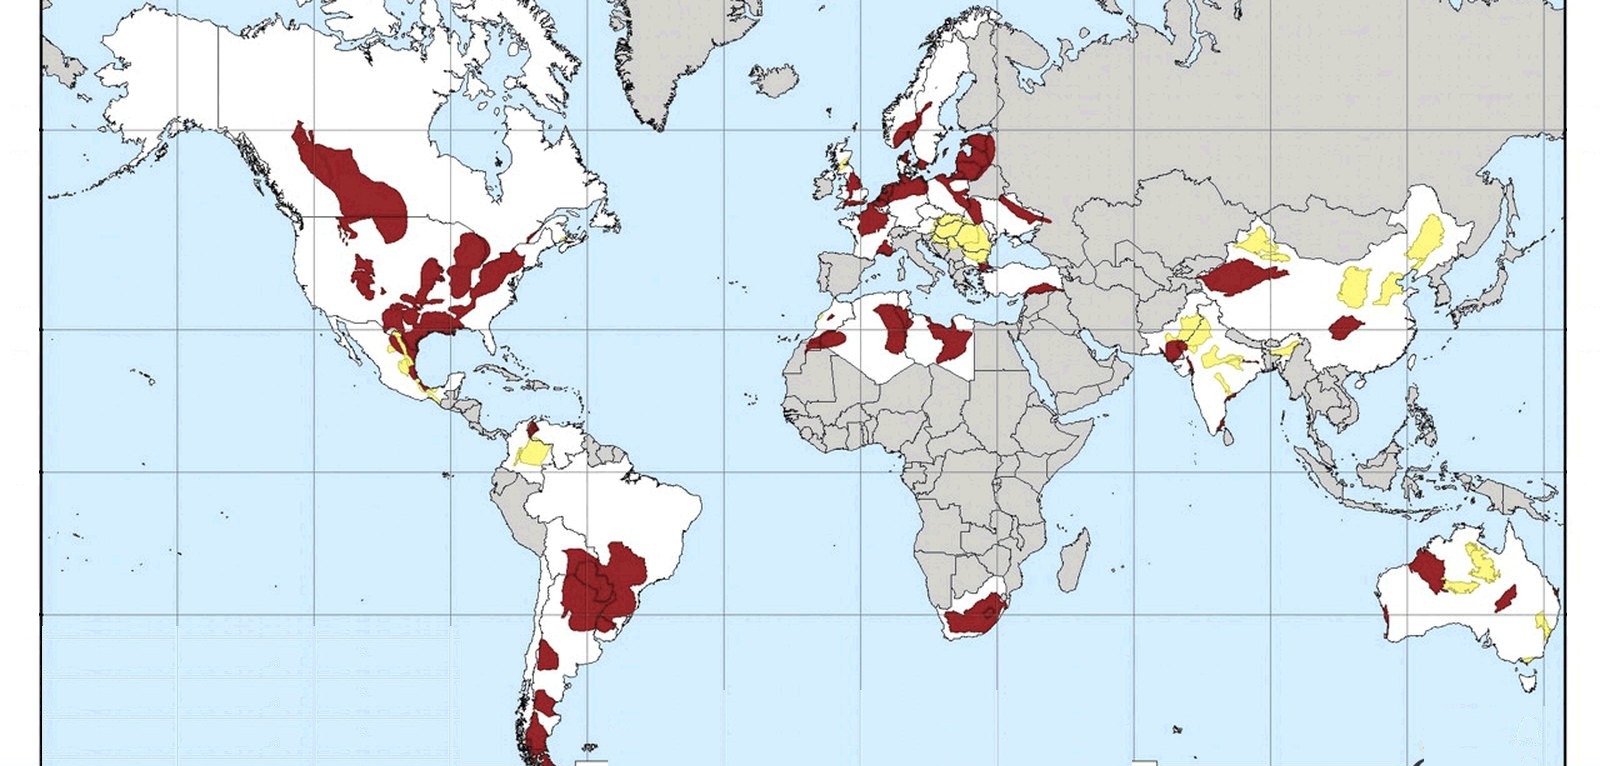
Petroleum and natural-gas deposits, reserves, and trade, published by the U.S. Energy Information Administration.
Read the card →Source: U.S. Energy Information Administration, international energy data
Where rare earths, the metals in permanent magnets and catalysts, are mined, and how large known reserves are.
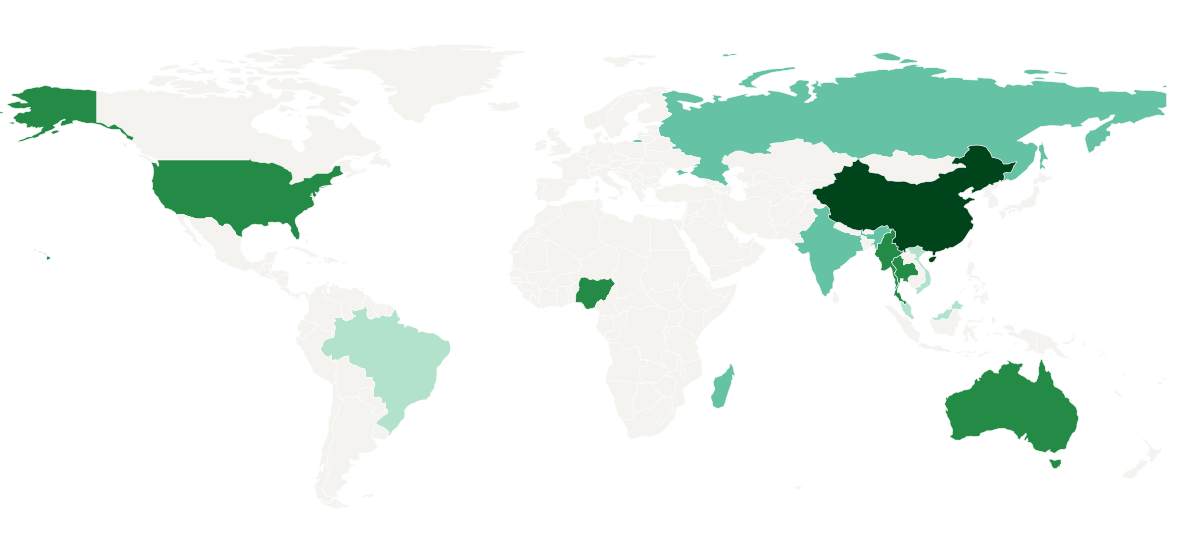
Mine production in 2024, tonnes of rare-earth oxide equivalent
Estimated rare-earth mine production by country, 2024.
Map: Fix Planet, from U.S. Geological Survey, Mineral Commodity Summaries 2025 data release, public domain. Boundaries: Natural Earth, public domain.
The rare earths chapter of Mineral Commodity Summaries 2025, the yearbook of the U.S. Geological Survey, estimates world mine production at about 376,000 tonnes of rare-earth oxide equivalent in 2023 and about 390,000 tonnes in 2024. Rare-earth oxide equivalent is the common unit for adding up the different rare-earth elements. World reserves are more than 90 million tonnes. The count covers the lanthanides and yttrium and leaves out most scandium.
Rare earths go into permanent magnets, catalysts, ceramics and glass, alloys and polishing powders. China’s production quota rose from 255,000 to 270,000 tonnes, about 69% of the world total in 2024, and China also holds the largest reserves, 44 million tonnes. The United States produced about 45,000 tonnes in mineral concentrates in 2024, yet relied on net imports for about 80% of the rare-earth compounds and metals it used. From 2020 to 2023, 70% of those imports came from China, 13% from Malaysia, 6% from Japan and 5% from Estonia.
The map shows estimated mine production in 2024, in tonnes of rare-earth oxide equivalent. The darker the colour, the larger the output. After China, the largest producers were the United States, Burma (31,000 tonnes), and Australia, Nigeria and Thailand (13,000 tonnes each). Brazil holds the second-largest reserves, 21 million tonnes, but mined only 20 tonnes in 2024.
China’s figure is its official production quota, so undocumented mining is missing. Output for Australia, Burma, Madagascar, Malaysia, Nigeria, Thailand and Vietnam is estimated from China’s reported imports. Only limited quantities of rare earths were recovered by recycling in the United States, from batteries, permanent magnets and fluorescent lamps.
Map: Fix Planet, from U.S. Geological Survey, Mineral Commodity Summaries 2025 data release, public domain. Boundaries: Natural Earth, public domain.
Open source map → Petroleum and natural-gas deposits, reserves, and trade, published by the U.S. Energy Information Administration.
Read the card →Source: U.S. Energy Information Administration, international energy data
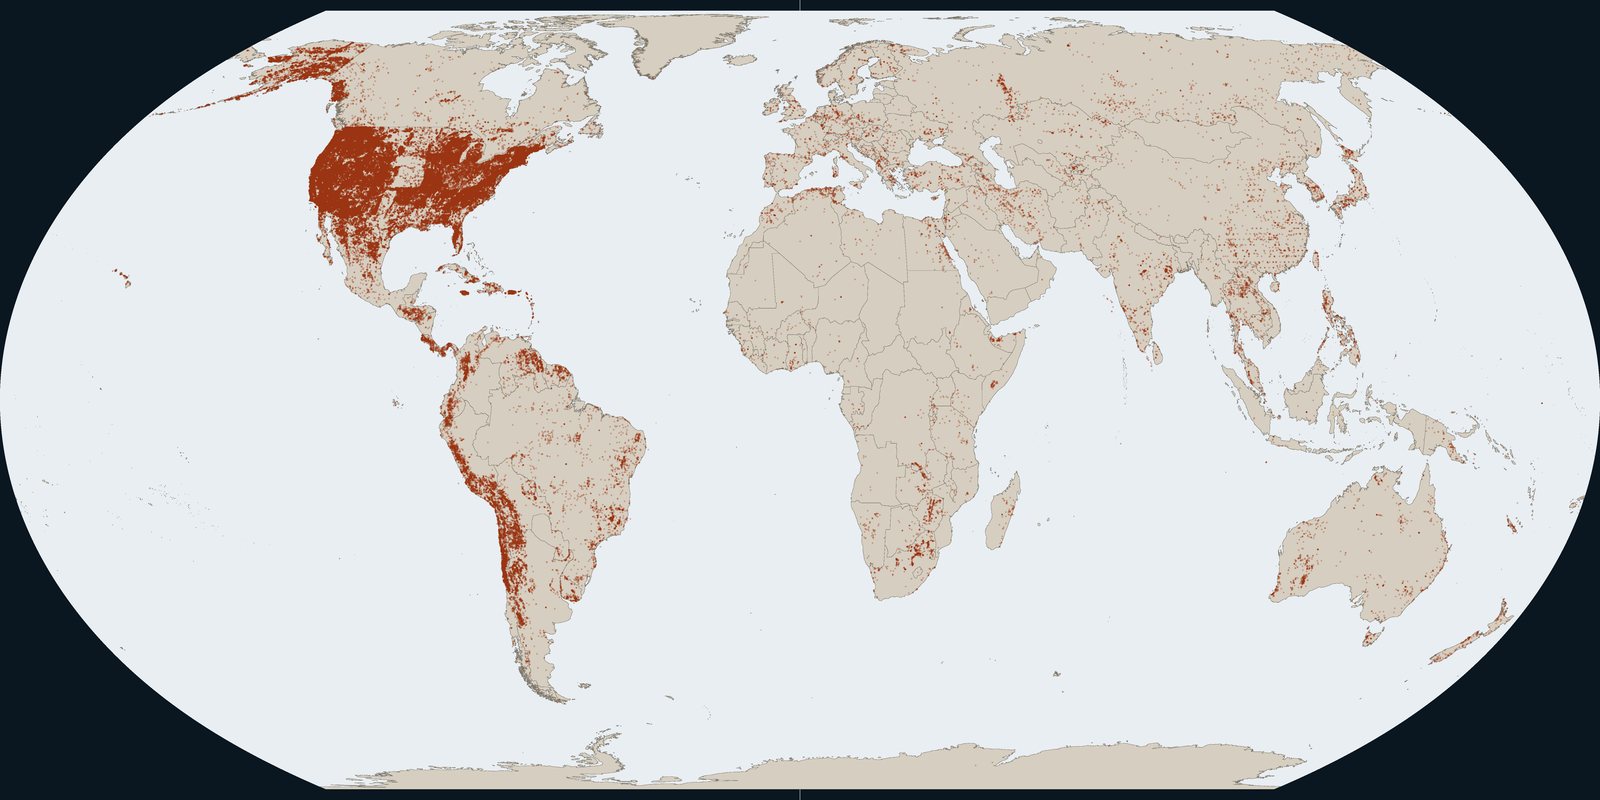
Known deposits of metals and industrial minerals, including gold, from the U.S. Geological Survey.
Read the card →Source: U.S. Geological Survey, Mineral Resources Data System
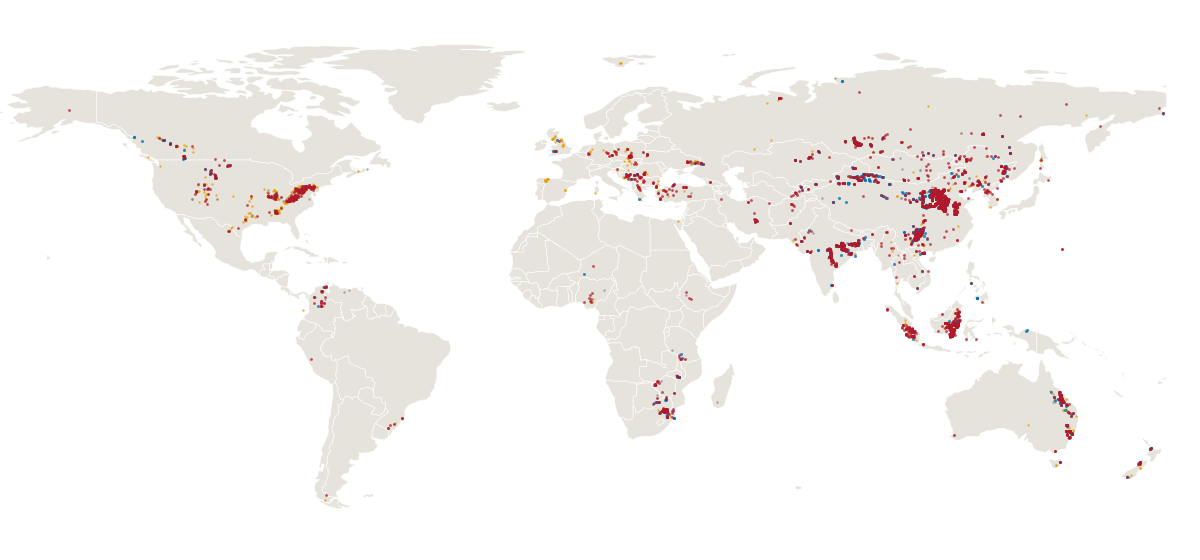
Operating, proposed and recently closed coal mines around the world, with their status, owners and output.
Read the card →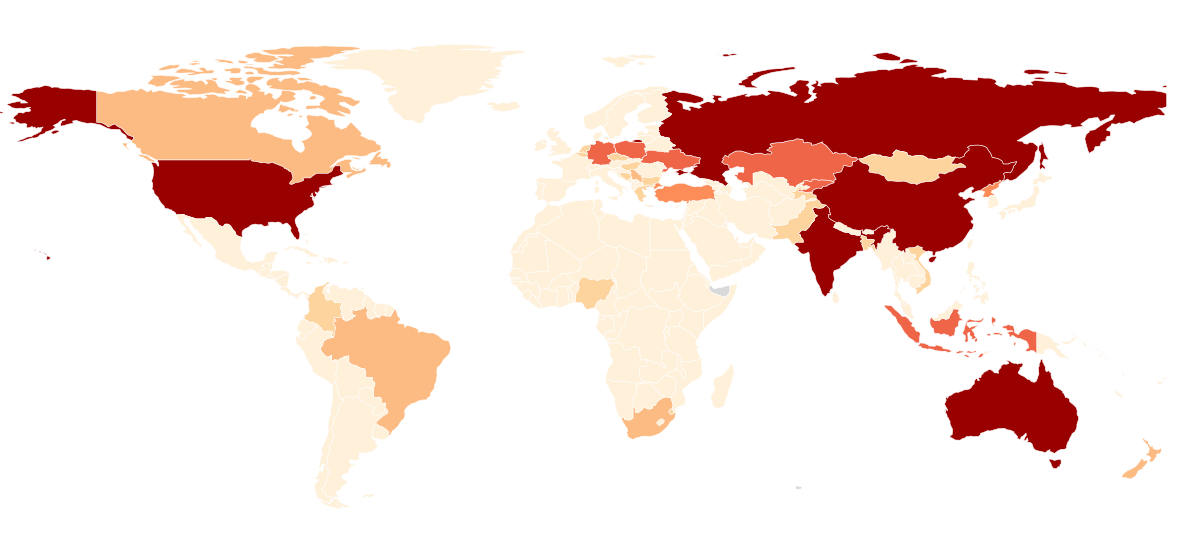
How much coal each country reports as proved reserves, the coal that known deposits can yield at today’s prices and with today’s technology.
Read the card →Source: U.S. Energy Information Administration, via Our World in Data
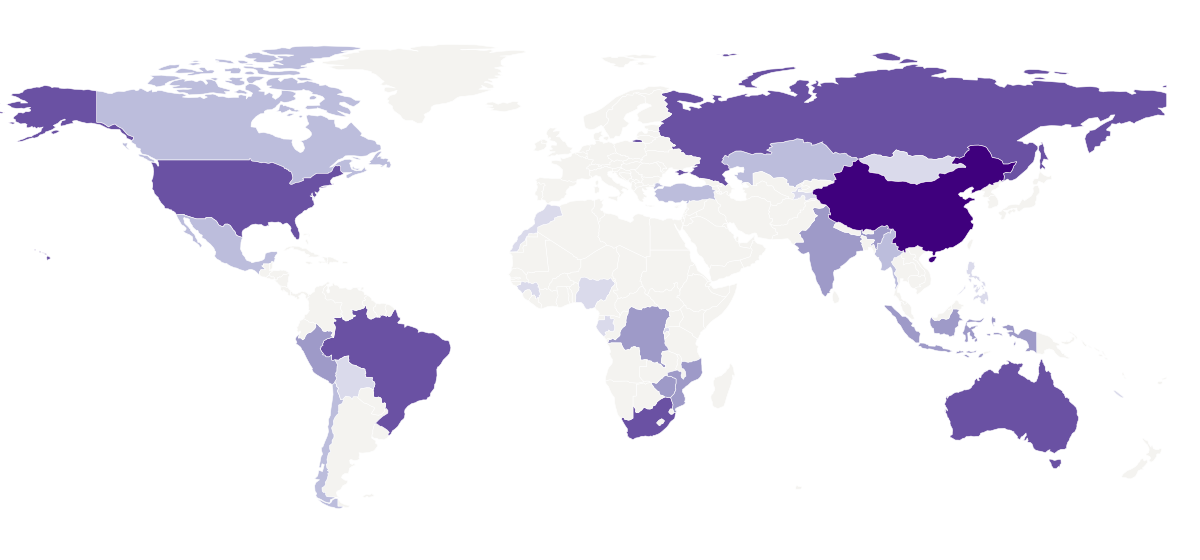
The countries that produced at least 5% of world output of key minerals in 2023, at the mine and at the refinery.
Read the card →Source: U.S. Geological Survey, Global Maps of Critical Mineral Production in 2023
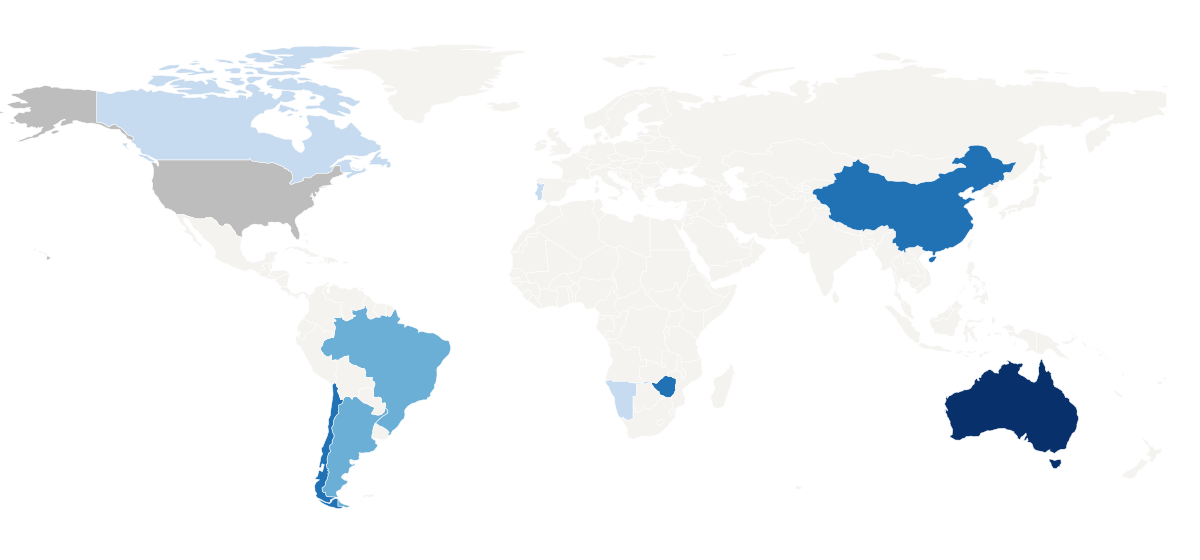
Where lithium, the light metal in rechargeable batteries, is mined, and how large known reserves are.
Read the card →Source: U.S. Geological Survey, Lithium Statistics and Information