

Subsurface
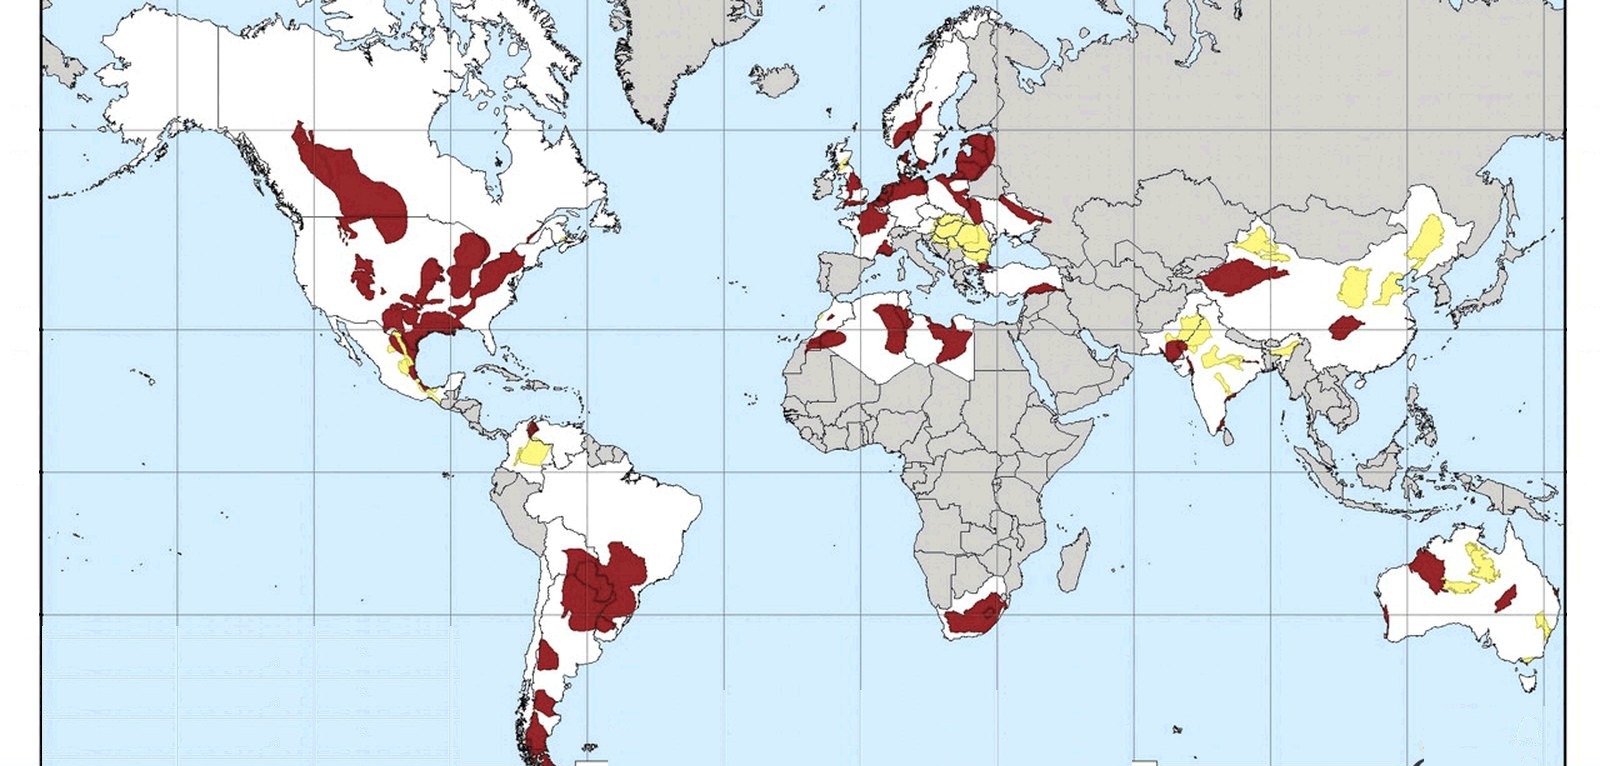
Oil and gas around the world
Petroleum and natural-gas deposits, reserves, and trade, published by the U.S. Energy Information Administration.
Read the card →Source: U.S. Energy Information Administration, international energy data
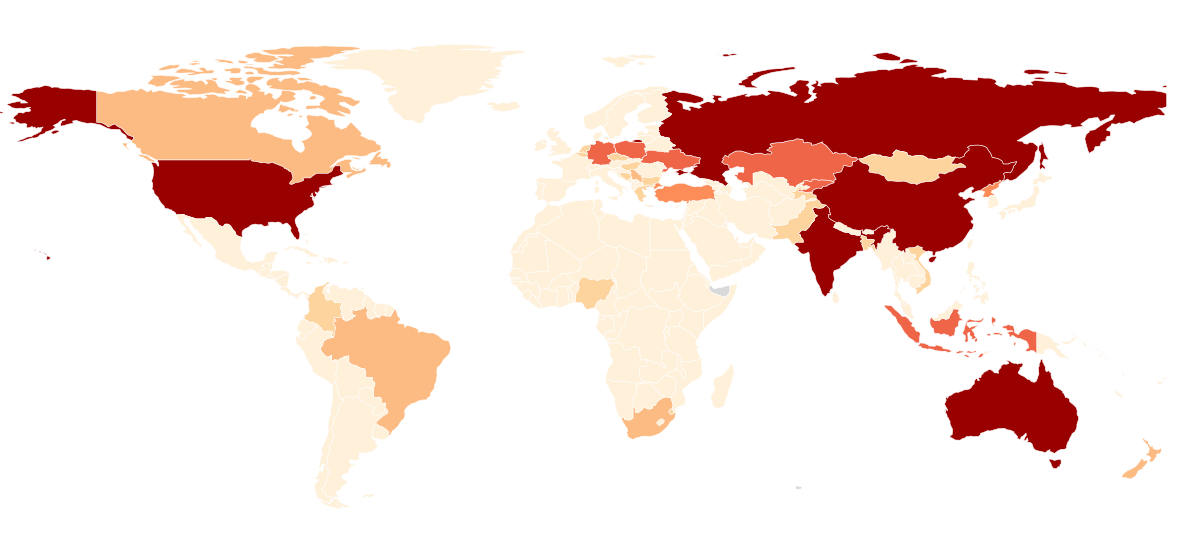
How much coal each country reports as proved reserves, the coal that known deposits can yield at today’s prices and with today’s technology.
Proved coal reserves
Proved coal reserves by country, 2023.
Map: Fix Planet, from U.S. Energy Information Administration data, public domain, via Our World in Data, Creative Commons Attribution 4.0 International licence. Boundaries: Natural Earth, public domain.
The U.S. Energy Information Administration, the statistics agency of the United States Department of Energy, publishes international energy data, including each country’s proved coal reserves in tonnes. Our World in Data republishes the series for 2008-2023, last updated on 30 June 2026. Proved reserves are the quantities that geological and engineering information shows can be recovered in the future from known deposits under existing economic and operating conditions.
Reserves show how much coal a country could still mine and burn. In 2023 the largest proved reserves were in the United States (about 248 billion tonnes), Russia (about 162 billion), China (about 157 billion), Australia (about 150 billion) and India (about 128 billion). Together these five held about 72% of the world total of about 1,166 billion tonnes.
Each country is shaded by its proved coal reserves in the latest year available, in tonnes. The darker the colour, the larger the reserves. Countries that report no reserves share the lightest shade.
Countries report their own estimates, so quality and how often they are revised vary. Reserve figures change when prices, mining technology or national reporting change. Coal resources, which also count deposits that would cost too much to mine today, are larger than proved reserves.
Map: Fix Planet, from U.S. Energy Information Administration data, public domain, via Our World in Data, Creative Commons Attribution 4.0 International licence. Boundaries: Natural Earth, public domain.
Open source map → Petroleum and natural-gas deposits, reserves, and trade, published by the U.S. Energy Information Administration.
Read the card →Source: U.S. Energy Information Administration, international energy data
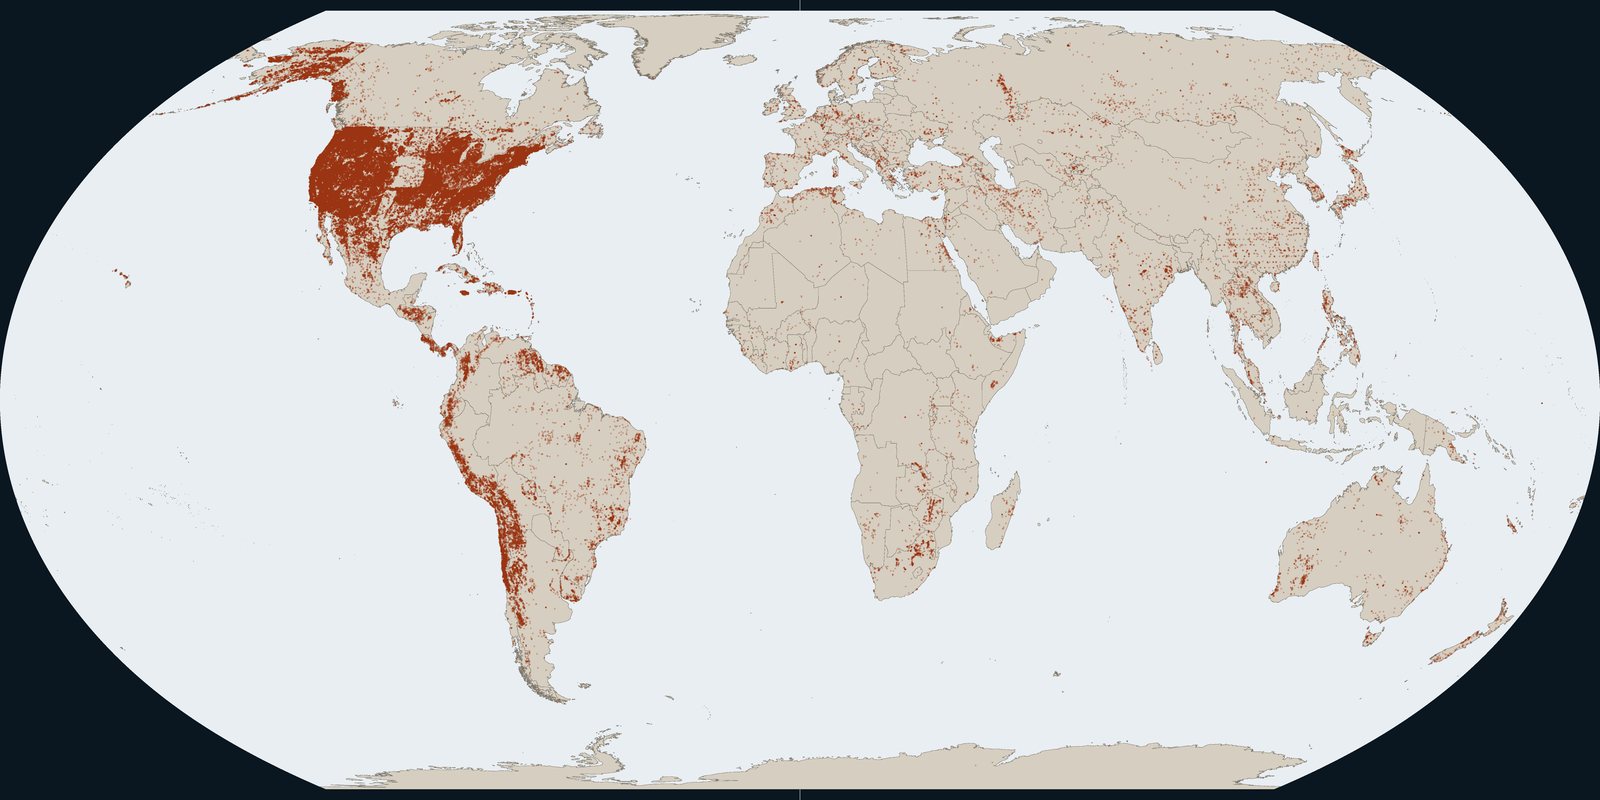
Known deposits of metals and industrial minerals, including gold, from the U.S. Geological Survey.
Read the card →Source: U.S. Geological Survey, Mineral Resources Data System
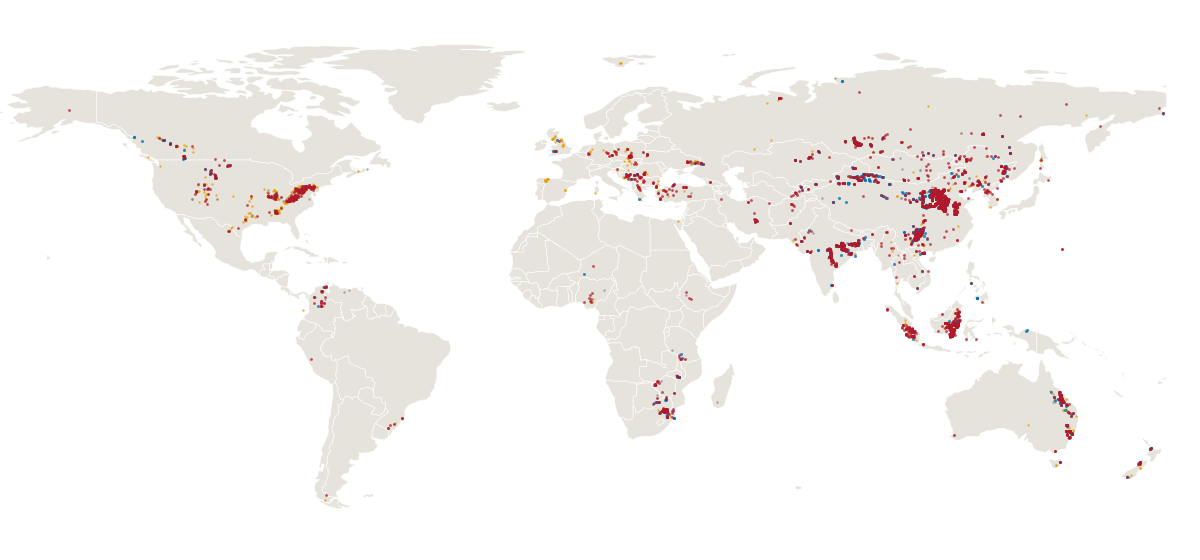
Operating, proposed and recently closed coal mines around the world, with their status, owners and output.
Read the card →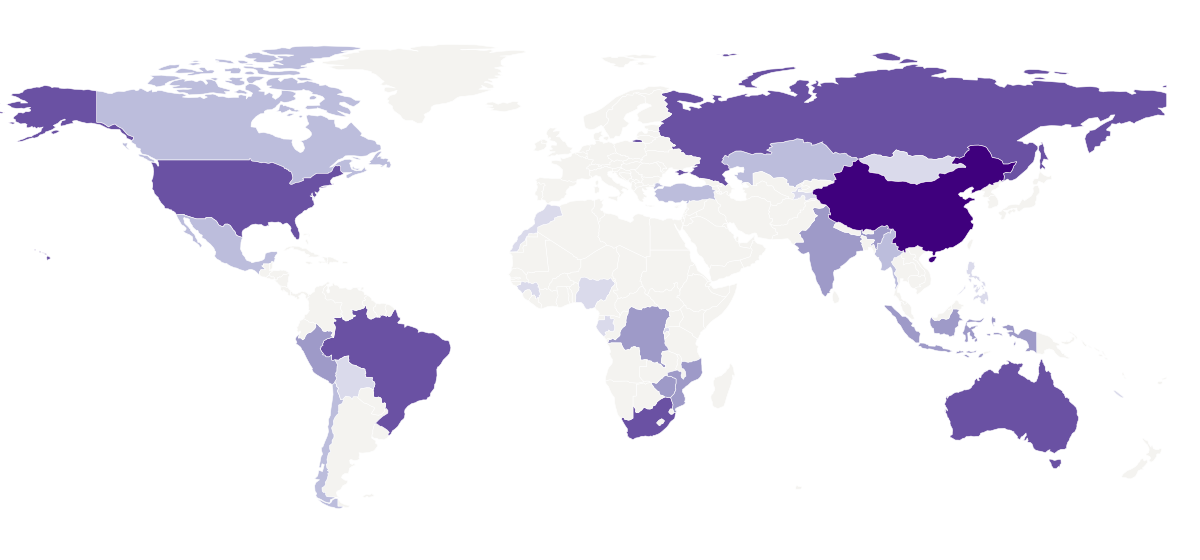
The countries that produced at least 5% of world output of key minerals in 2023, at the mine and at the refinery.
Read the card →Source: U.S. Geological Survey, Global Maps of Critical Mineral Production in 2023
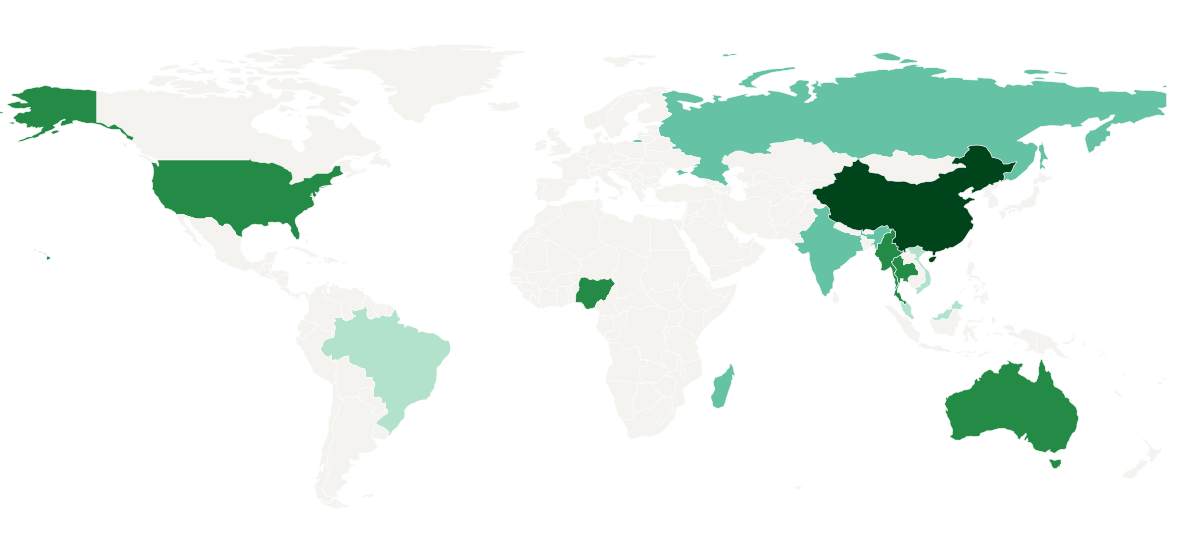
Where rare earths, the metals in permanent magnets and catalysts, are mined, and how large known reserves are.
Read the card →Source: U.S. Geological Survey, Rare Earths Statistics and Information
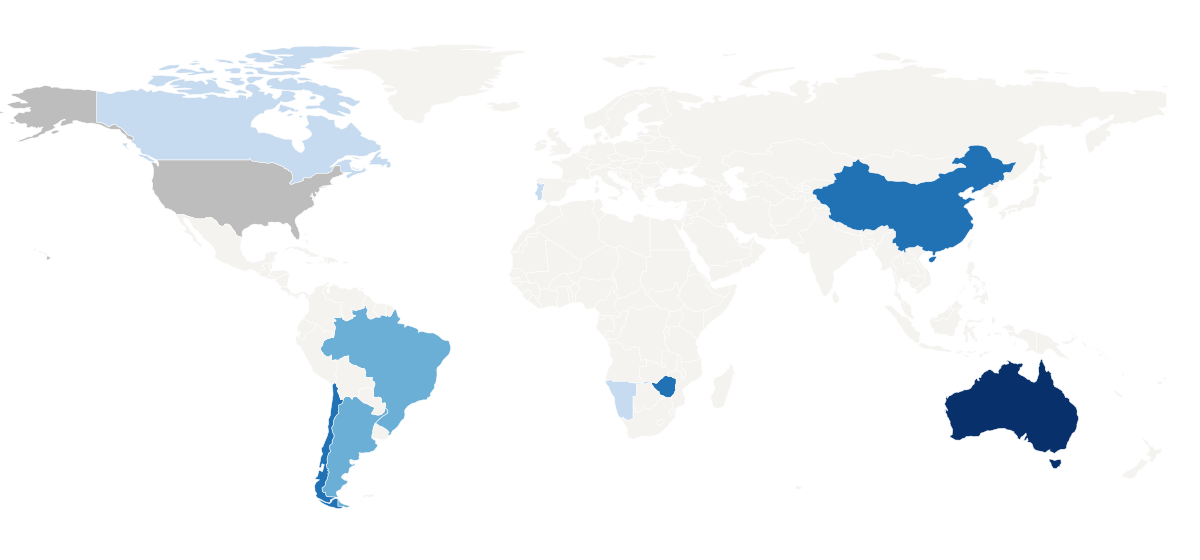
Where lithium, the light metal in rechargeable batteries, is mined, and how large known reserves are.
Read the card →Source: U.S. Geological Survey, Lithium Statistics and Information