

Water
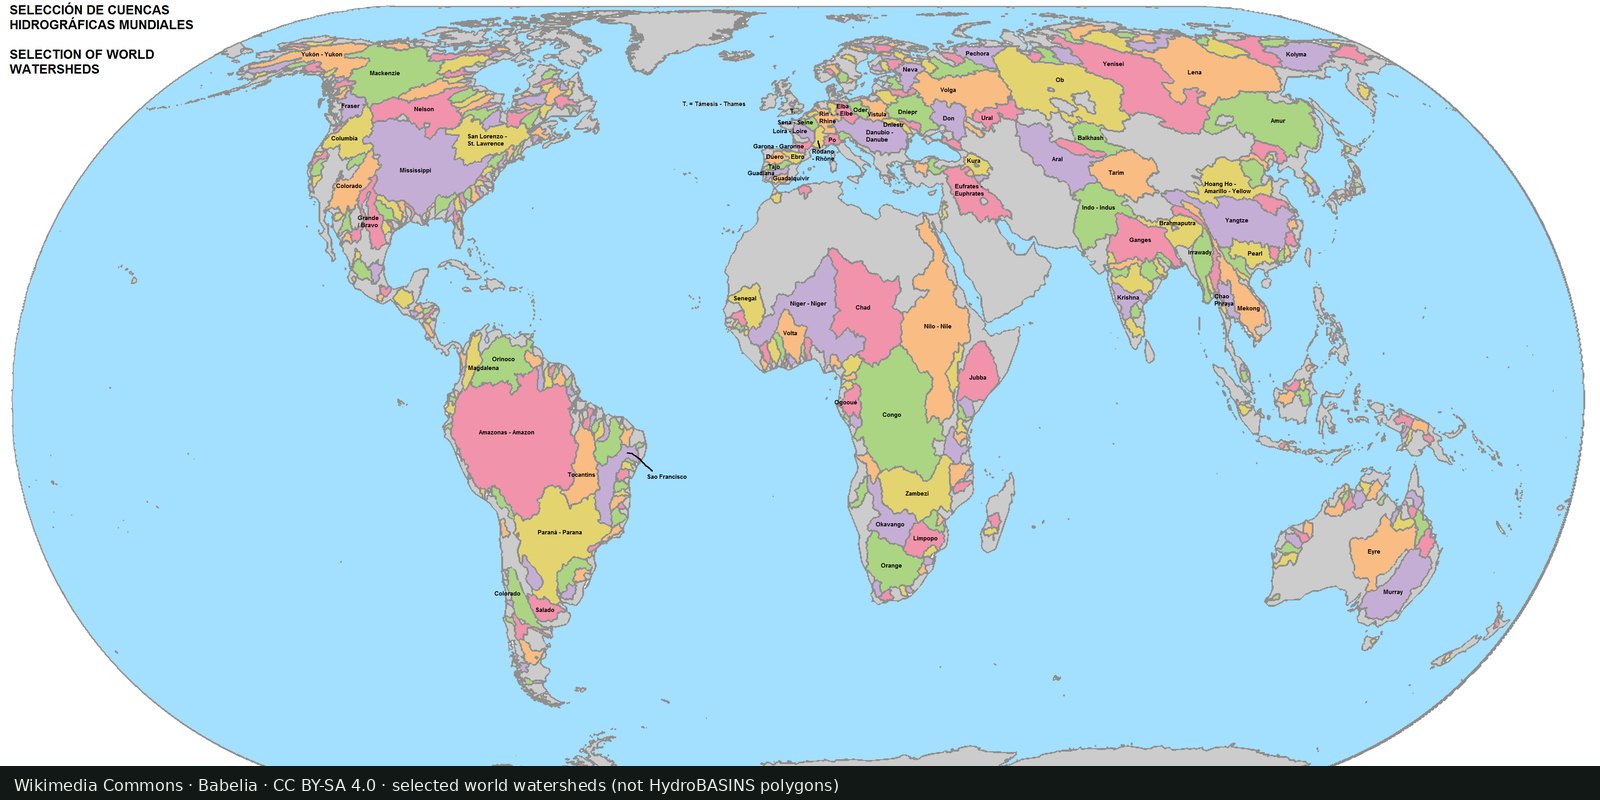
Global river basins
Nested sub-basin polygons for the whole planet (Pfafstetter levels), a hydrographic base map, not a stress index.
Read the card →WRI Aqueduct: where demand for water is high relative to available supply, a model, not a well log.
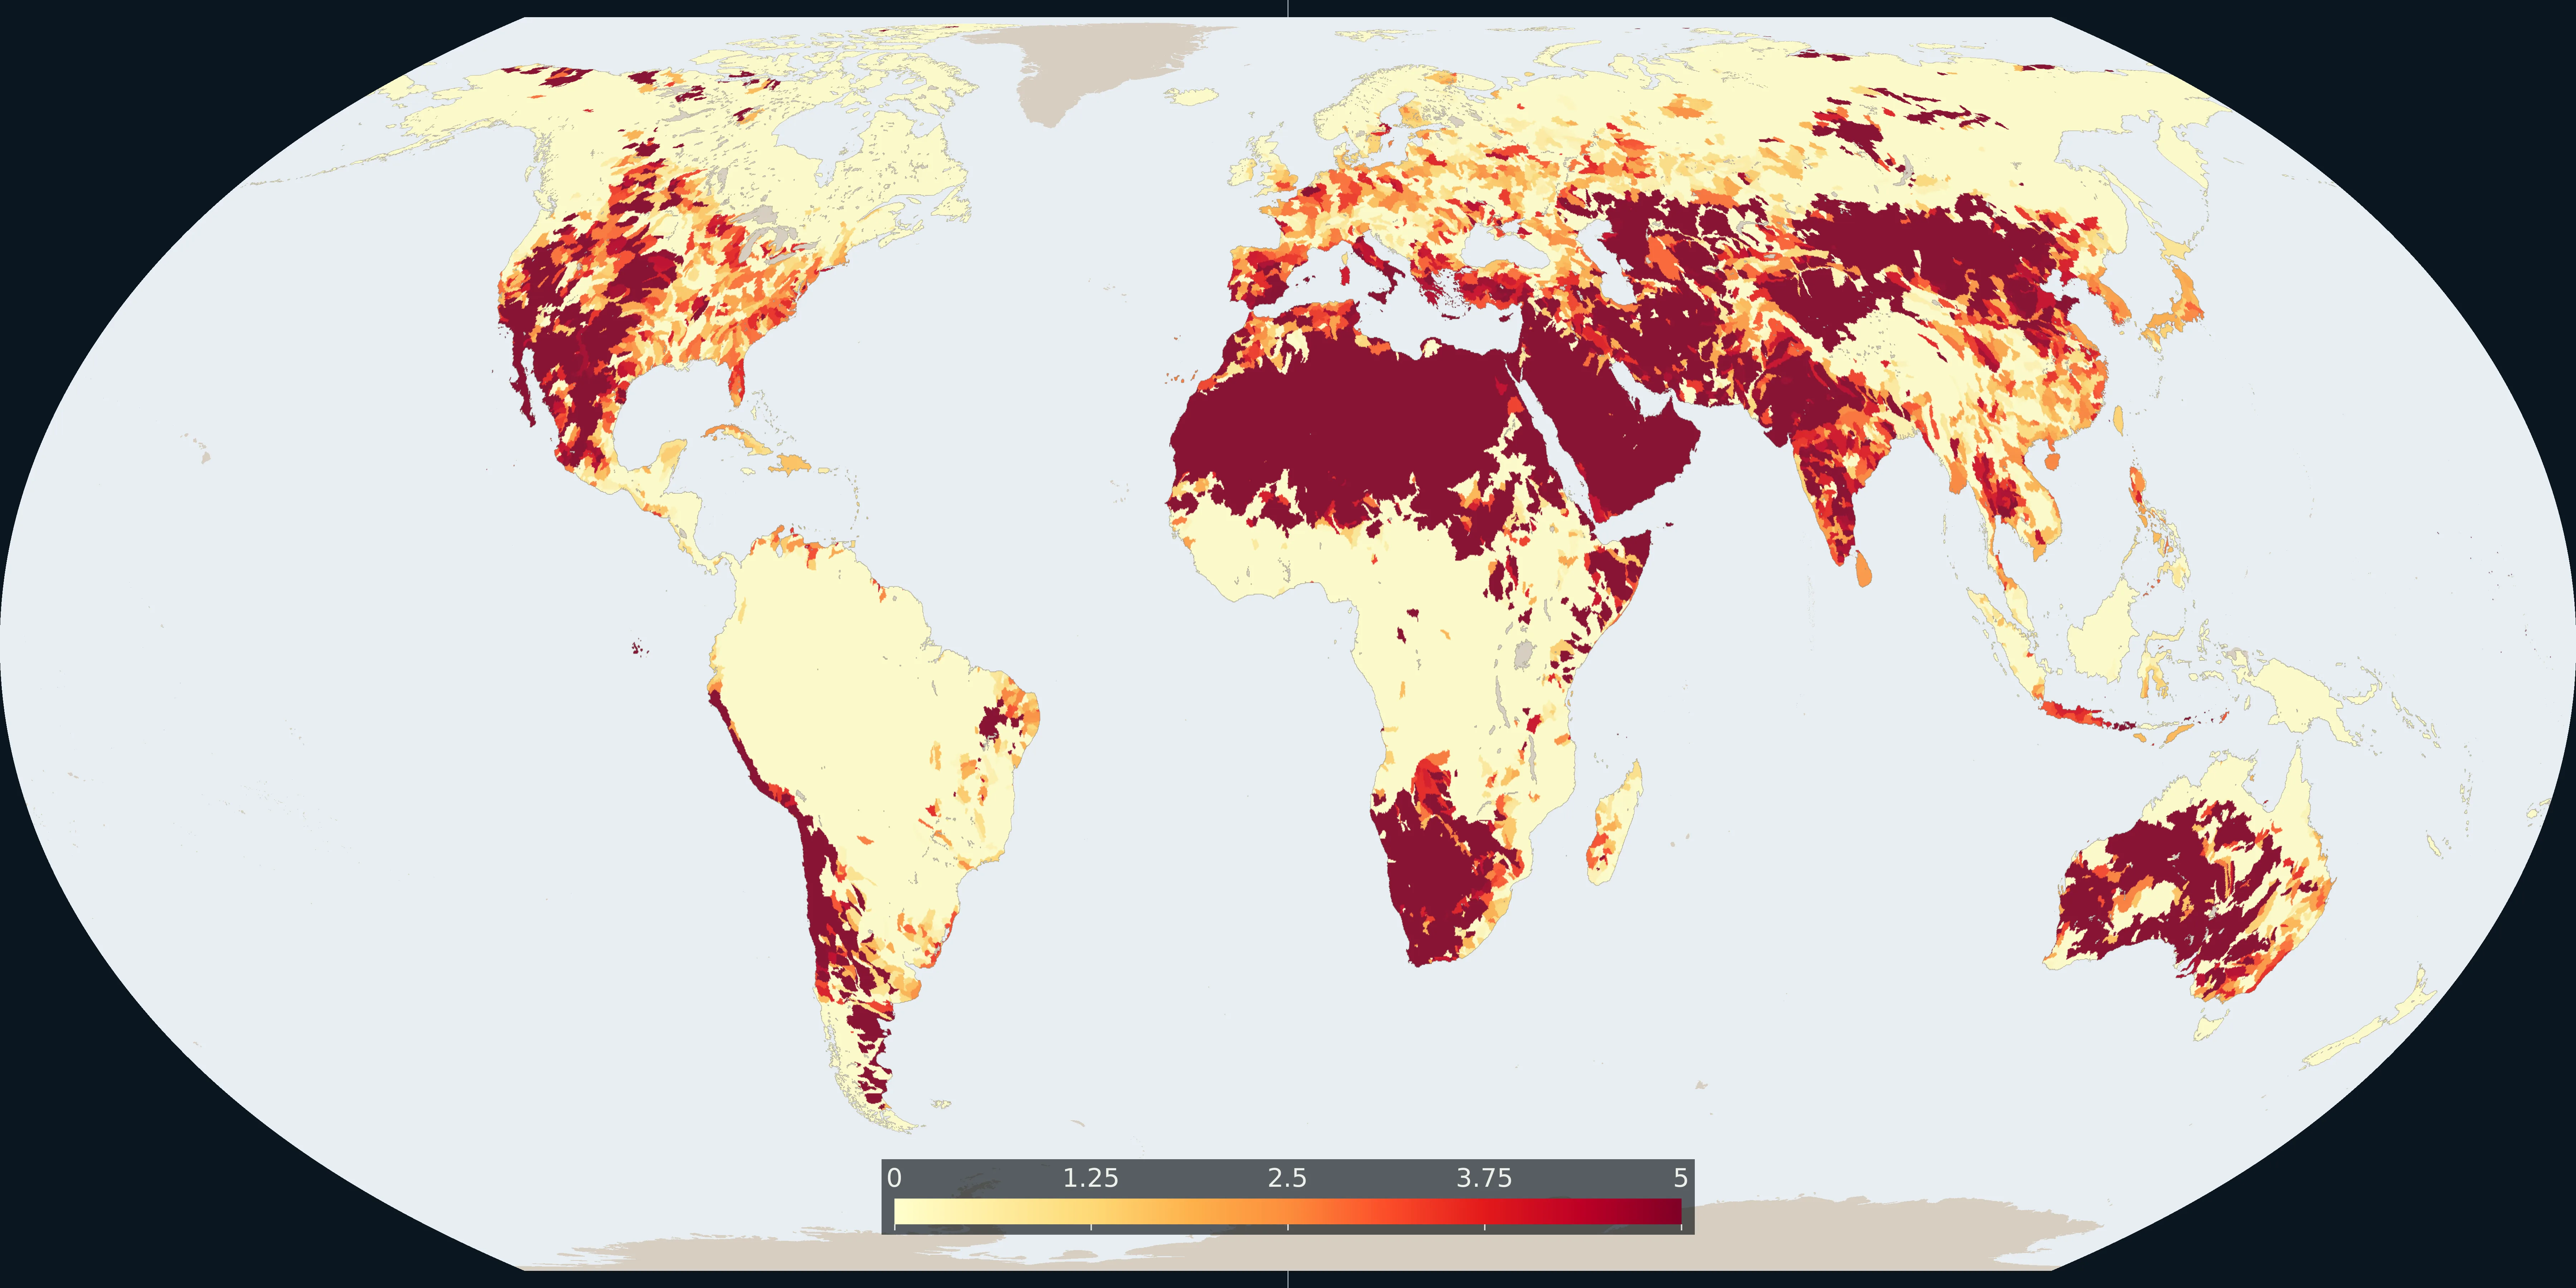
Map: Fix Planet from WRI Aqueduct 4.0 baseline water stress, 2023. The number is the indicator score from 0 to 5. CC BY 4.0. Boundaries: Natural Earth.
The World Resources Institute Aqueduct Water Risk Atlas models baseline water stress and related risks (depletion, flood, drought) at basin scale. Version 4 (2023) is the current public atlas.
World Resources Institute, Aqueduct Water Risk Atlas
Vintage: 2023
https://www.wri.org/aqueduct
Aqueduct 4.0 is CC BY 4.0 (World Resources Institute). The map is the baseline water-stress score for sub-basins, from 0 to 5. Cite Kuzma et al. 2023. Open the Water Risk Atlas for the interactive basins.
High stress means withdrawals are large compared with renewable supply. Cities can import water; farms may still run dry. Climate scenarios on the atlas are projections, not weather forecasts.
Models smooth local rights, illegal wells, and seasonal pulses. Political control of rivers is not in the hydrology alone. A red basin is not a prophecy of war.
Open source map → Nested sub-basin polygons for the whole planet (Pfafstetter levels), a hydrographic base map, not a stress index.
Read the card →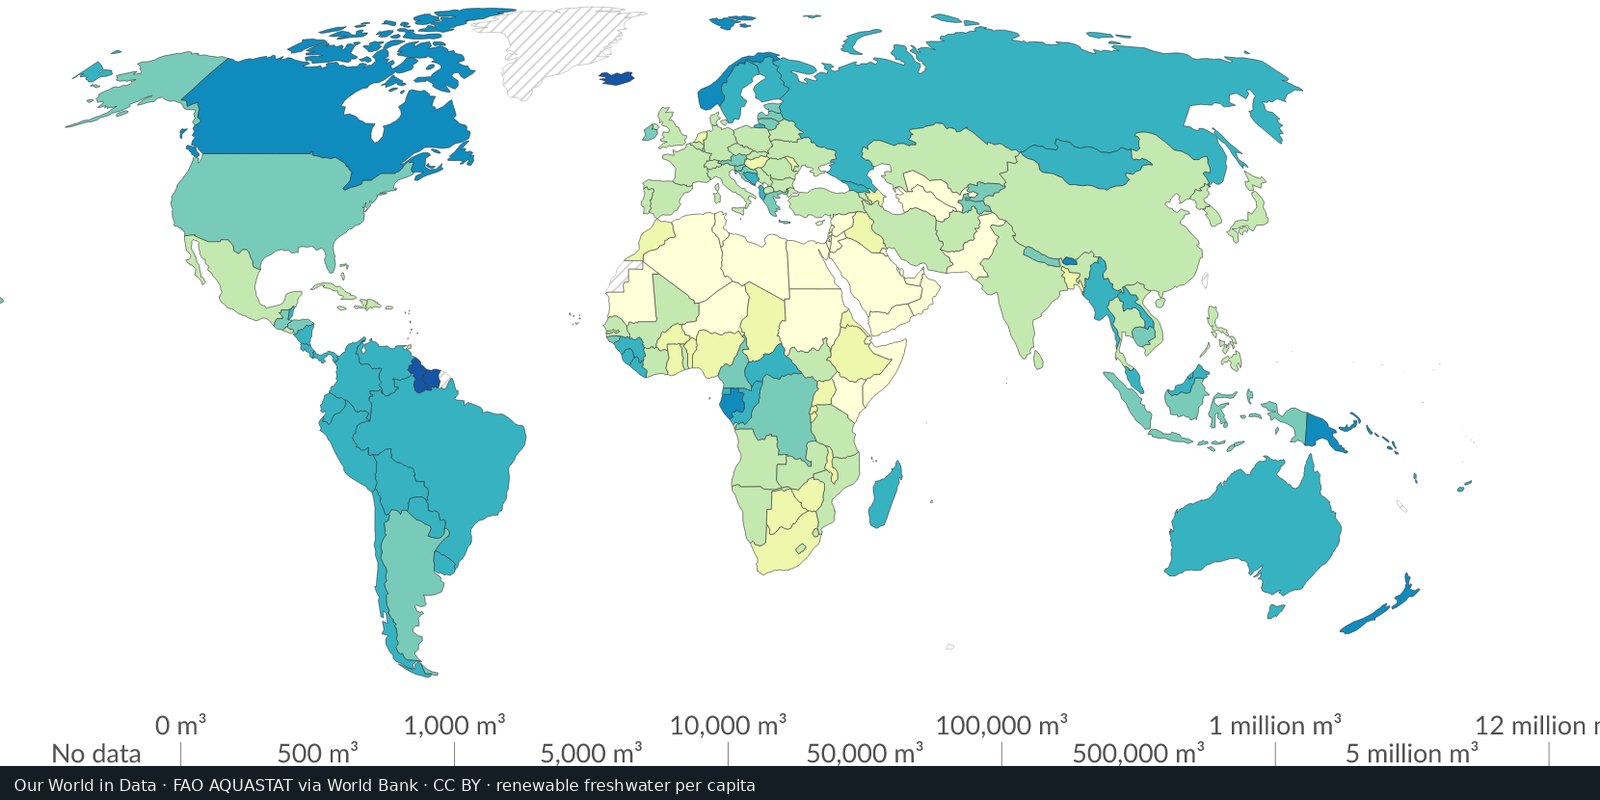
Country-level renewable water and withdrawals from FAO’s global water information system, statistics and country profiles, not a single stress raster.
Read the card →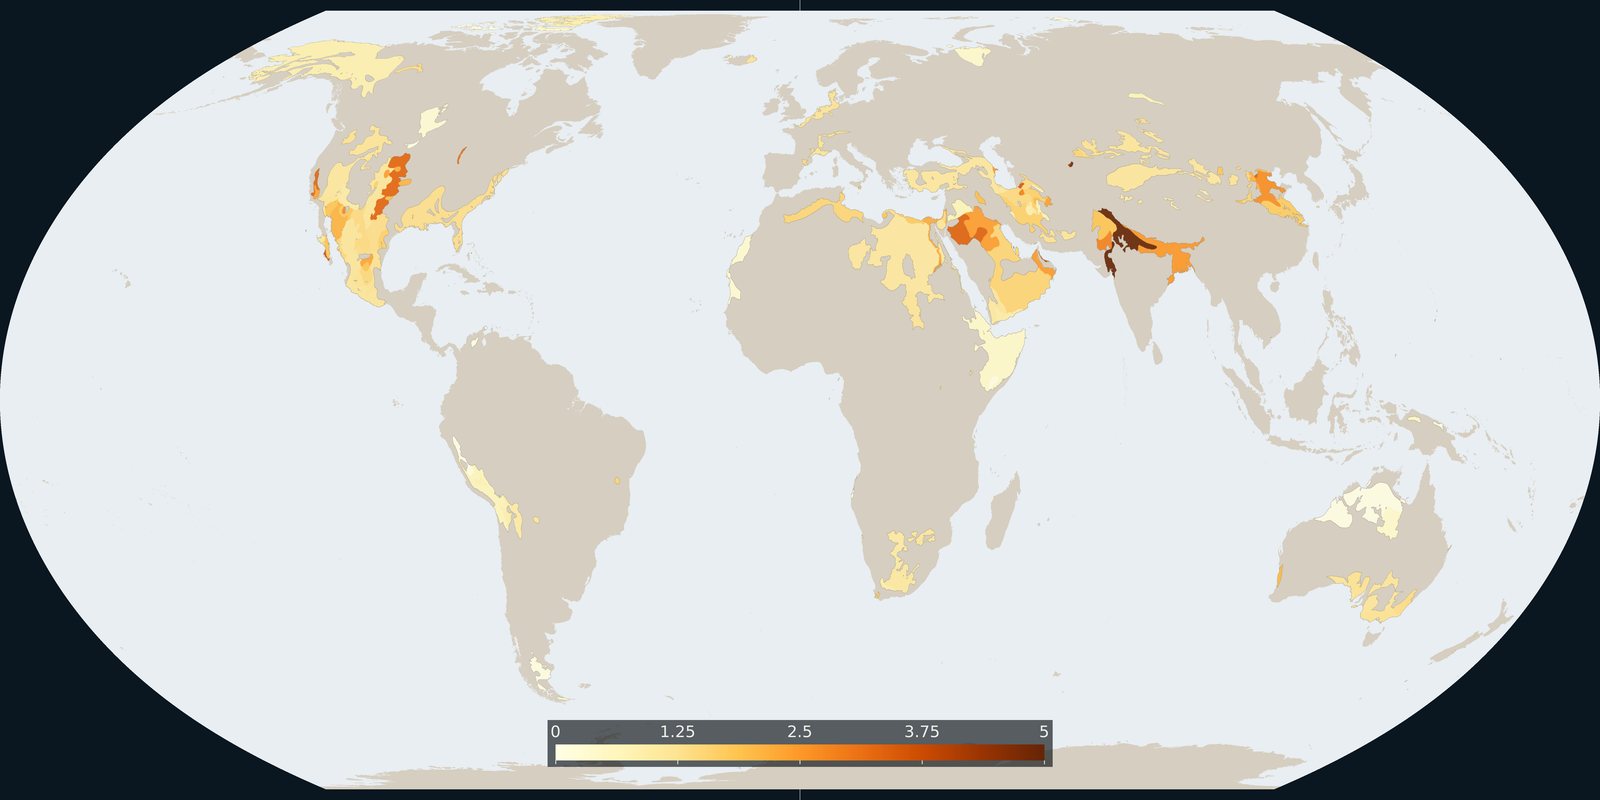
Where Aqueduct 4.0 scores a falling groundwater table, a basin risk score, not a WHYMAP aquifer map and not a well log.
Read the card →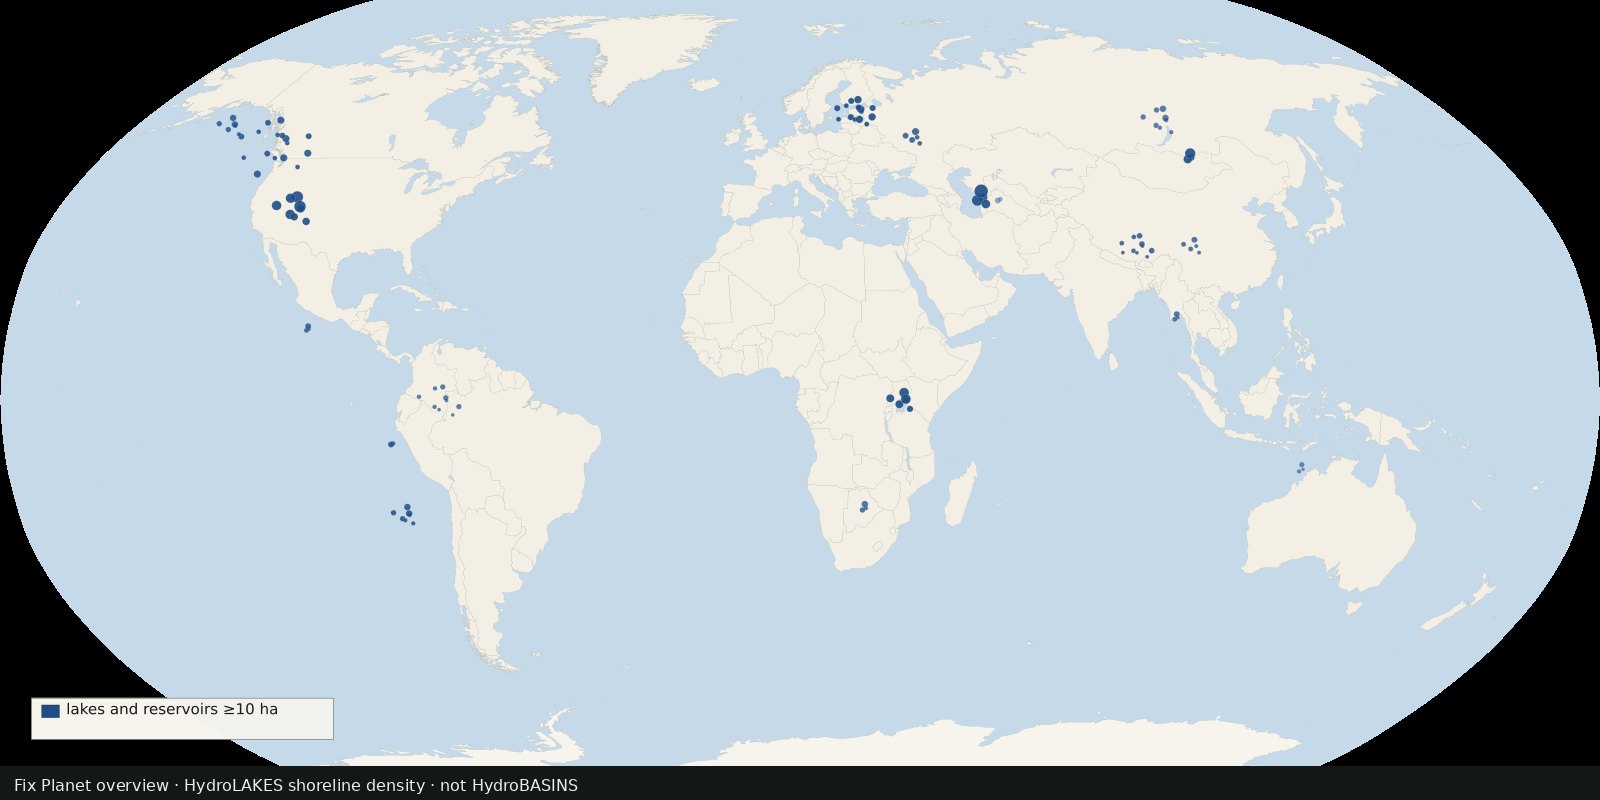 Fix Planet overview
Shoreline polygons for ~1.4 million lakes and reservoirs ≥10 ha, a lake inventory map, not river basins and not a stress index.
Read the card →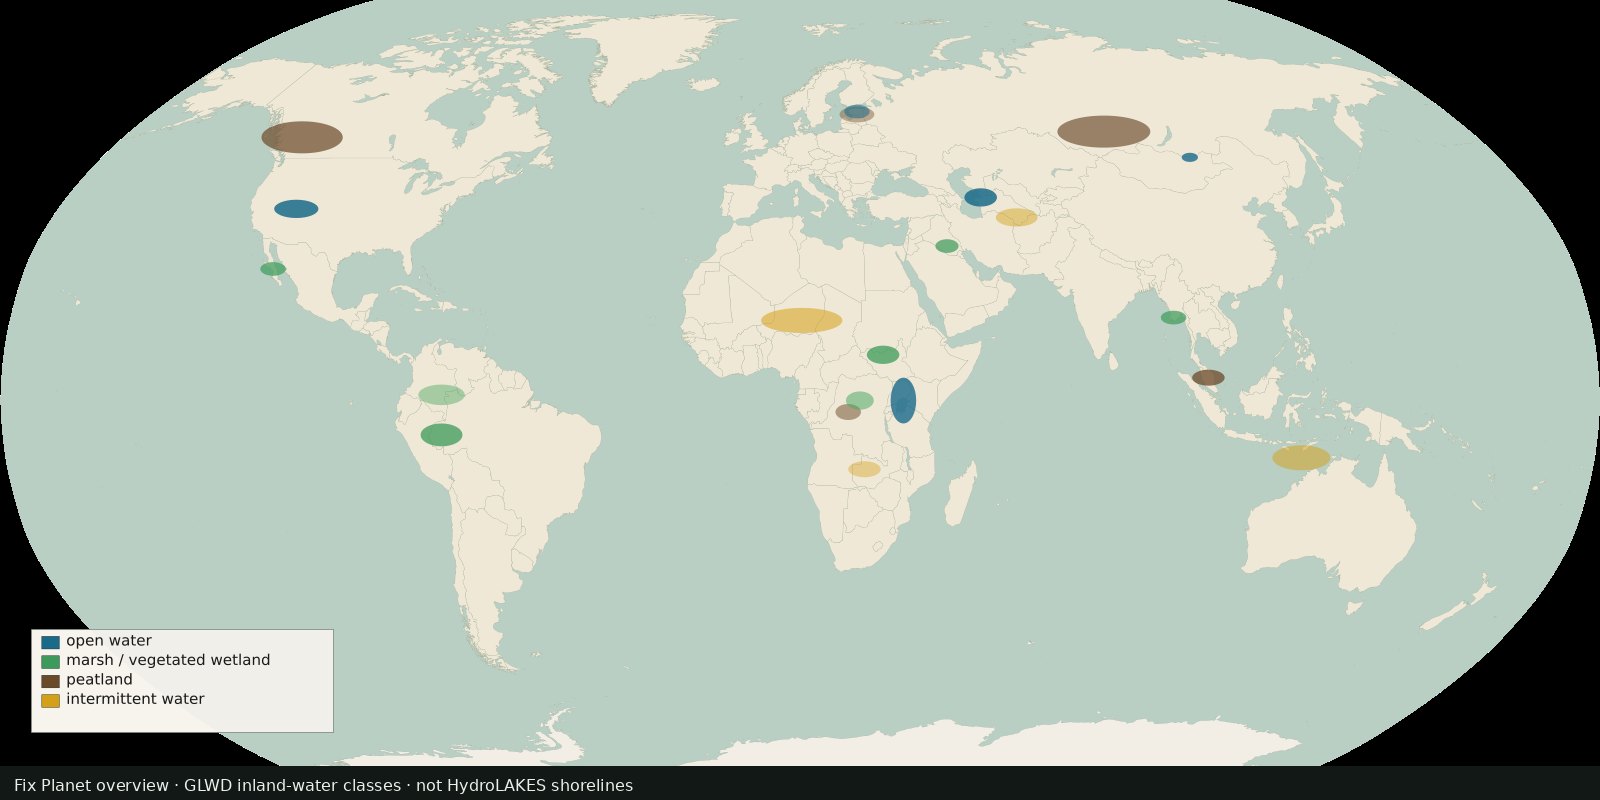 Fix Planet overview
Global inland waters in 33 waterbody and wetland classes, marshes, peatlands, intermittent water and more, not a second HydroLAKES shoreline layer.
Read the card →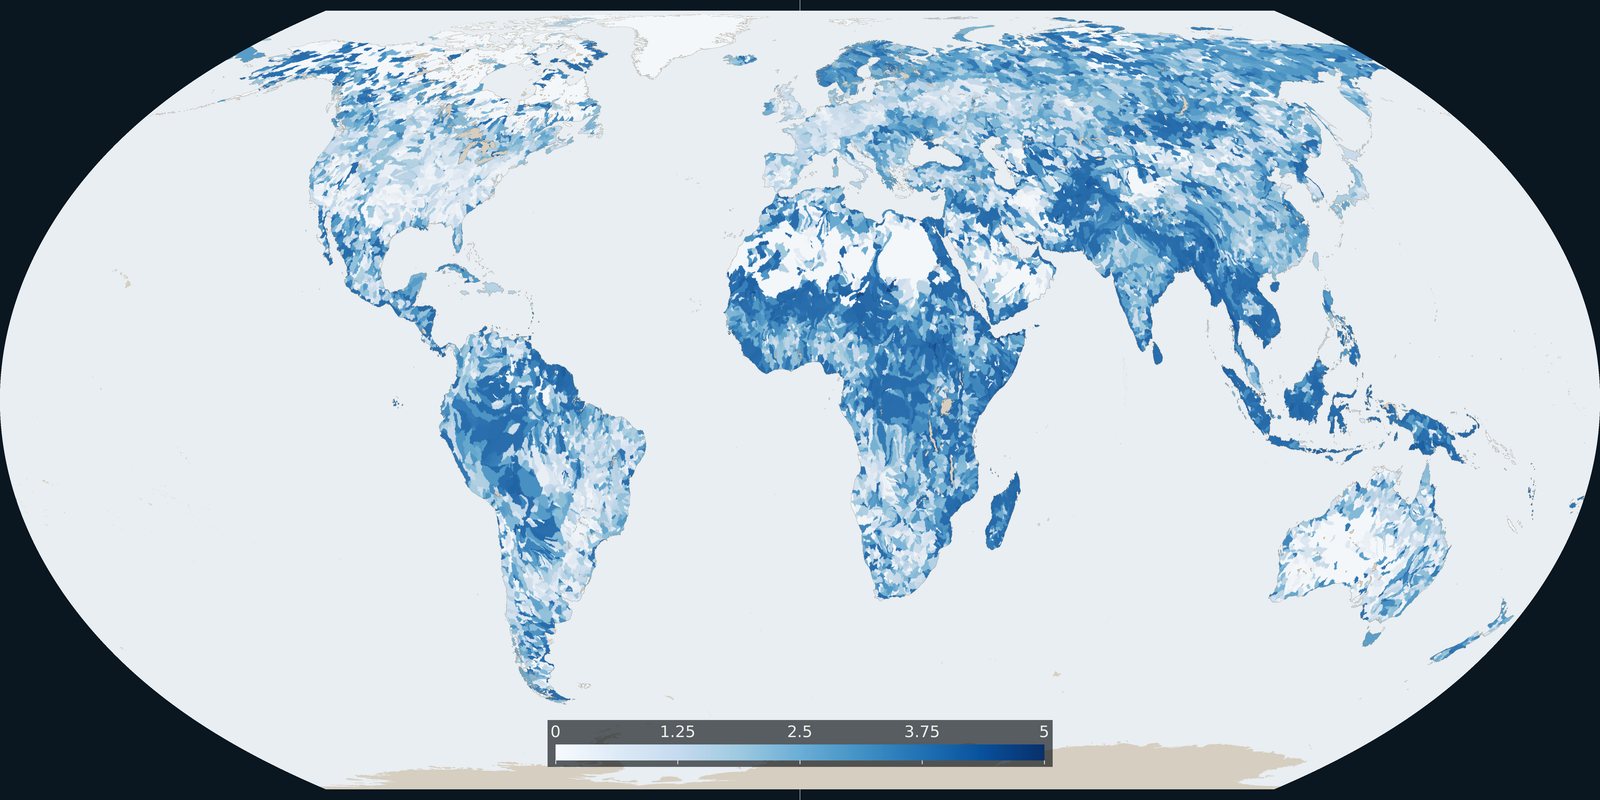
Baseline riverine flood risk from Aqueduct 4.0: a 0-5 basin score, not the water-stress score and not an inundation-depth map.
Read the card →