

Water
Water stress
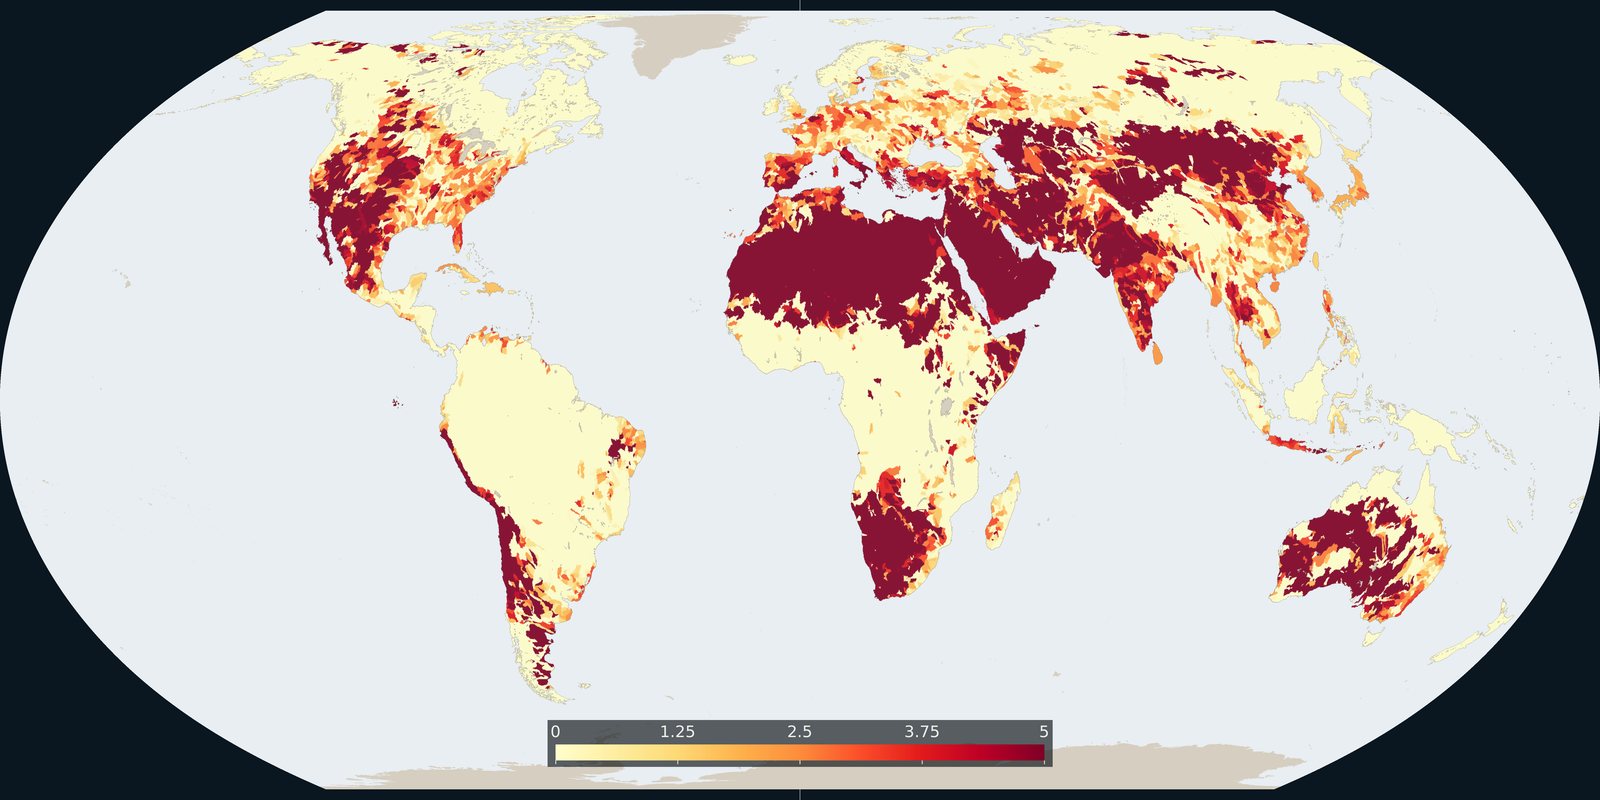
WRI Aqueduct: where demand for water is high relative to available supply, a model, not a well log.
Read the card →Baseline riverine flood risk from Aqueduct 4.0: a 0-5 basin score, not the water-stress score and not an inundation-depth map.
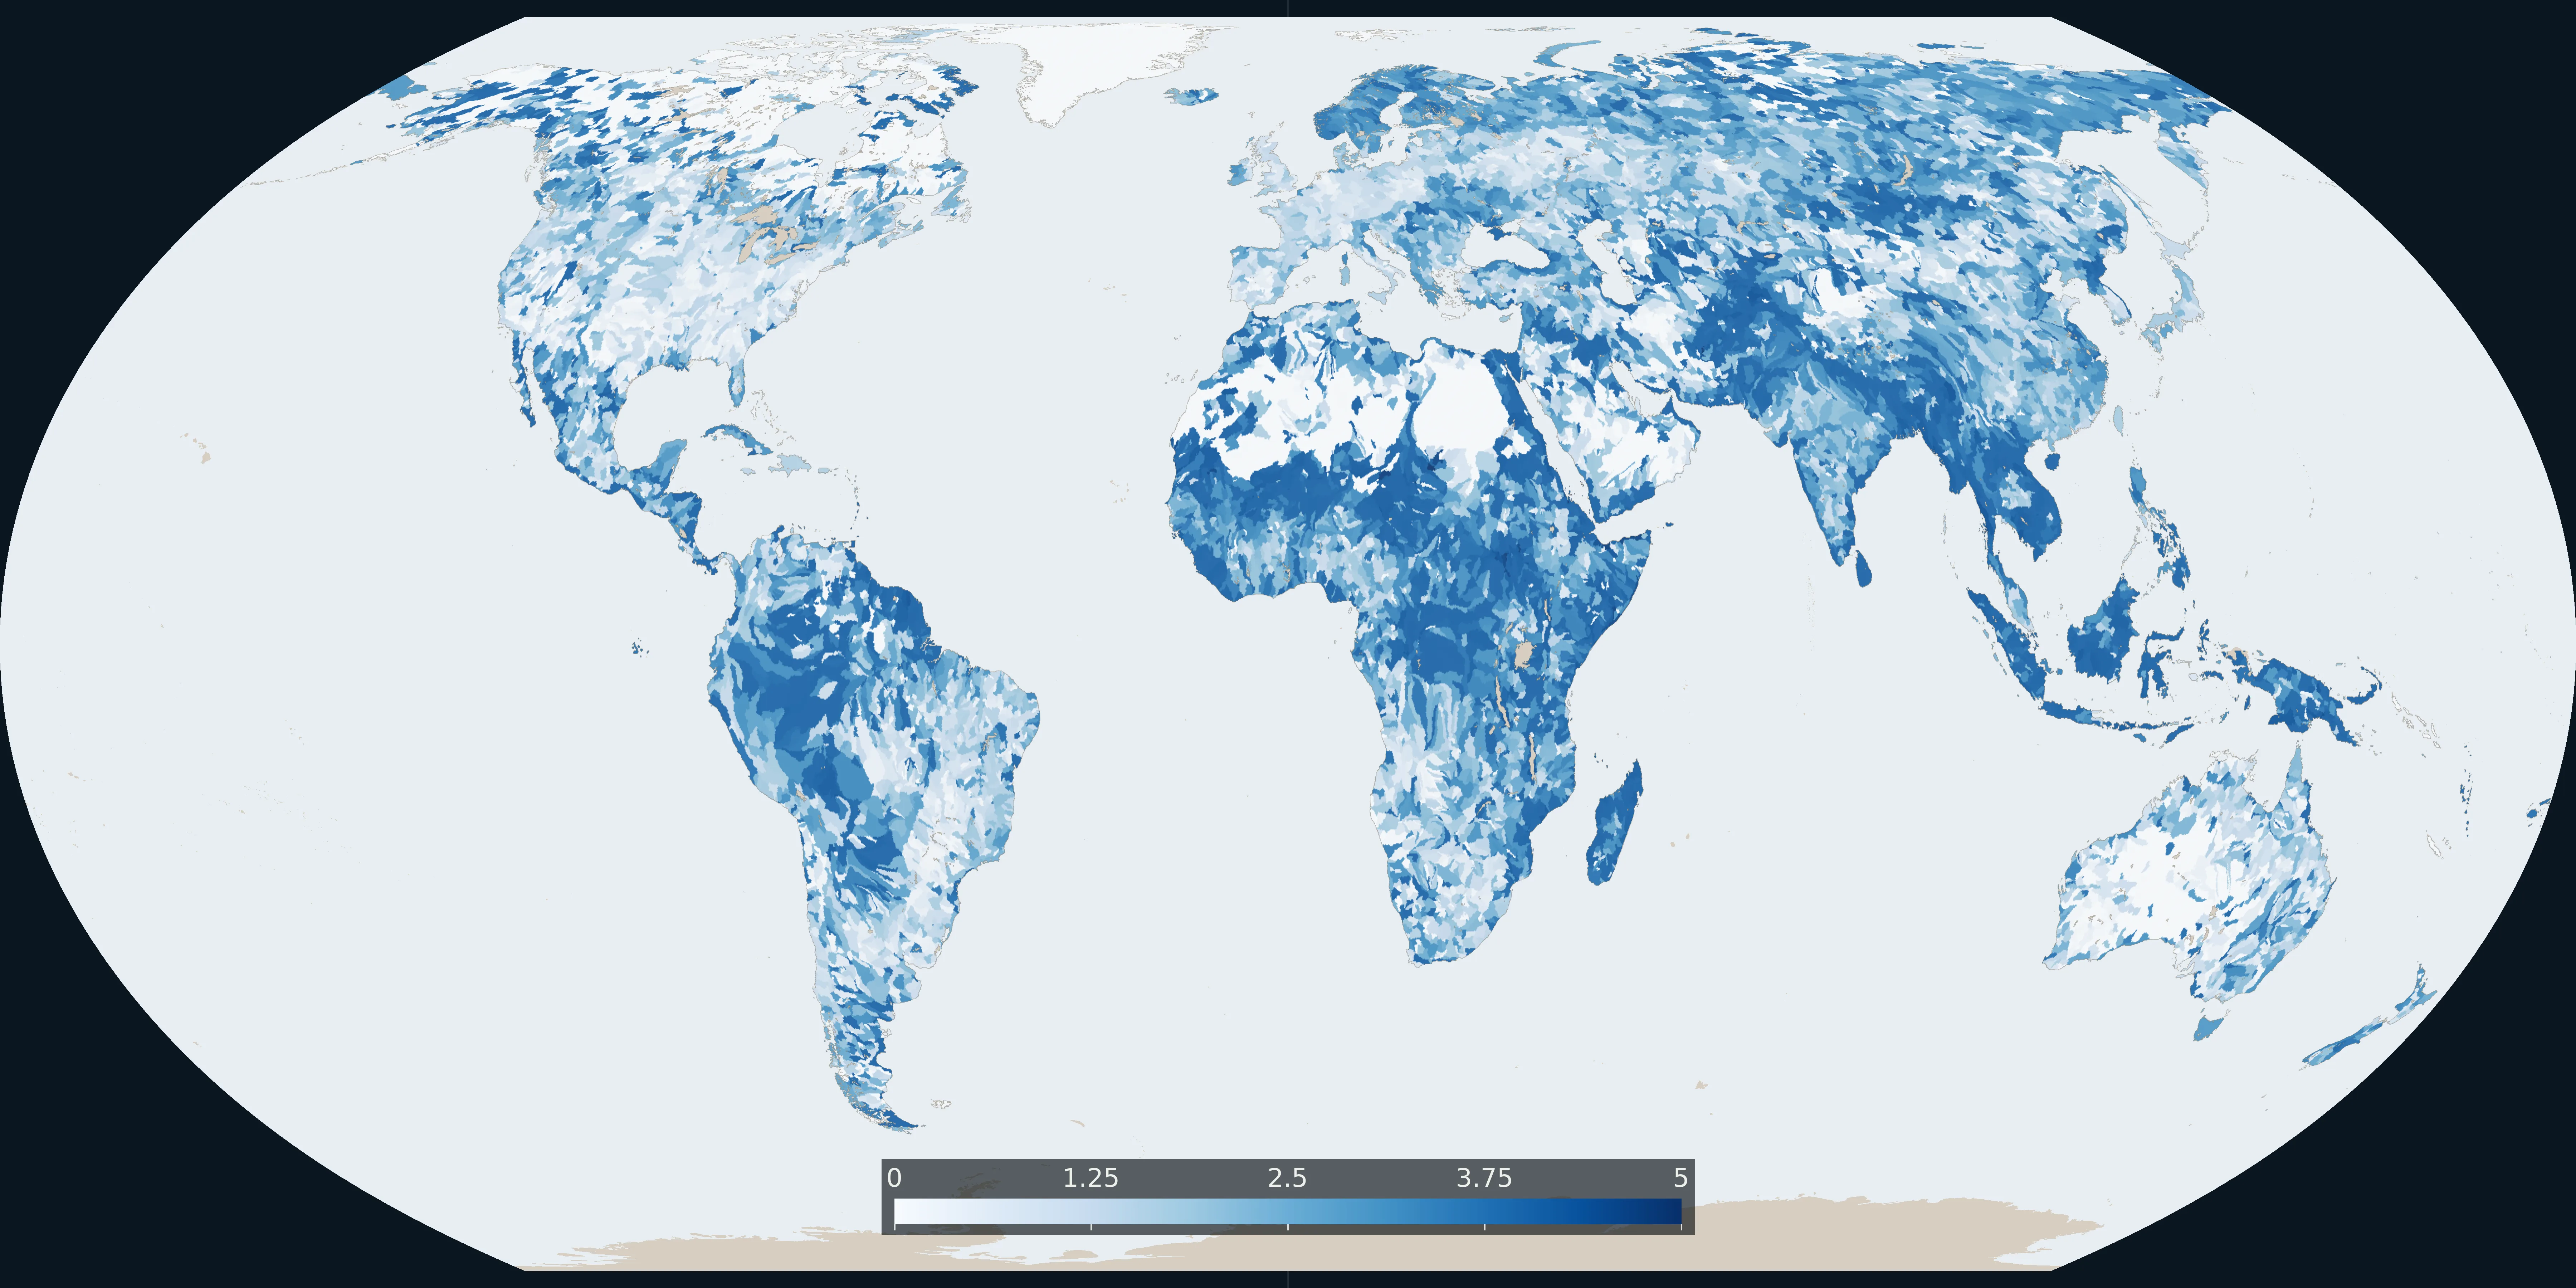
Map: Fix Planet from WRI Aqueduct 4.0 baseline riverine flood risk, 2023. The number is the indicator score from 0 to 5. CC BY 4.0. Boundaries: Natural Earth.
The map is the WRI Aqueduct 4.0 baseline riverine flood risk score for sub-basins, from 0 to 5. It is a modelled risk score. Aqueduct Floods, a related WRI tool built with Deltares, VU Amsterdam, Utrecht University, and PBL, publishes inundation depth by return period for riverine and coastal floods. Those depth rasters are not this plate.
Water stress compares demand with supply. This card is the separate Aqueduct score for riverine flood risk. It does not replace basins or AQUASTAT.
The colour is the 0-5 score. A higher score is higher modelled riverine flood risk, not a water depth and not a forecast that a city floods tomorrow. Coastal inundation depth is a different product in Aqueduct Floods.
The score is a model. It is not an inundation depth and not the baseline water-stress score. Aqueduct Floods keeps the depth maps and the coastal layers.
Aqueduct 4.0 is CC BY 4.0 (World Resources Institute). The map is the baseline riverine flood risk score (0-5), not an inundation-depth raster from Aqueduct Floods and not the water-stress score. Cite Kuzma et al. 2023.
Open source map → WRI Aqueduct: where demand for water is high relative to available supply, a model, not a well log.
Read the card →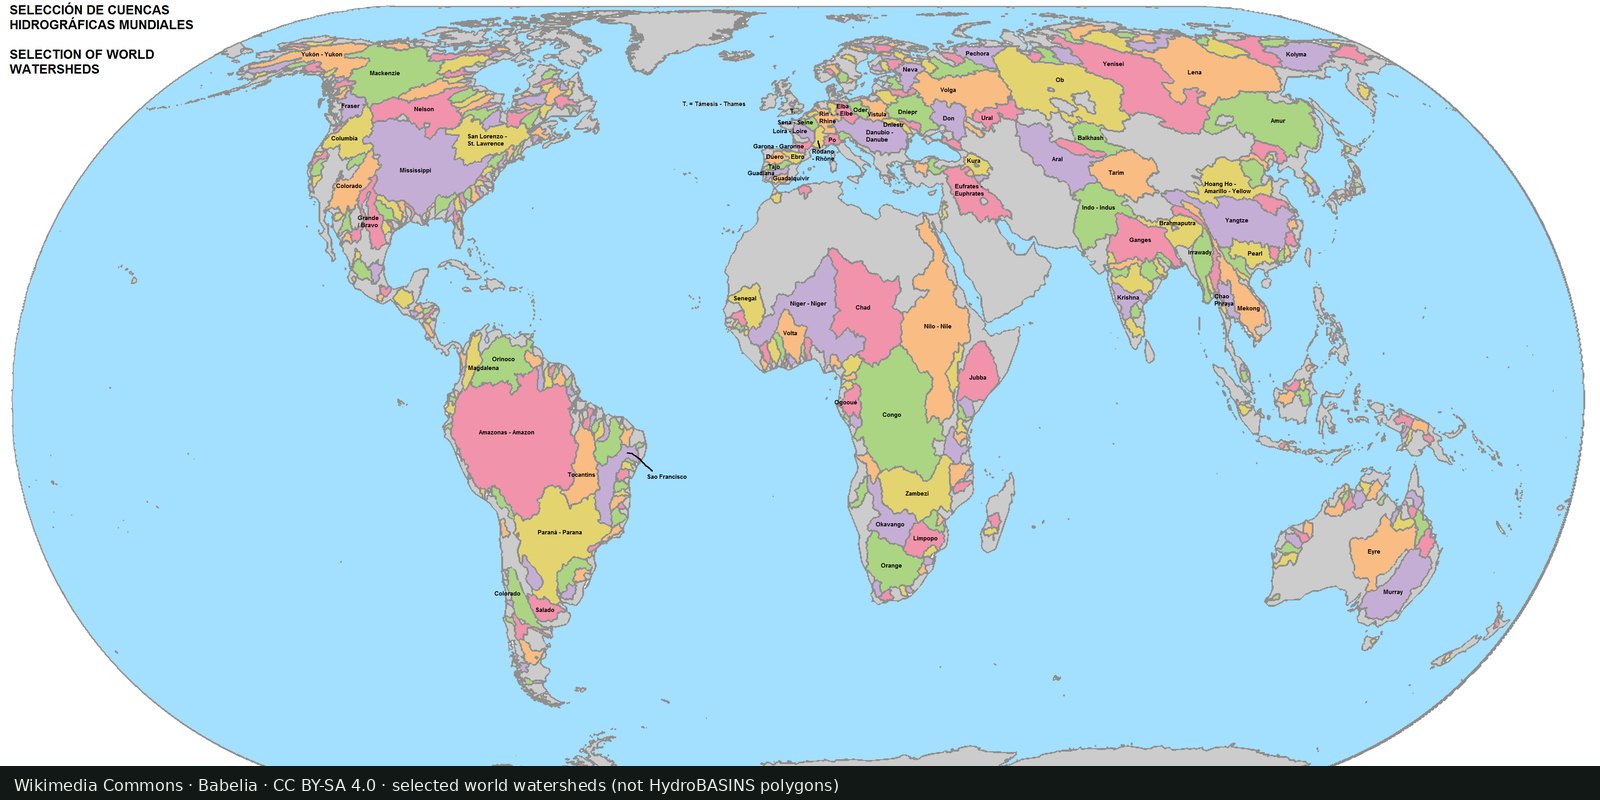
Nested sub-basin polygons for the whole planet (Pfafstetter levels), a hydrographic base map, not a stress index.
Read the card →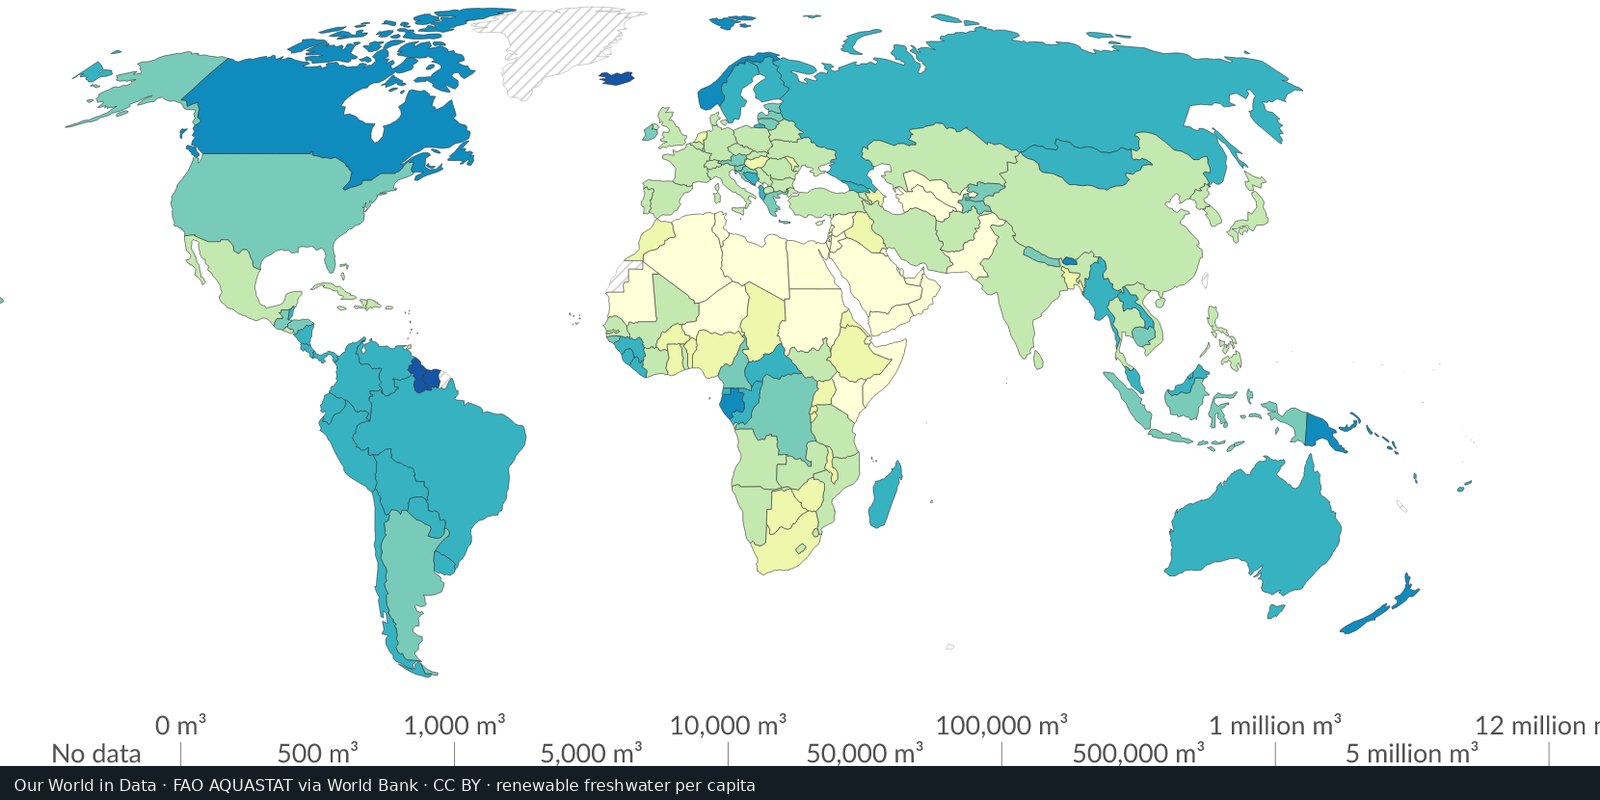
Country-level renewable water and withdrawals from FAO’s global water information system, statistics and country profiles, not a single stress raster.
Read the card →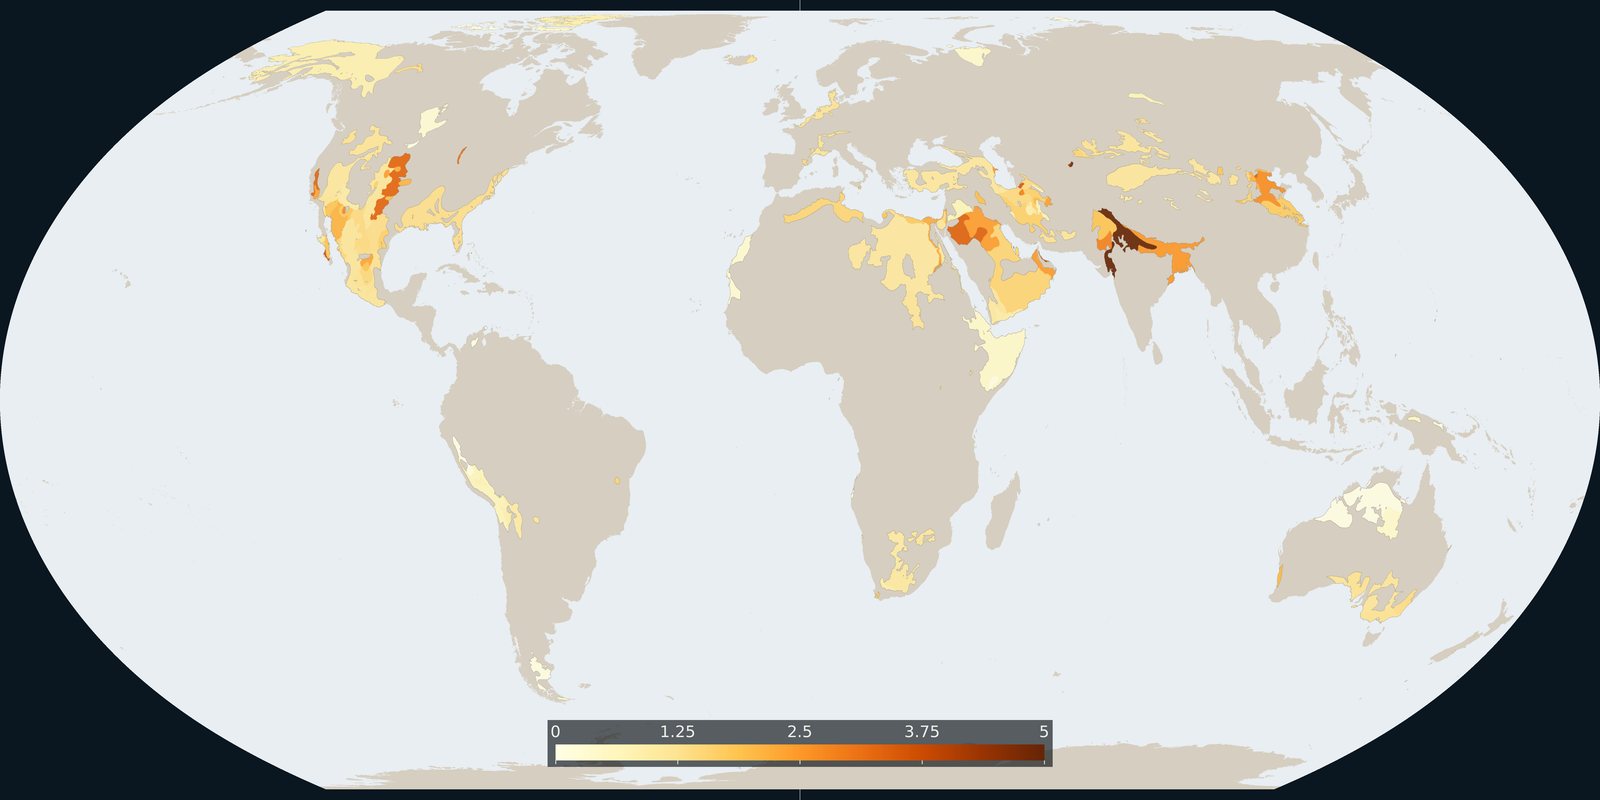
Where Aqueduct 4.0 scores a falling groundwater table, a basin risk score, not a WHYMAP aquifer map and not a well log.
Read the card →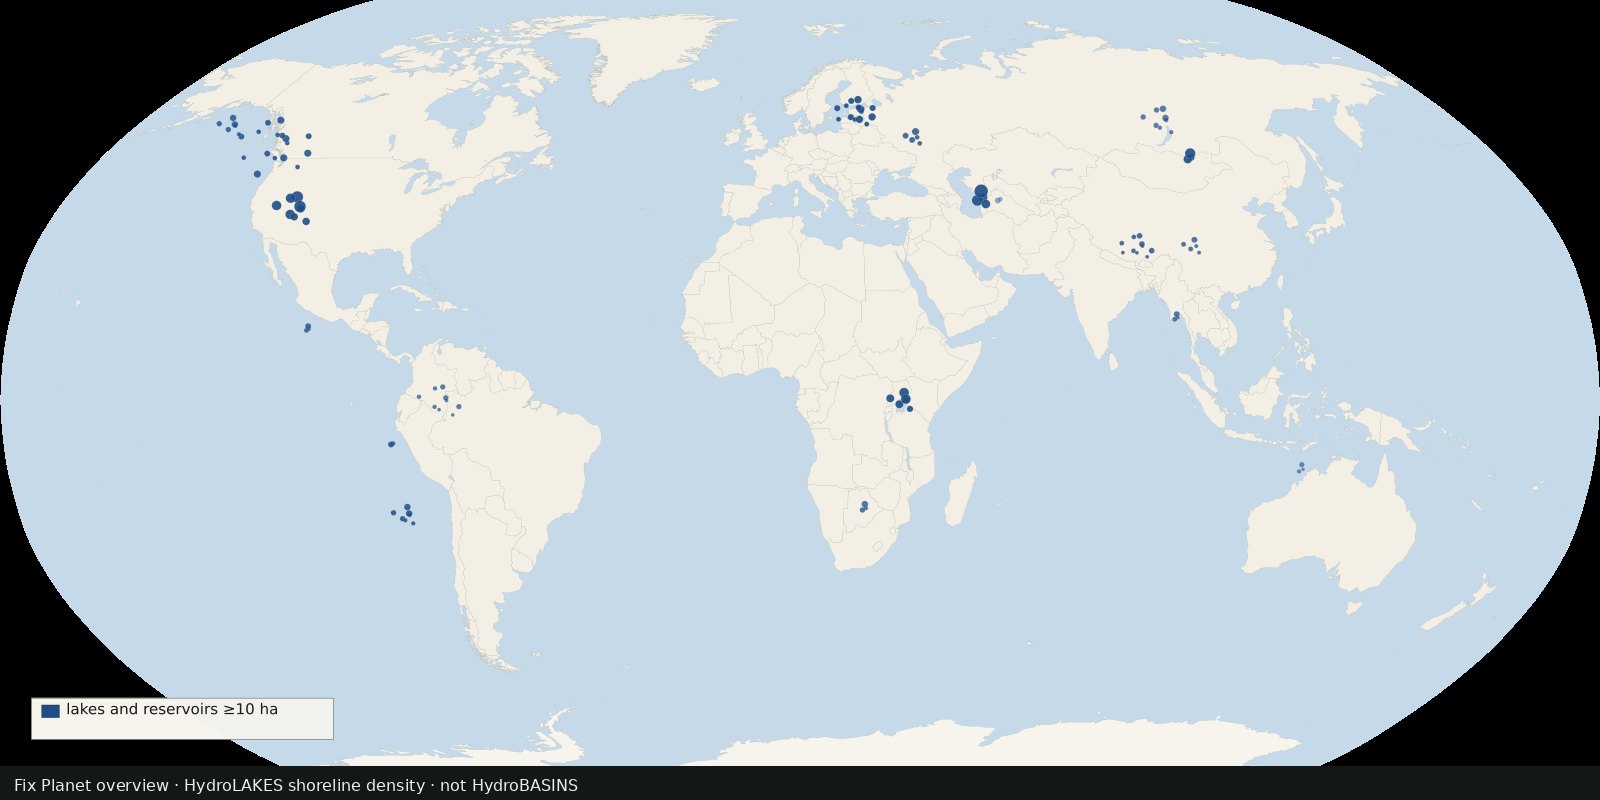 Fix Planet overview
Shoreline polygons for ~1.4 million lakes and reservoirs ≥10 ha, a lake inventory map, not river basins and not a stress index.
Read the card →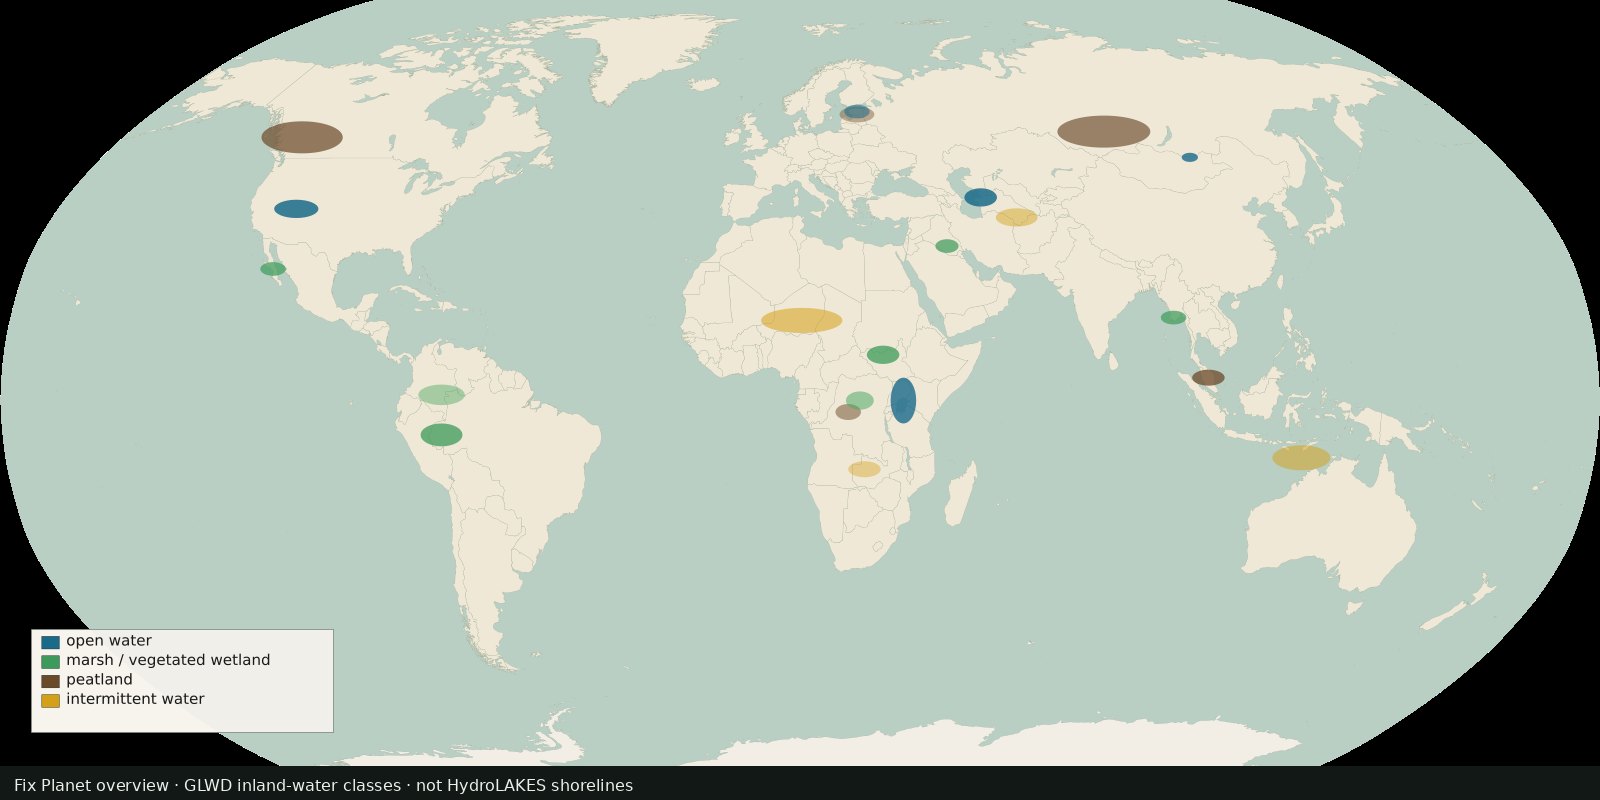 Fix Planet overview
Global inland waters in 33 waterbody and wetland classes, marshes, peatlands, intermittent water and more, not a second HydroLAKES shoreline layer.
Read the card →