

Water
Water stress
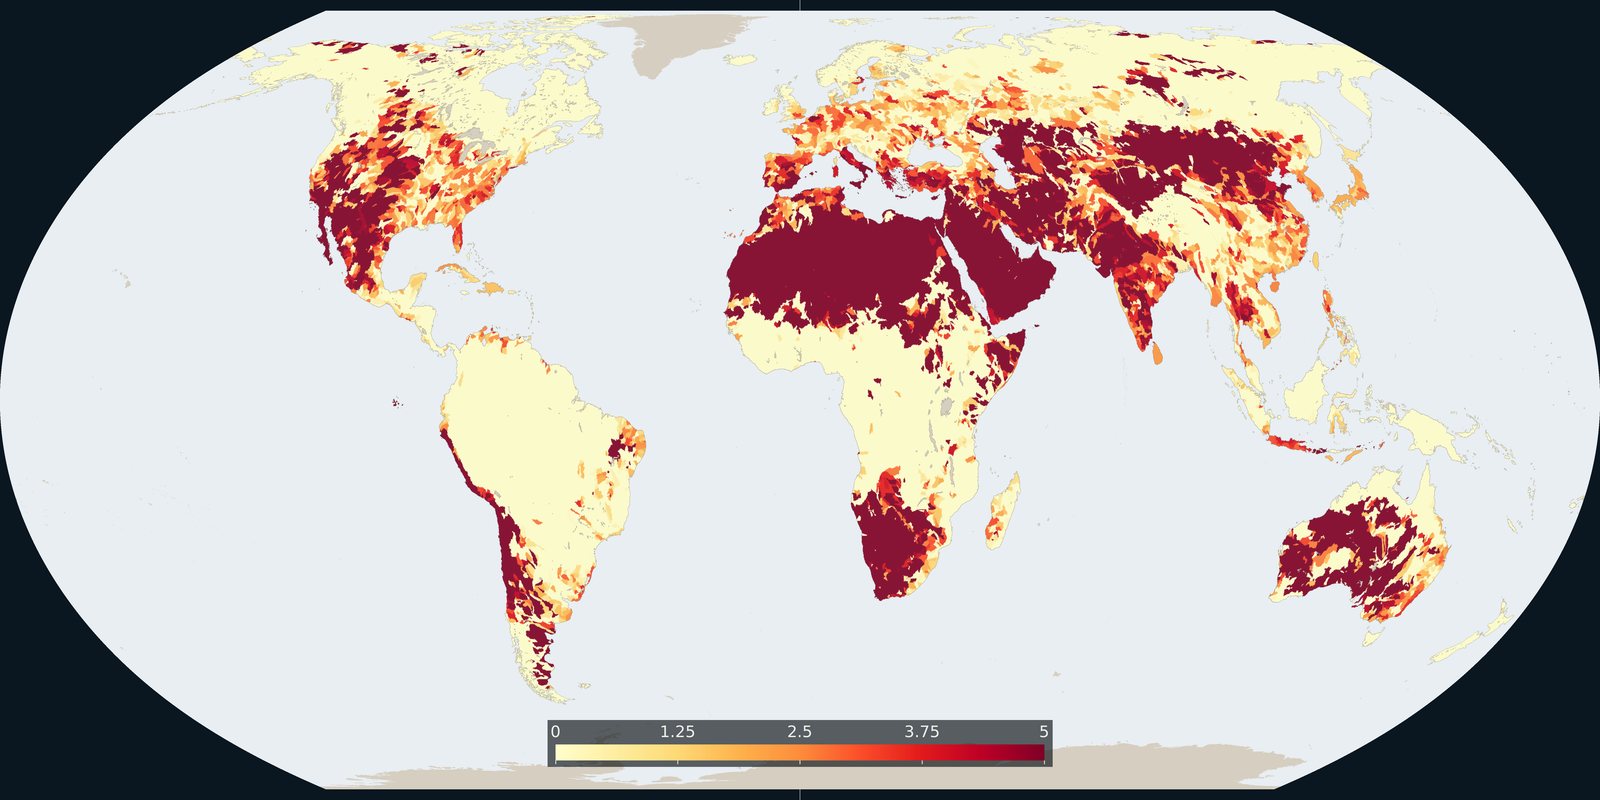
WRI Aqueduct: where demand for water is high relative to available supply, a model, not a well log.
Read the card →Global inland waters in 33 waterbody and wetland classes, marshes, peatlands, intermittent water and more, not a second HydroLAKES shoreline layer.
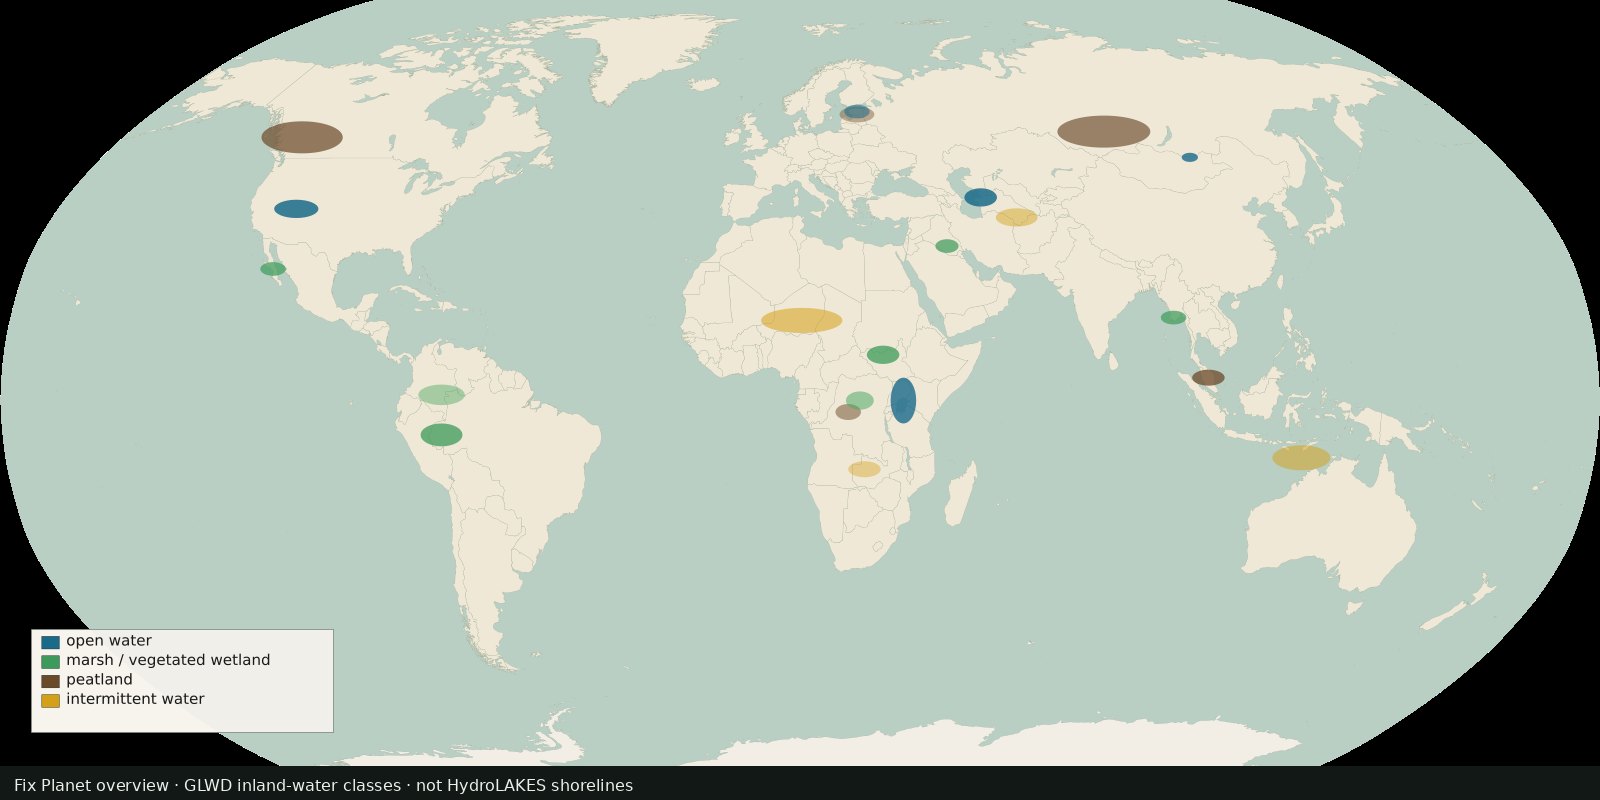
The Global Lakes and Wetlands Database version 2 (GLWD v2) maps inland surface waters into 33 non-overlapping waterbody and wetland classes at 15-arc-second resolution (~500 m), representing up to ~18.2 million km² of wetlands for the contemporary ~1990-2020 window. Successor to GLWD v1 (Lehner & Döll 2004). Cite Lehner et al., Earth System Science Data 2025. CC BY 4.0.
HydroLAKES = lake/reservoir shorelines ≥10 ha. GLWD v2 answers a broader question: wetland and inland-water classes (including intermittent and vegetated wetlands) that lakes alone miss. Same HydroSHEDS delivery path.
A class shade is “this cell’s dominant inland-water / wetland type in the harmonized map,” not a Ramsar legal listing and not water stress. Open water vs marsh vs peat vs rice-related classes are ecological cartography, not land titles. Prefer the HydroSHEDS product page + ESSD paper; Figshare holds the download (cite the DOI in the paper if the Figshare landing is flaky).
A class shade is not a Ramsar legal listing and not water stress. Open water vs marsh vs peat vs intermittent classes are ecological cartography, not land titles. HydroLAKES remains the shoreline inventory; this card is the class map.
The preview is a Fix Planet schematic of inland-water classes (open water, marsh, peat, intermittent), not a HydroSHEDS product figure and not a second HydroLAKES shoreline layer. GLWD v2 is CC BY 4.0 (cite Lehner et al. 2025). Open the HydroSHEDS GLWD page for the product.
Open source map → WRI Aqueduct: where demand for water is high relative to available supply, a model, not a well log.
Read the card →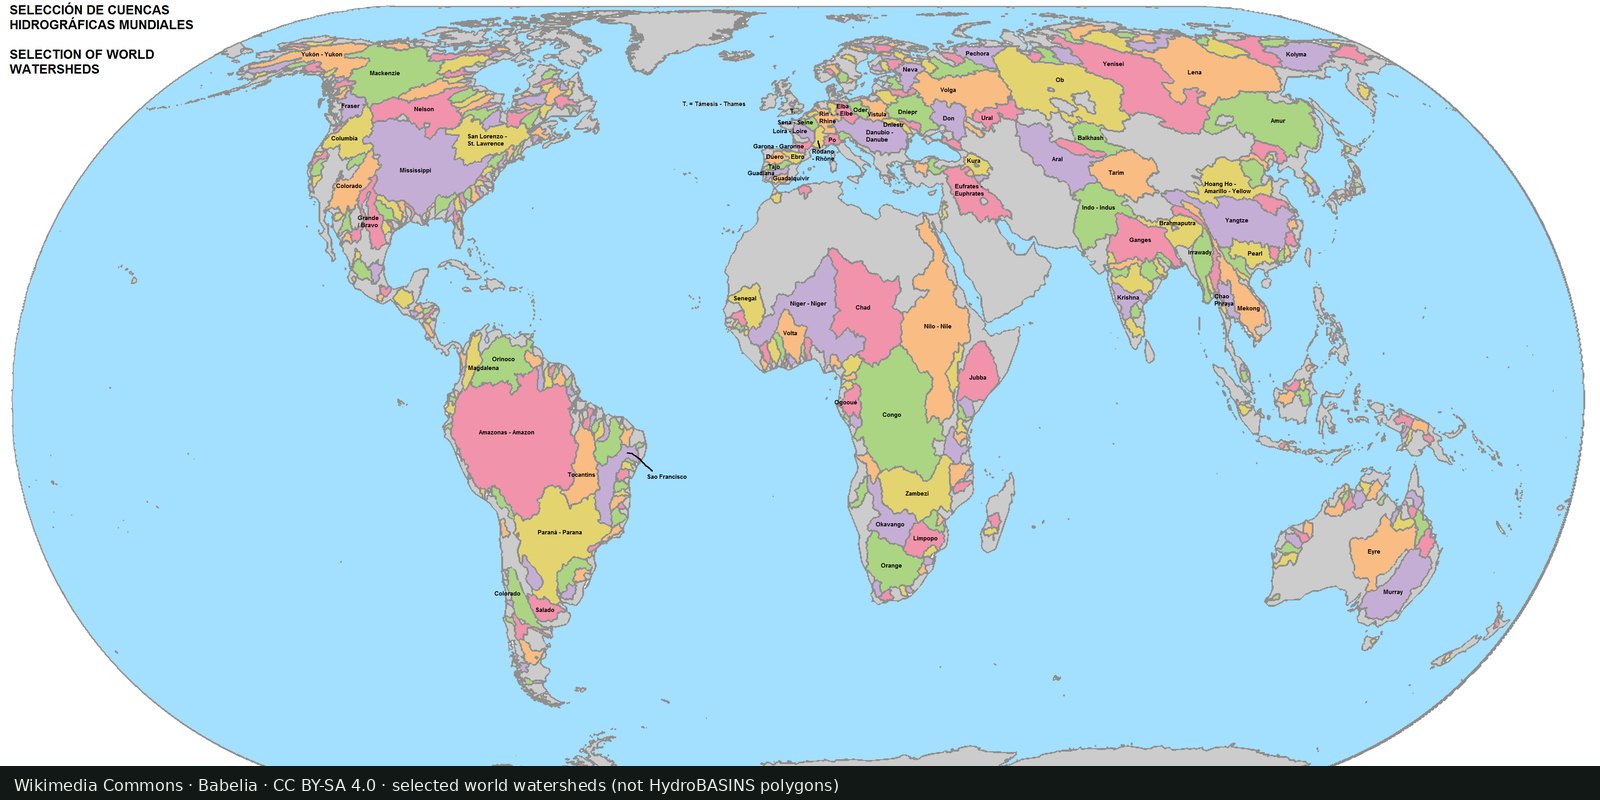
Nested sub-basin polygons for the whole planet (Pfafstetter levels), a hydrographic base map, not a stress index.
Read the card →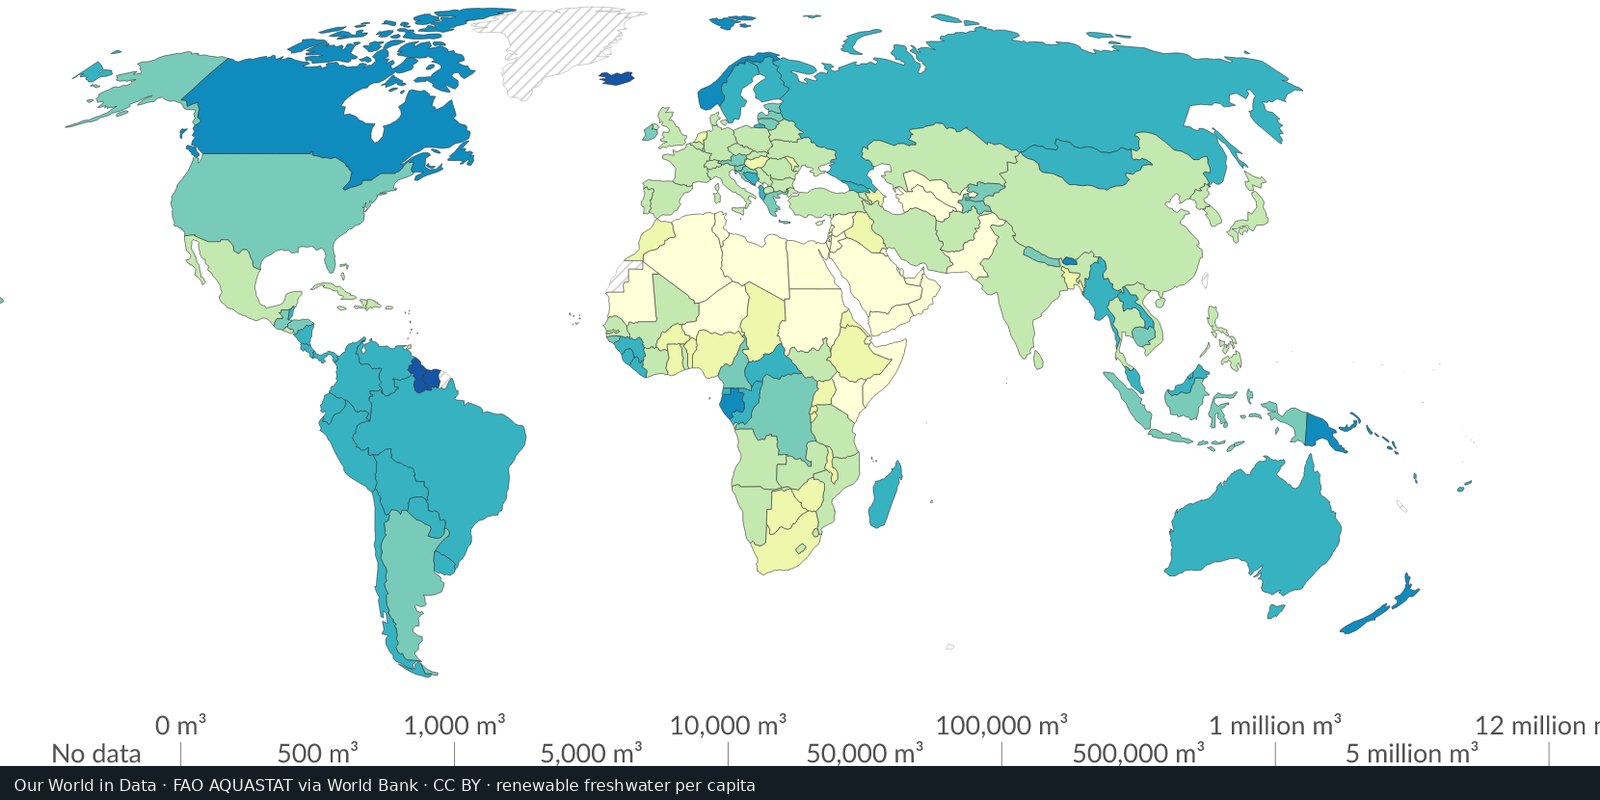
Country-level renewable water and withdrawals from FAO’s global water information system, statistics and country profiles, not a single stress raster.
Read the card →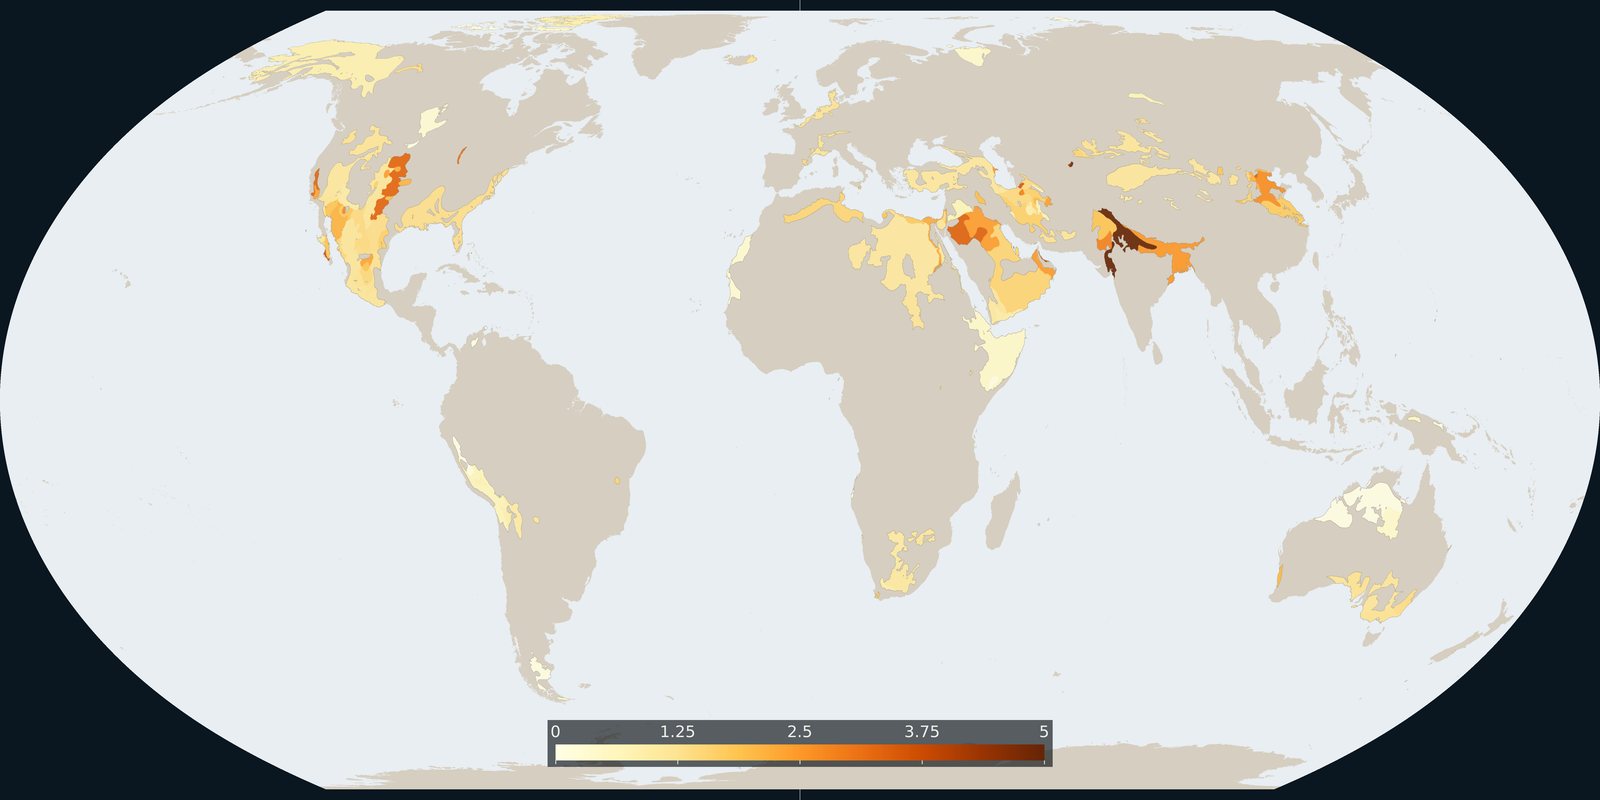
Where Aqueduct 4.0 scores a falling groundwater table, a basin risk score, not a WHYMAP aquifer map and not a well log.
Read the card →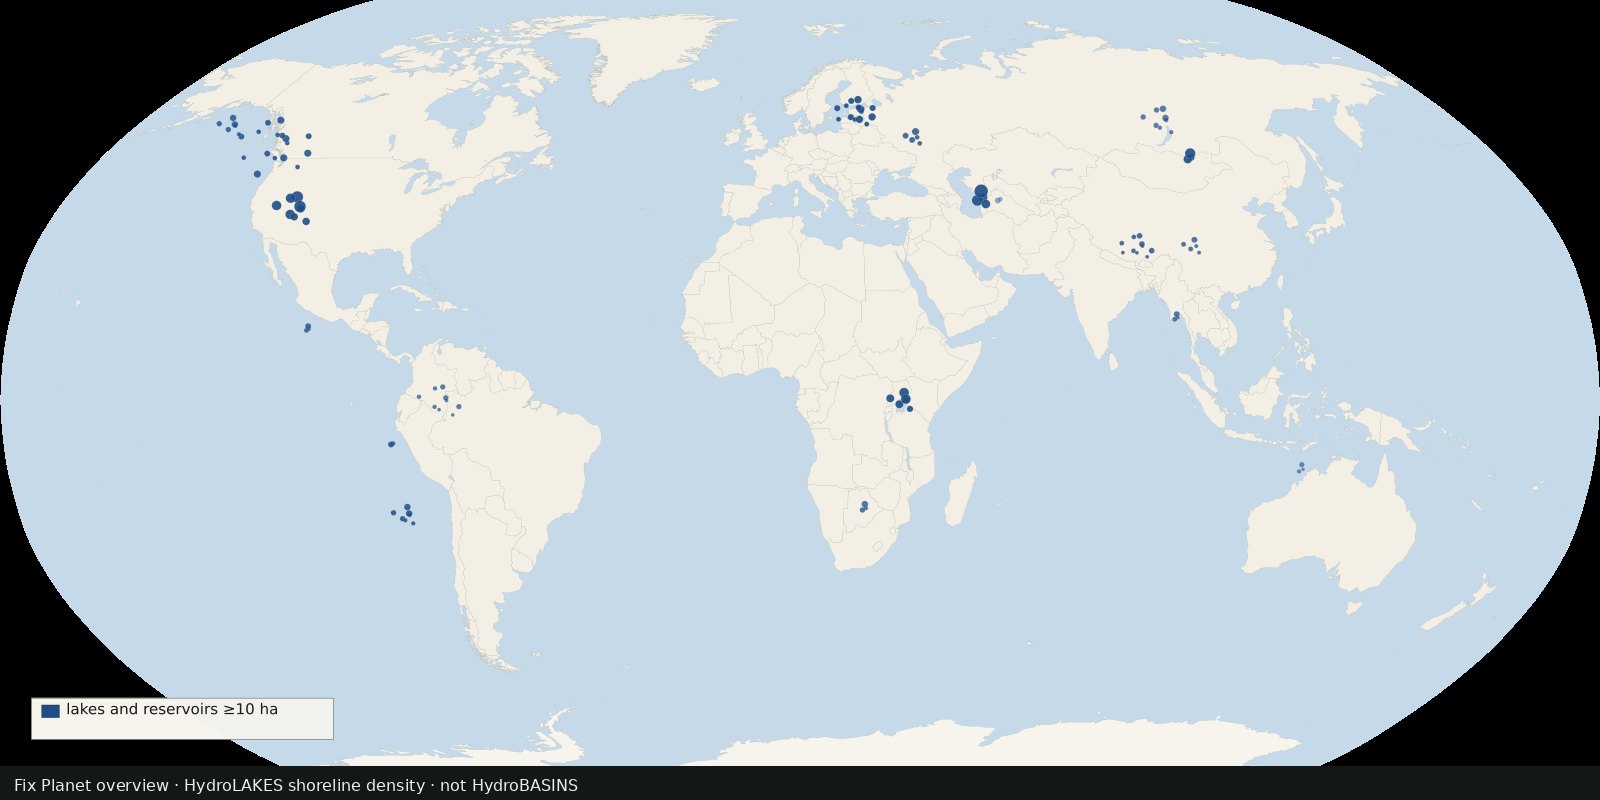 Fix Planet overview
Shoreline polygons for ~1.4 million lakes and reservoirs ≥10 ha, a lake inventory map, not river basins and not a stress index.
Read the card →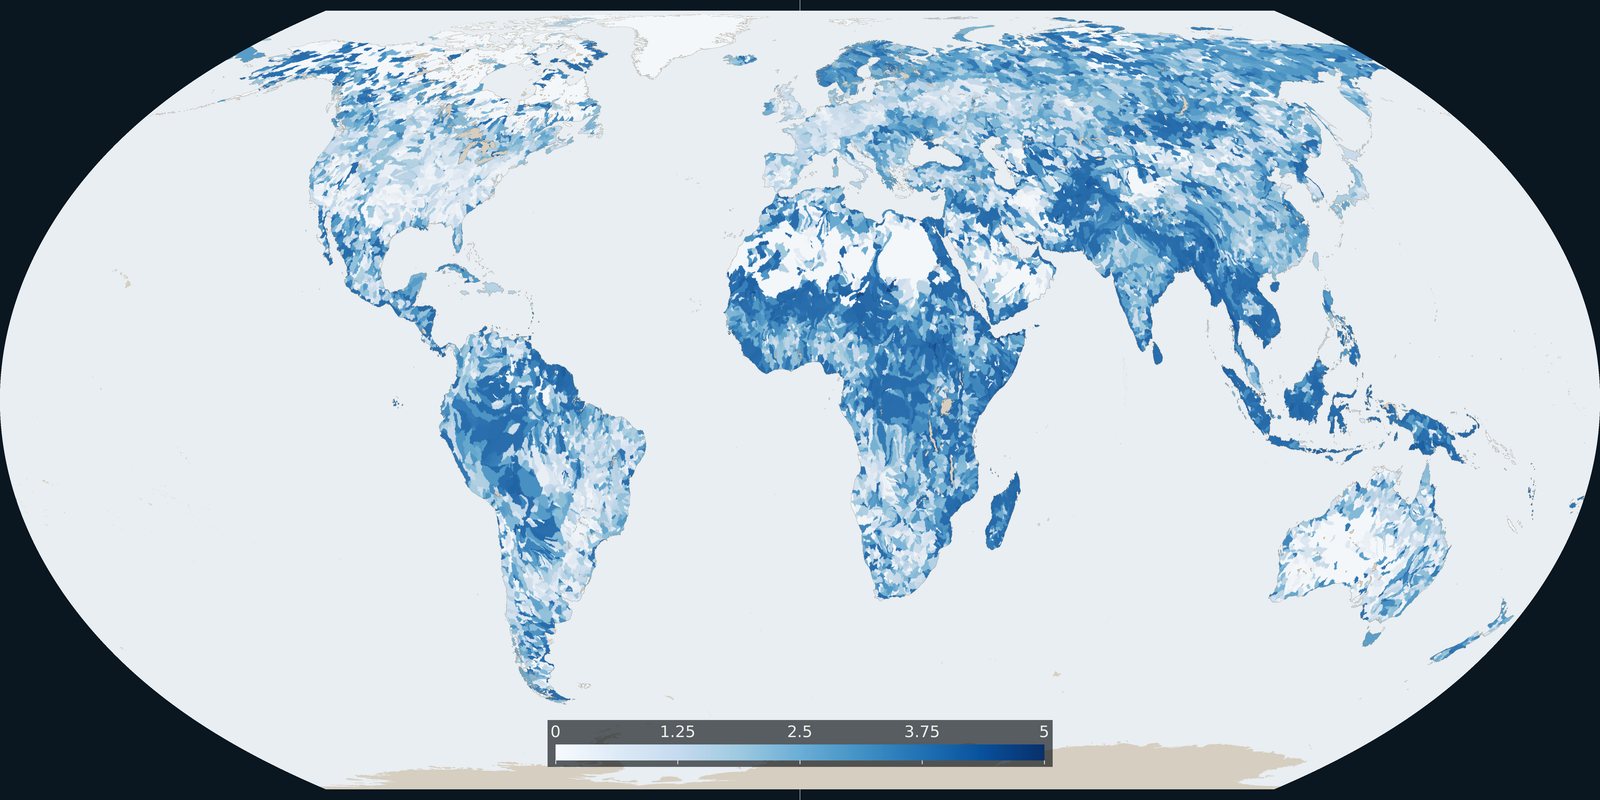
Baseline riverine flood risk from Aqueduct 4.0: a 0-5 basin score, not the water-stress score and not an inundation-depth map.
Read the card →