

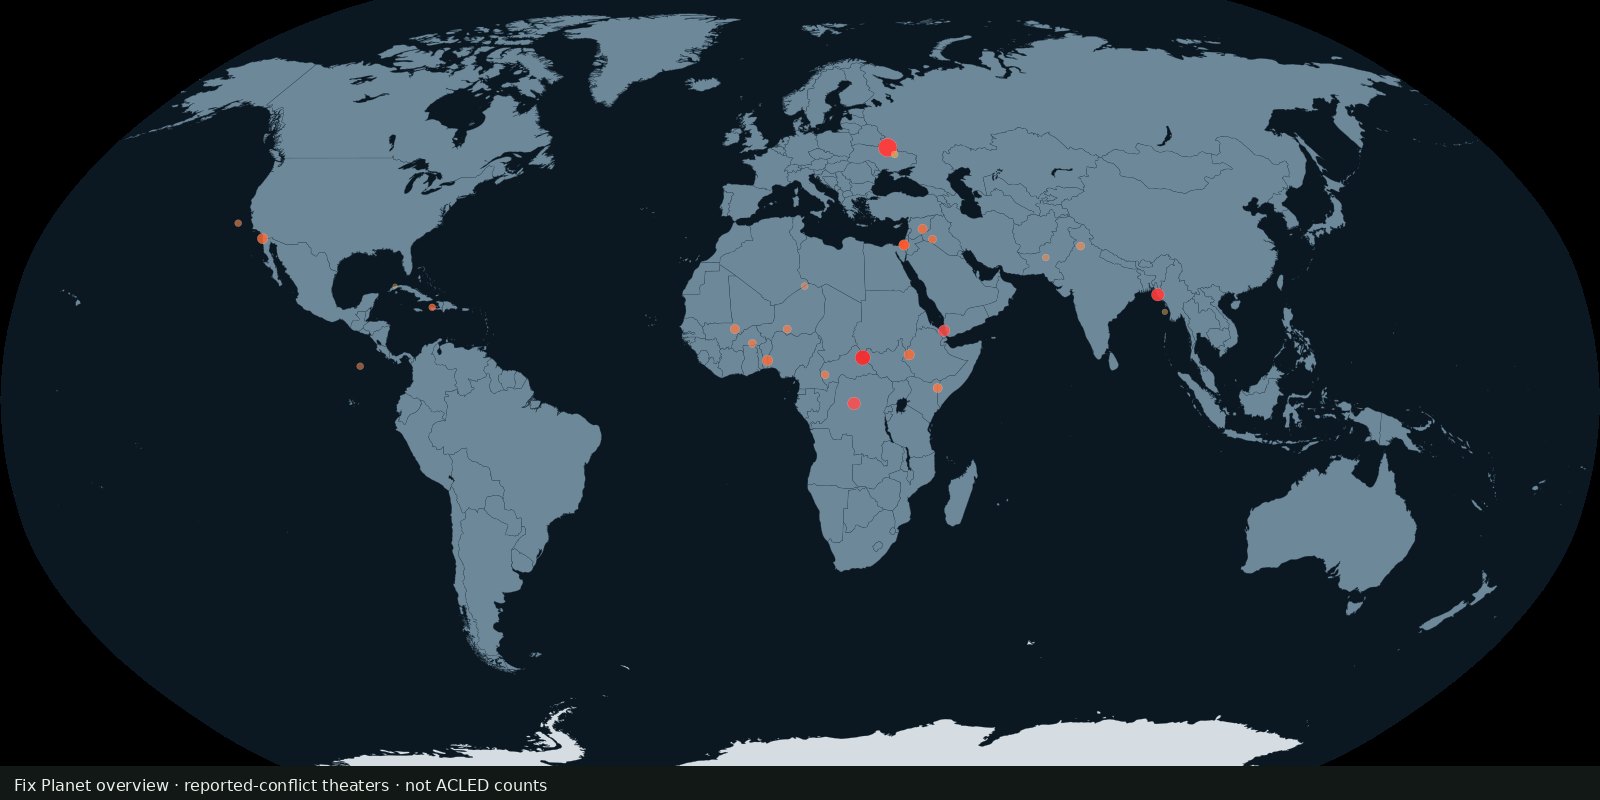
 Fix Planet overview
Conflicts
Political violence events
Where armed conflict and protest events were recorded, not a verdict on who is right.
Read the card →Country scores of state fragility across pressure and cohesion indicators, fragility risk, not battle deaths and not a peace ranking.
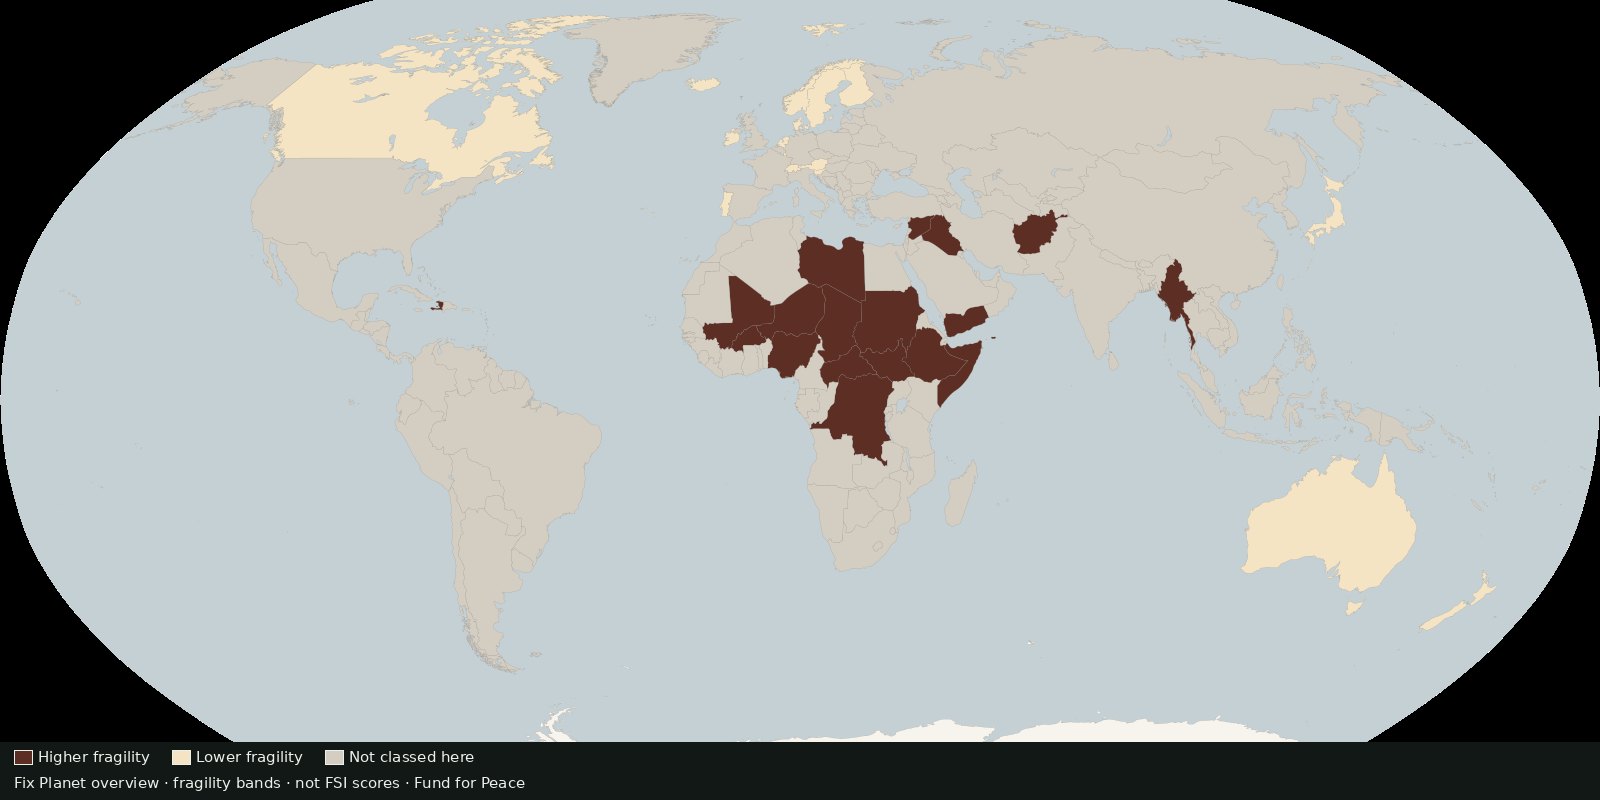
The Fragile States Index (FSI), produced by the Fund for Peace, scores countries on social, economic, and political/military pressures and on cohesion capacities. Public products include global data tables, country pages, methodology notes, and an analytics heat map. It is an annual comparative scorecard, not an event geodatabase.
Conflicts today only show events and deaths. Fragility asks whether state institutions and social cohesion are under stress, often a different geography from the loudest war theatres. Complements GPI (peacefulness) without duplicating ACLED or UCDP.
A high FSI score means higher measured fragility on FfP’s framework, not a UN listing, not a prediction that war will start tomorrow, and not a moral ranking of peoples. Indicators and years change; open methodology and global data. Do not treat the heat map as a census of every local conflict.
Not this card: GPI peacefulness ranks; ACLED pins; UCDP deaths; World Bank WGI (different product, defer).
Attribute Fund for Peace / Fragile States Index. The preview is a Fix Planet overview, not Fund for Peace’s branded heat map.
Open source map → Fix Planet overview Where armed conflict and protest events were recorded, not a verdict on who is right.
Read the card →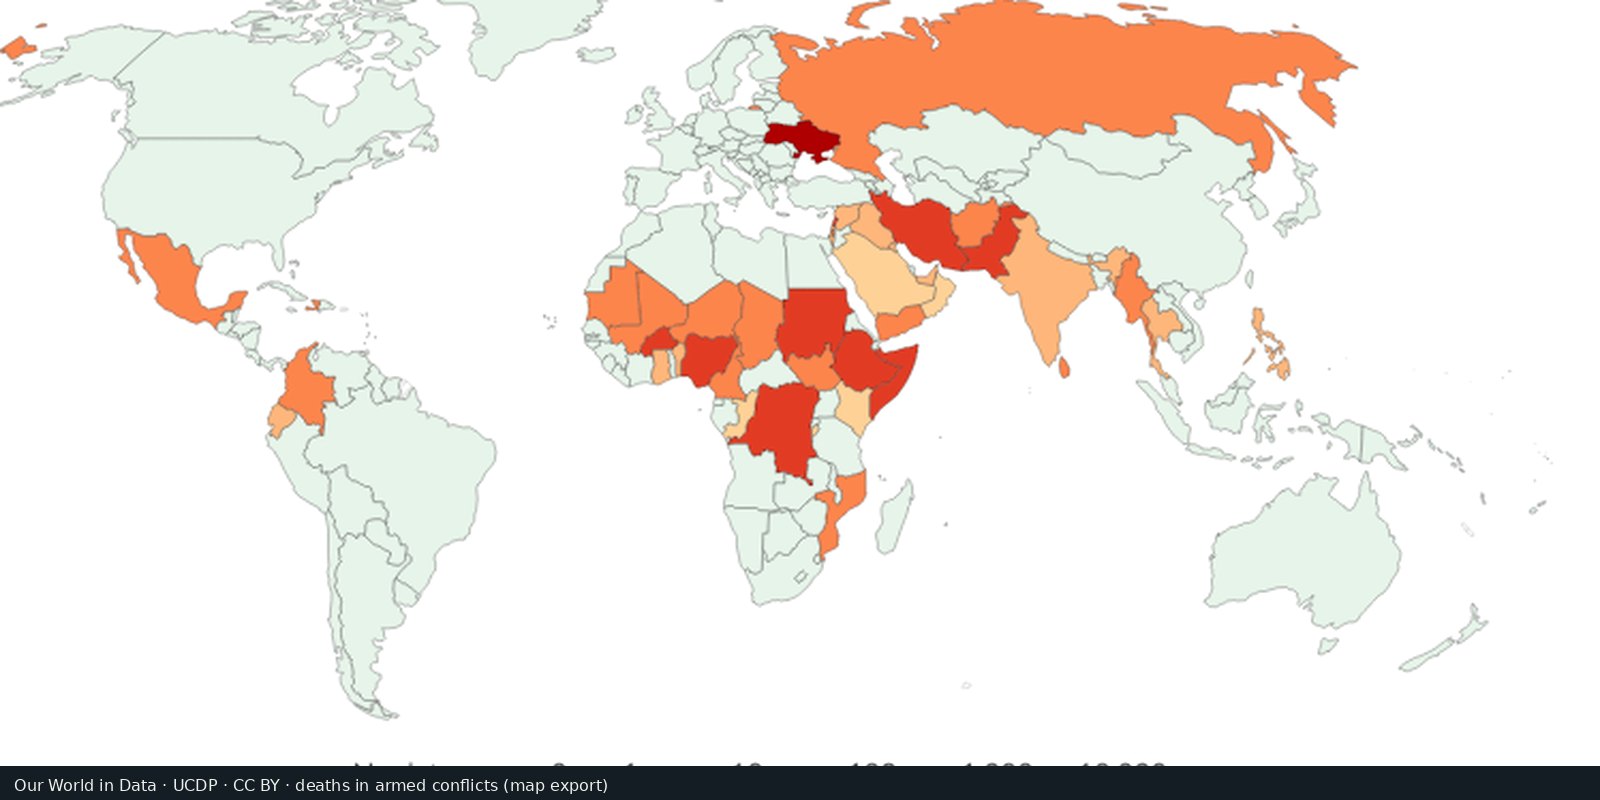
UCDP counts of people killed in organized armed conflict, compiled for comparison over time.
Read the card →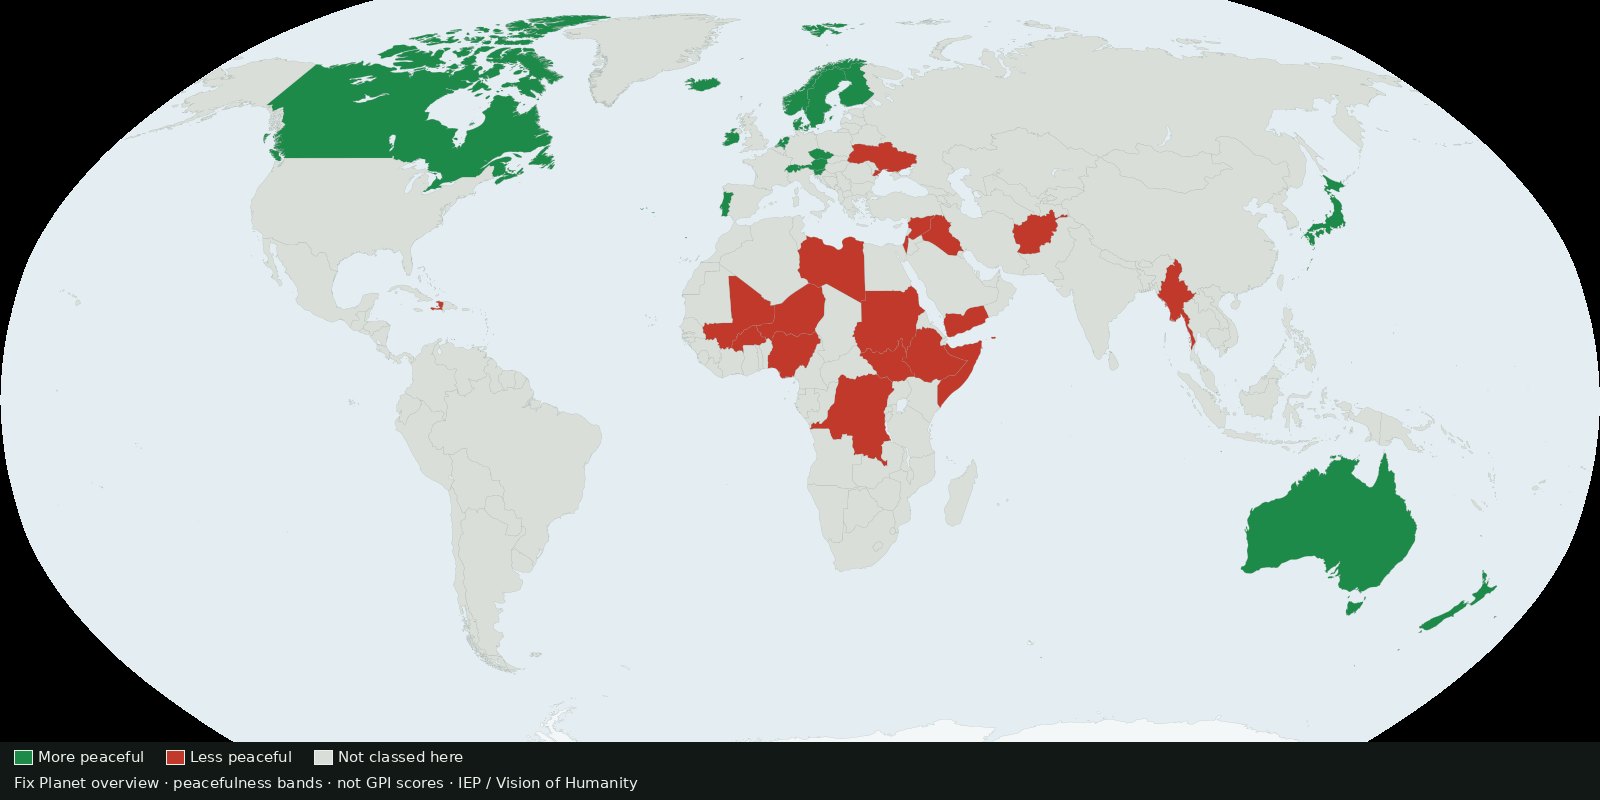 Fix Planet overview
Country ranking of peacefulness from the Institute for Economics & Peace: a composite score, not ACLED event pins and not a verdict on who is right.
Read the card →Source: Institute for Economics & Peace / Vision of Humanity: Global Peace Index
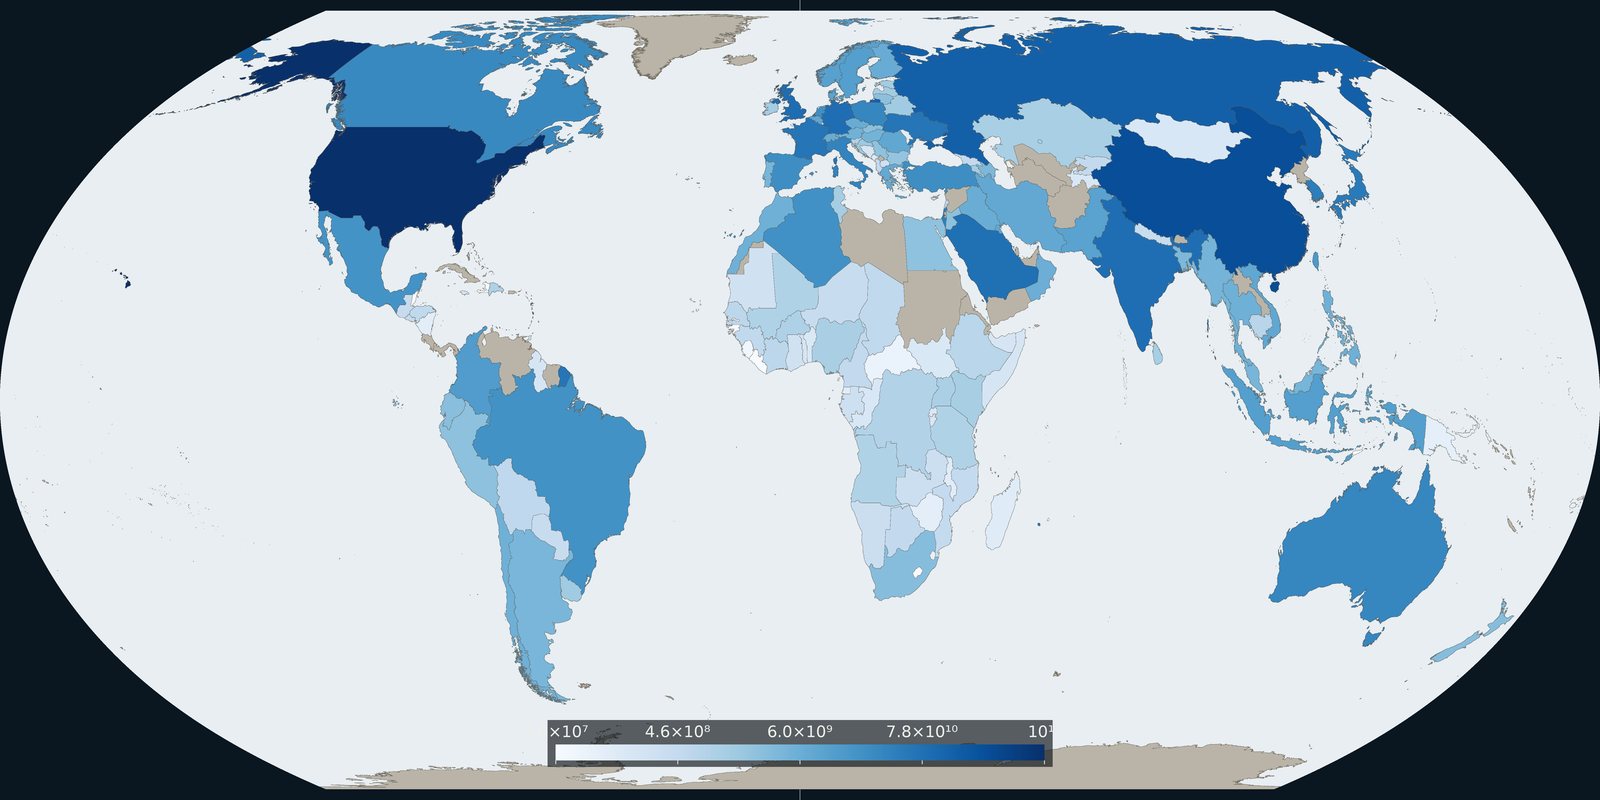
Comparable country series of military spending from SIPRI, budgets and burden, not event pins and not a catalog of weapon systems.
Read the card →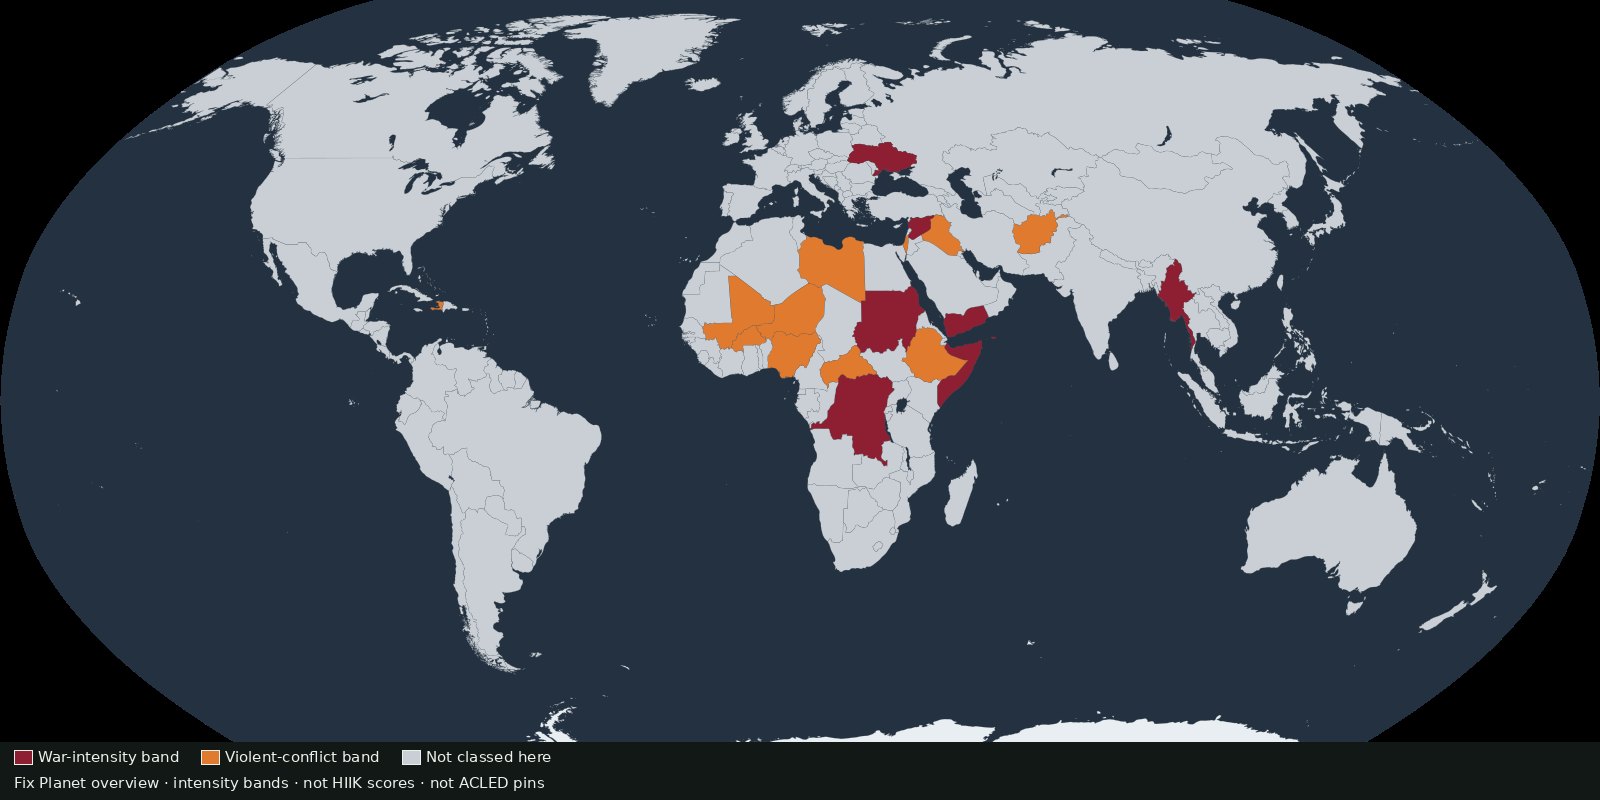 Fix Planet overview
Annual conflict intensity by country and region from Heidelberg’s Conflict Barometer, intensity classes, not event pins and not battle-death totals.
Read the card →