

Population
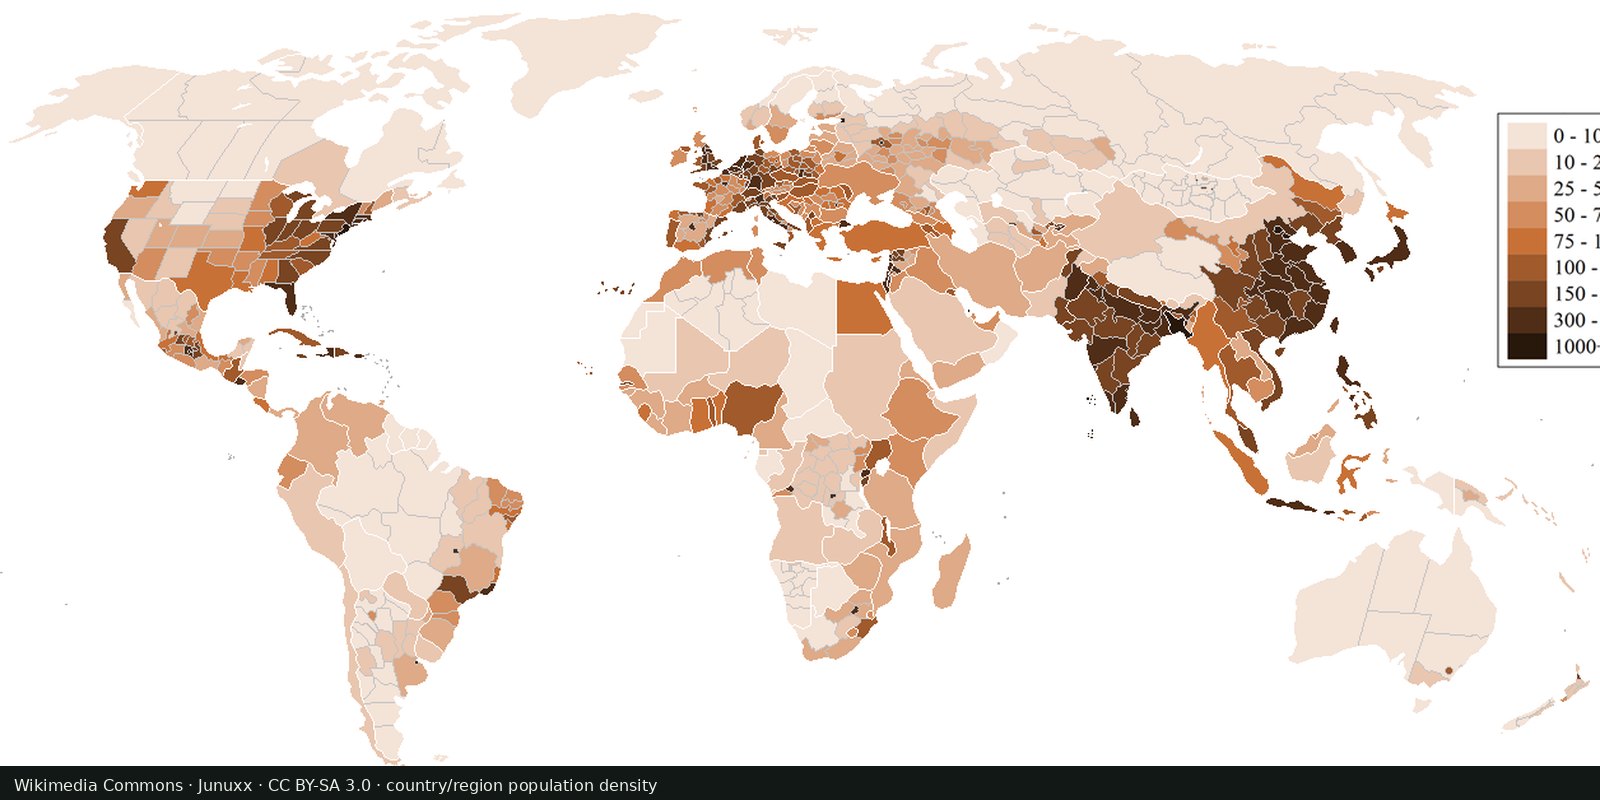
Population density
Where people live, gridded: NASA SEDAC GPW and WorldPop, models fitted to censuses, not a headcount of every street.
Read the card →The 2024 annual rate of population change in each country, from the same UN medium variant.
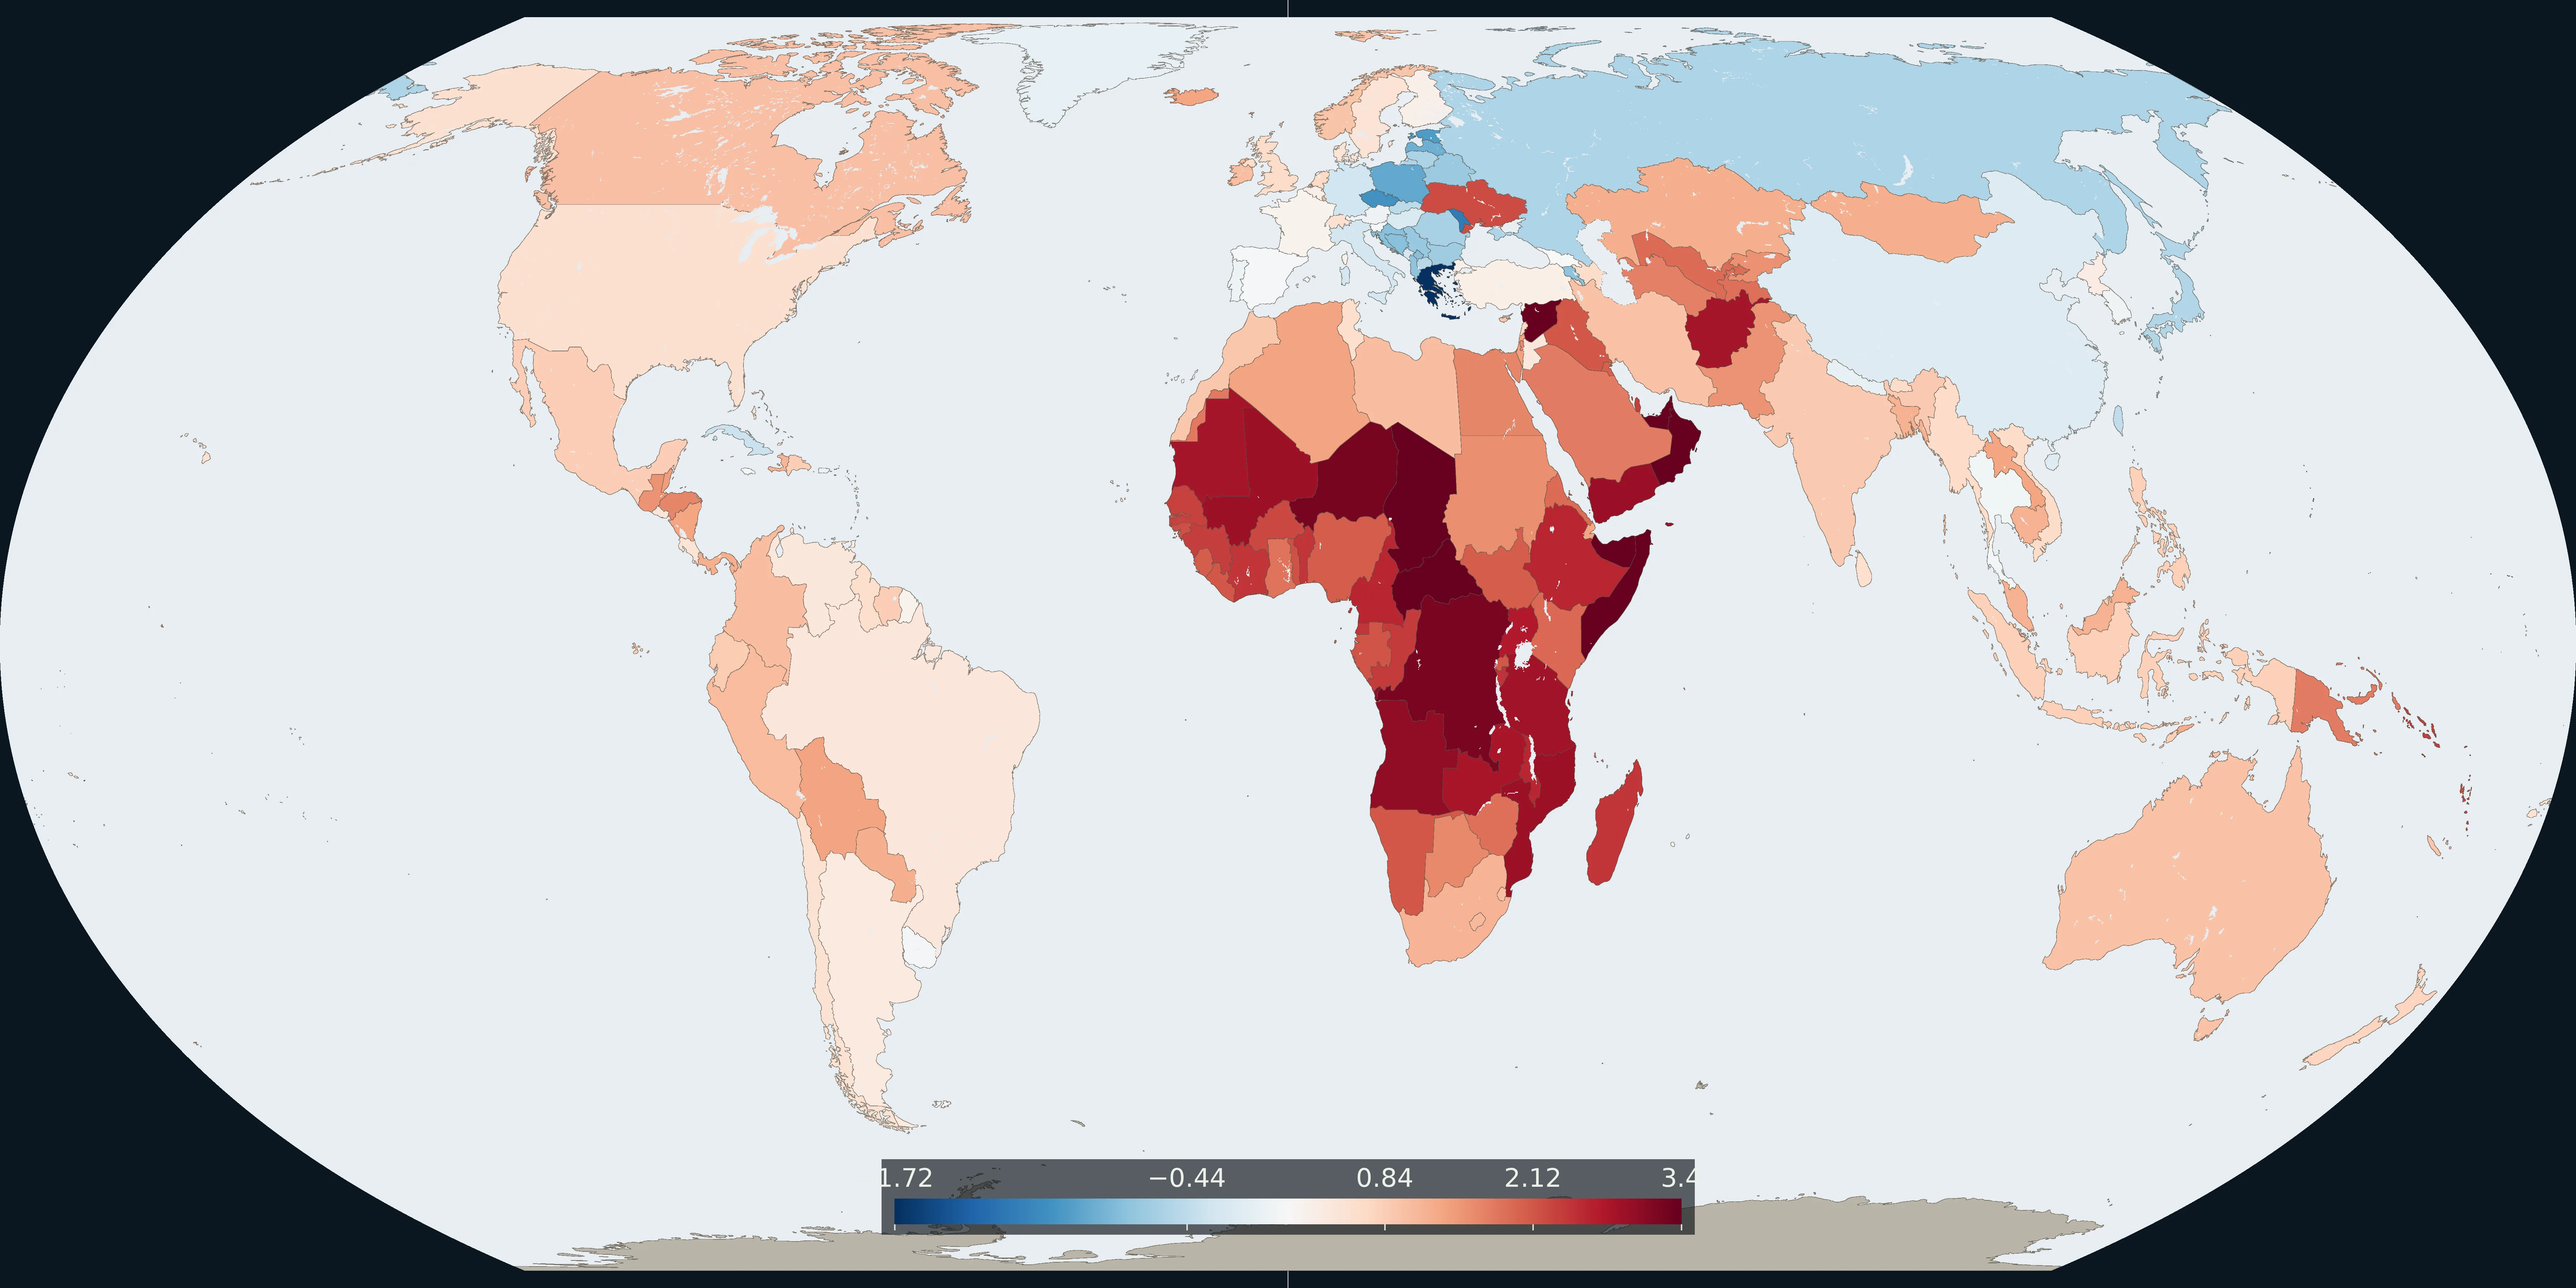
Map: Fix Planet from UN World Population Prospects 2024, medium variant, 2024 population growth rate. The number is percent per year, centered at zero. Boundaries: Natural Earth 1:50m.
Each country is coloured by its 2024 population growth rate in the UN World Population Prospects 2024 medium variant, in percent per year. The scale runs from about −1.7 to 3.4 and is centered at zero. Of the countries drawn, 60 have a negative rate. Rates above 3 percent in this table include Angola (3.0), the Democratic Republic of the Congo (3.2), Niger (3.3), the Central African Republic (3.4) and Somalia (3.4).
A large population can change slowly. In this table China’s 2024 rate is −0.2 percent, while several smaller countries are above 3 percent. The plate is the rate, not the number of people.
Blue is a falling population, the pale middle is near zero, and red is growth. The bar is percent per year. The rate combines births, deaths and migration. It is not fertility alone.
The ends of the scale are the 2nd and 98th percentiles of the countries drawn, so a few faster and slower areas share the end colours. The same small areas missing from the population plate are missing here. This is not a map of the year a population reached its peak.
UN DESA Population Division, World Population Prospects 2024, demographic indicators, medium variant, 2024 population growth rate. Boundaries: Natural Earth 1:50m, public domain.
Open source map → Where people live, gridded: NASA SEDAC GPW and WorldPop, models fitted to censuses, not a headcount of every street.
Read the card →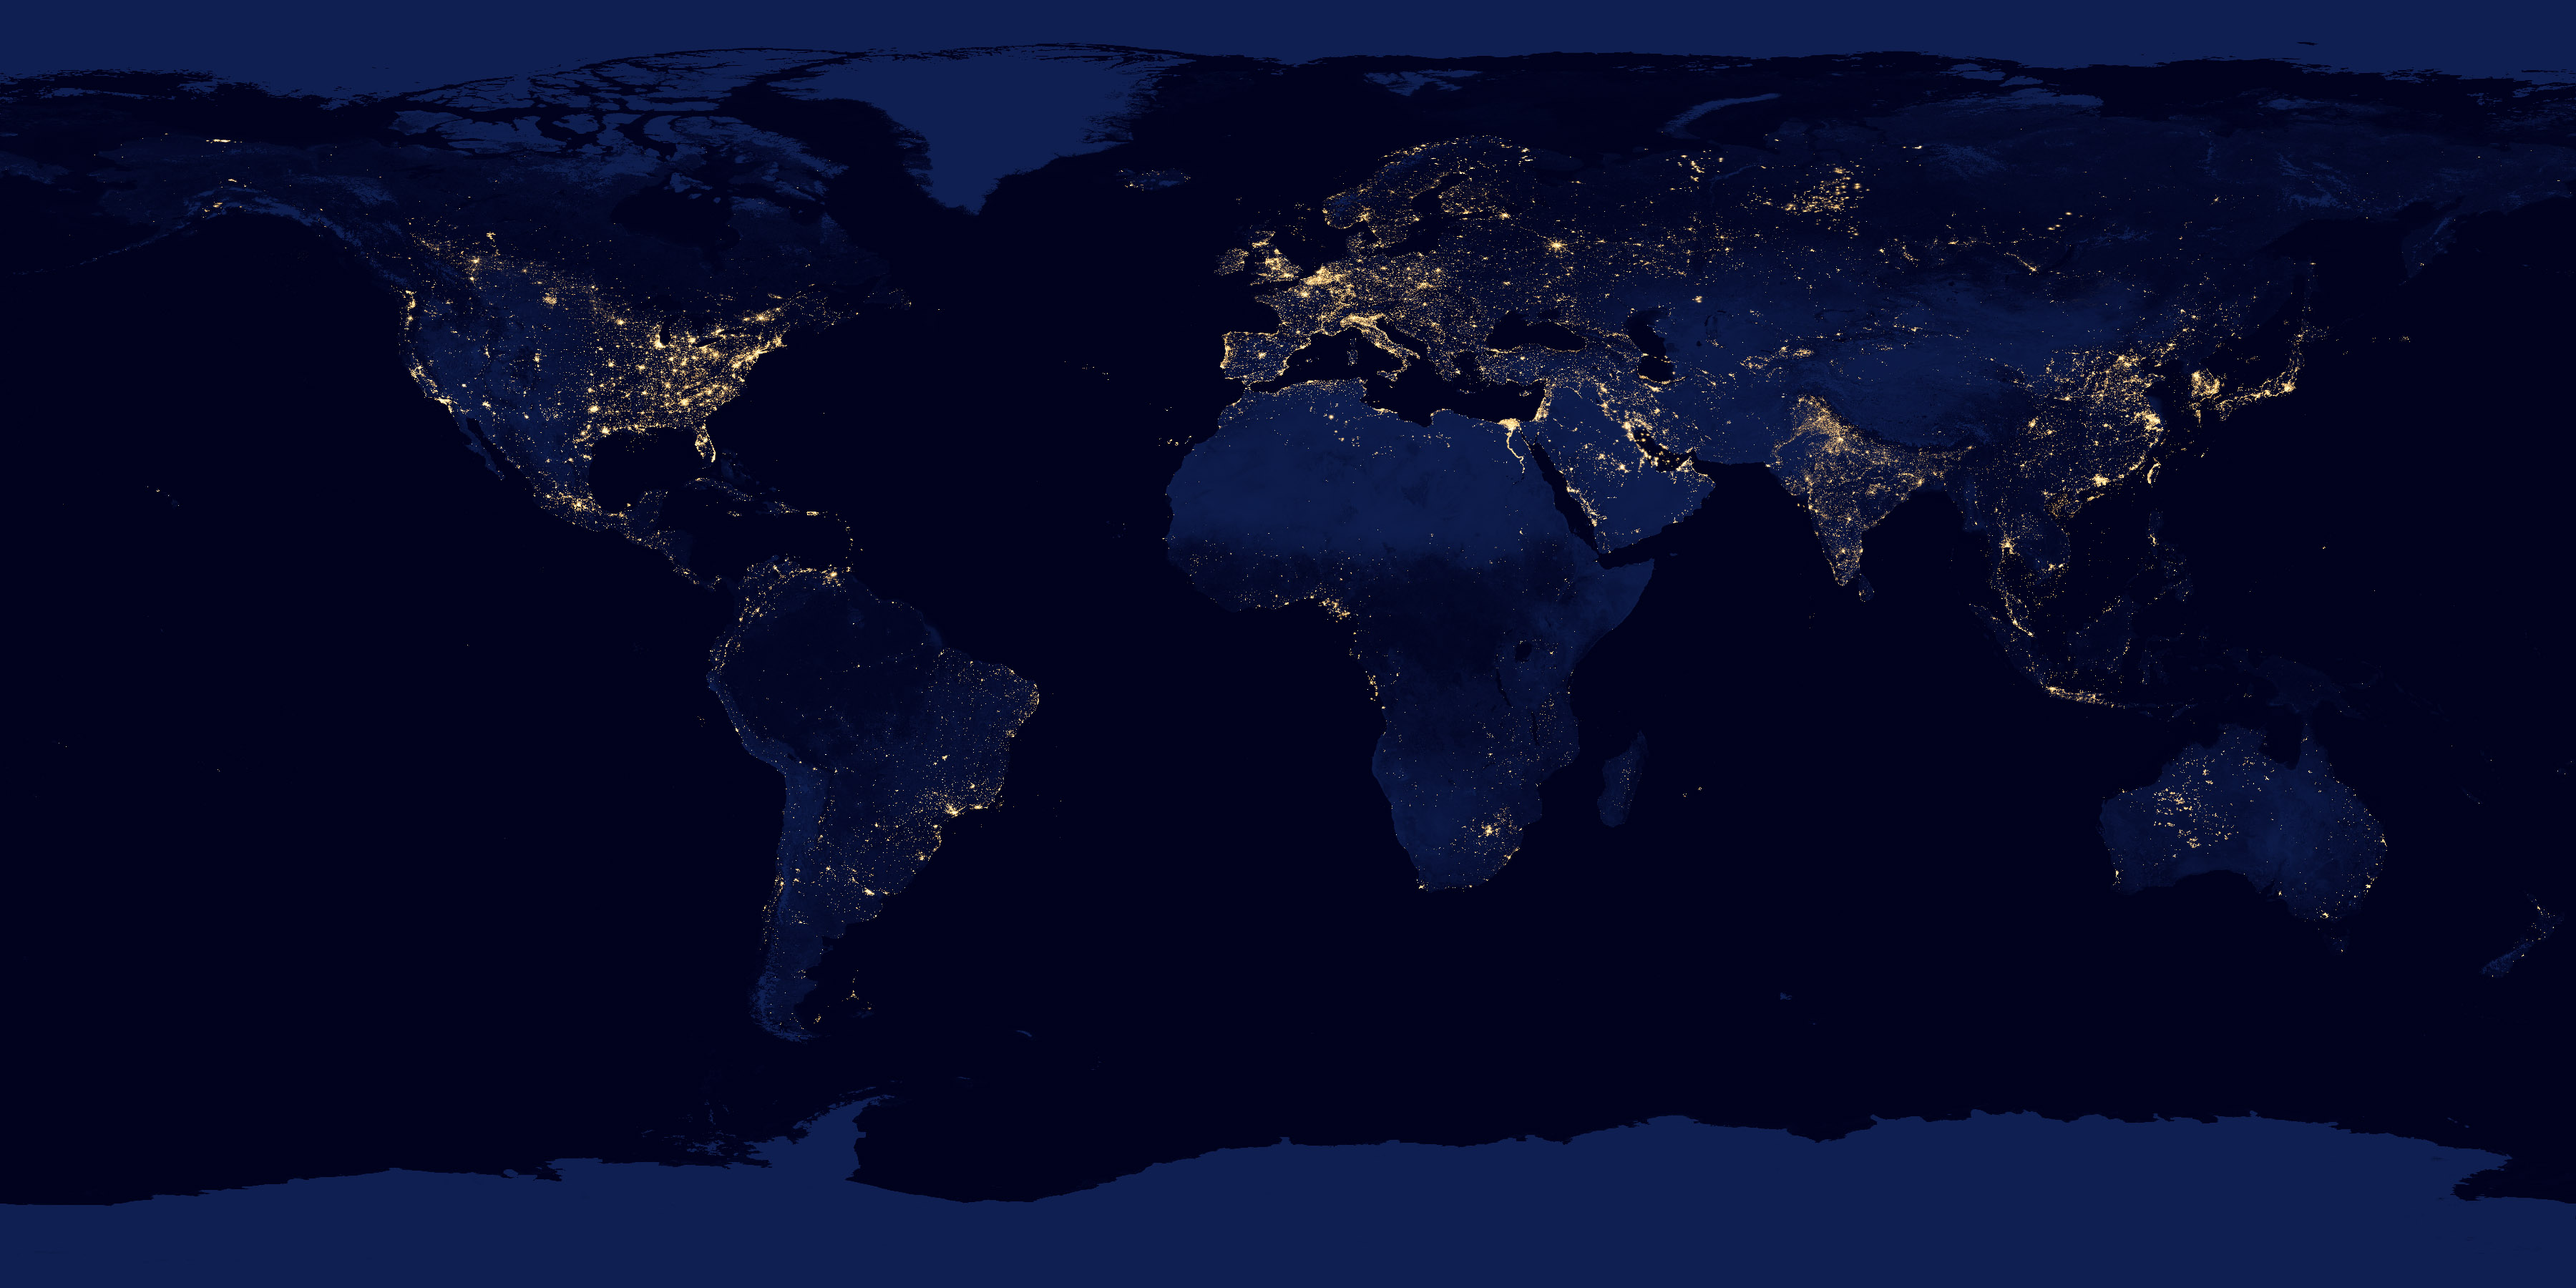
NASA Black Marble: city lights and gas flares as seen from orbit, a picture of electrified settlement.
Read the card →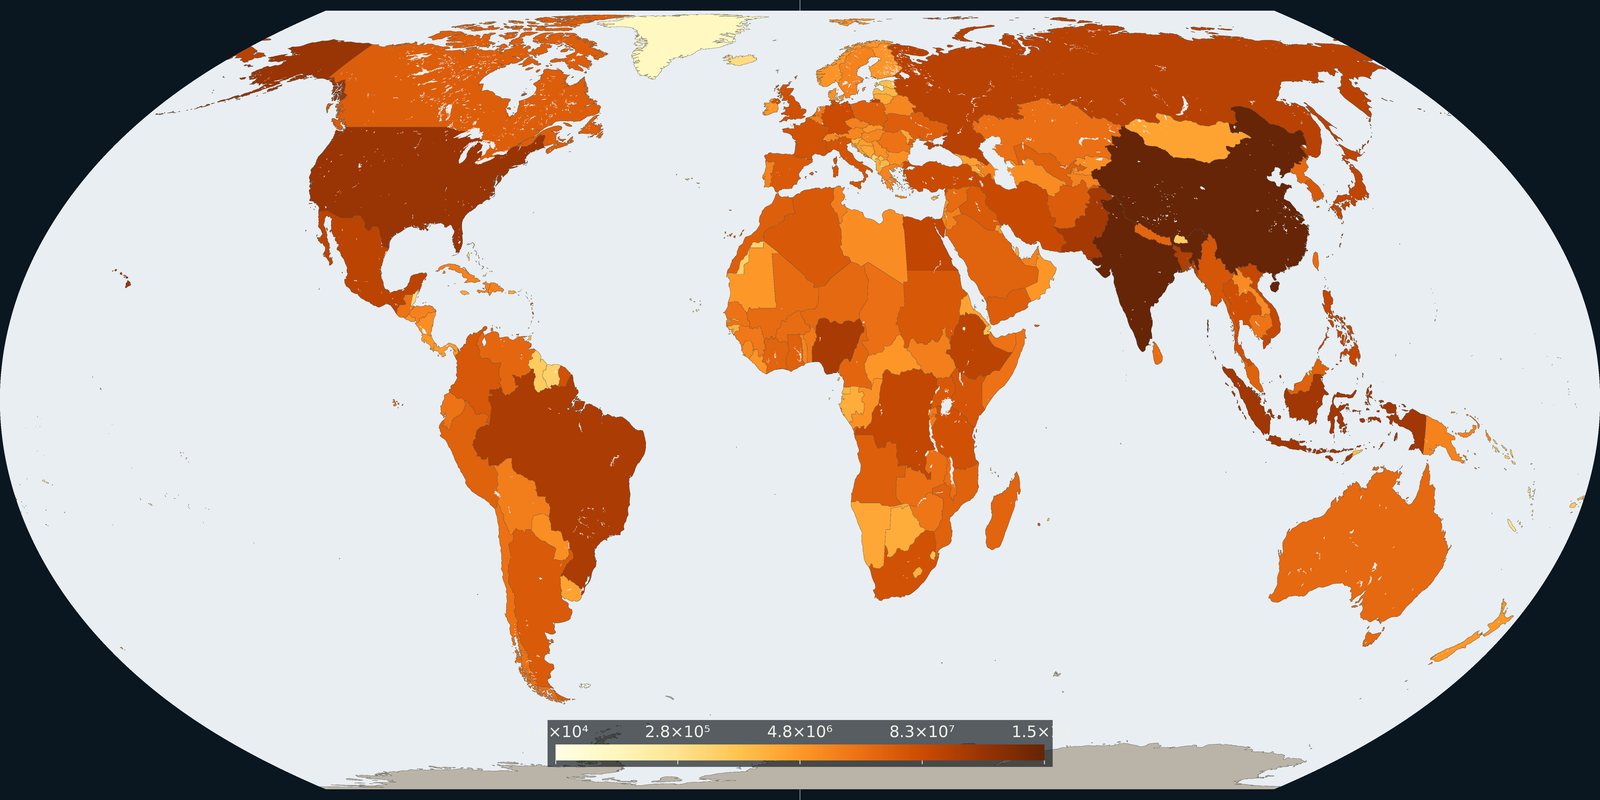
How many people live in each country on 1 July 2024, from the UN medium-variant estimates.
Read the card →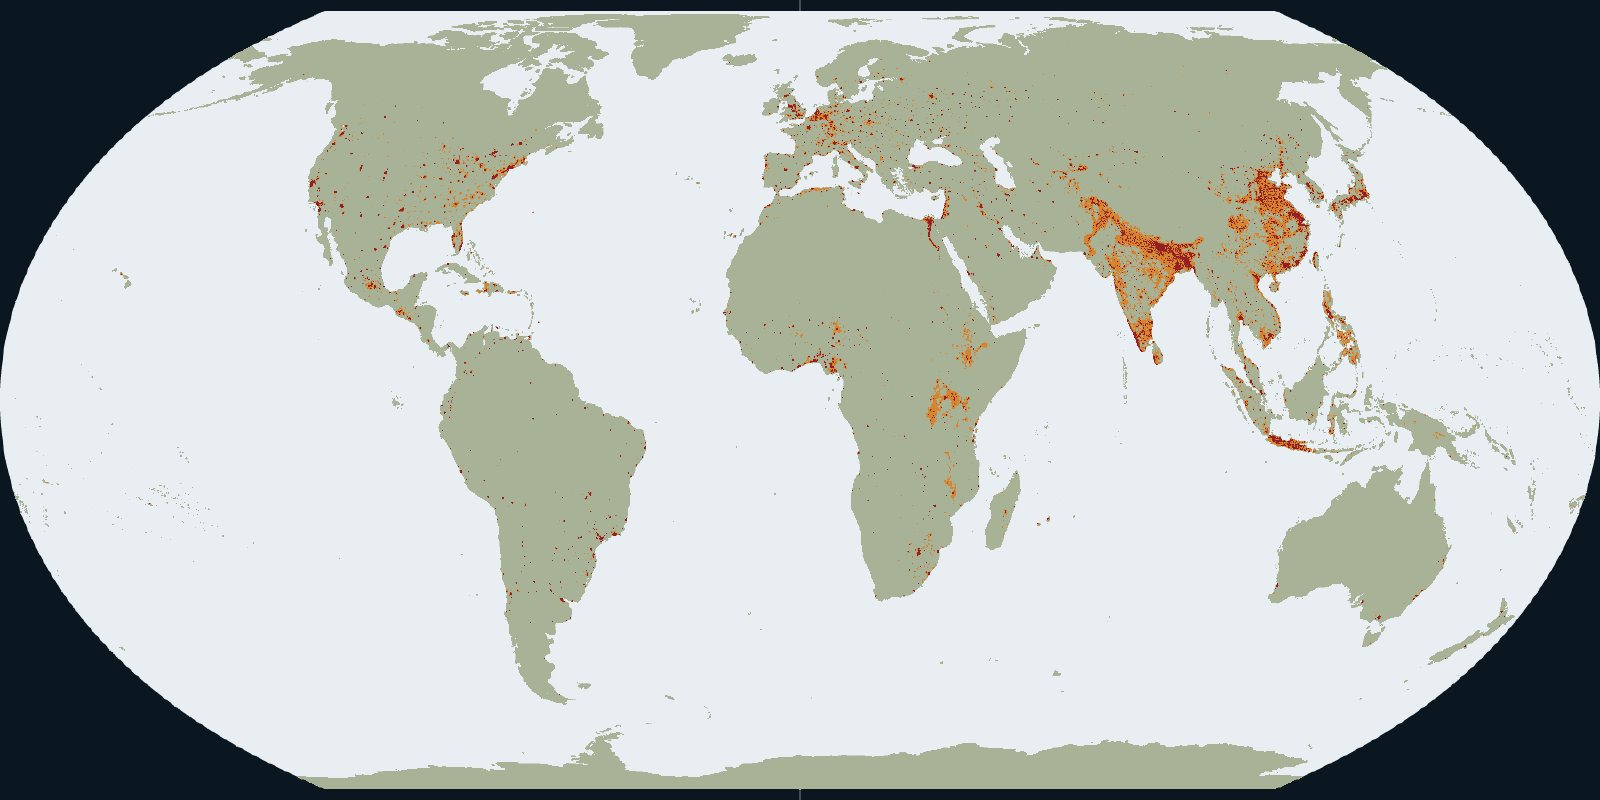
Urban centres, towns and rural land in the GHSL settlement grid for 2020.
Read the card →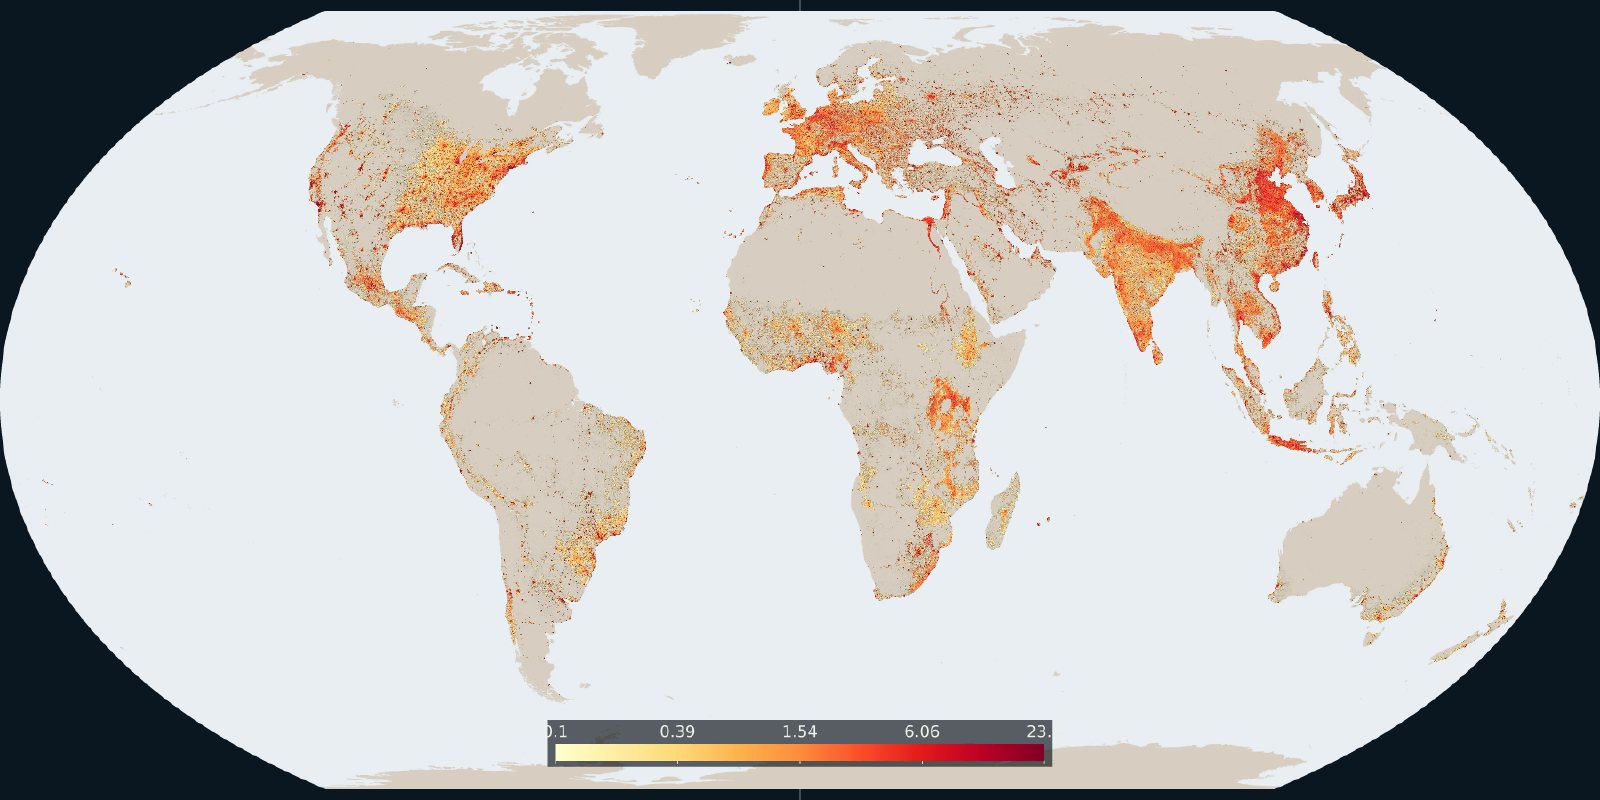
How much of each cell is built-up surface in the 2020 GHSL grid.
Read the card →