

Population
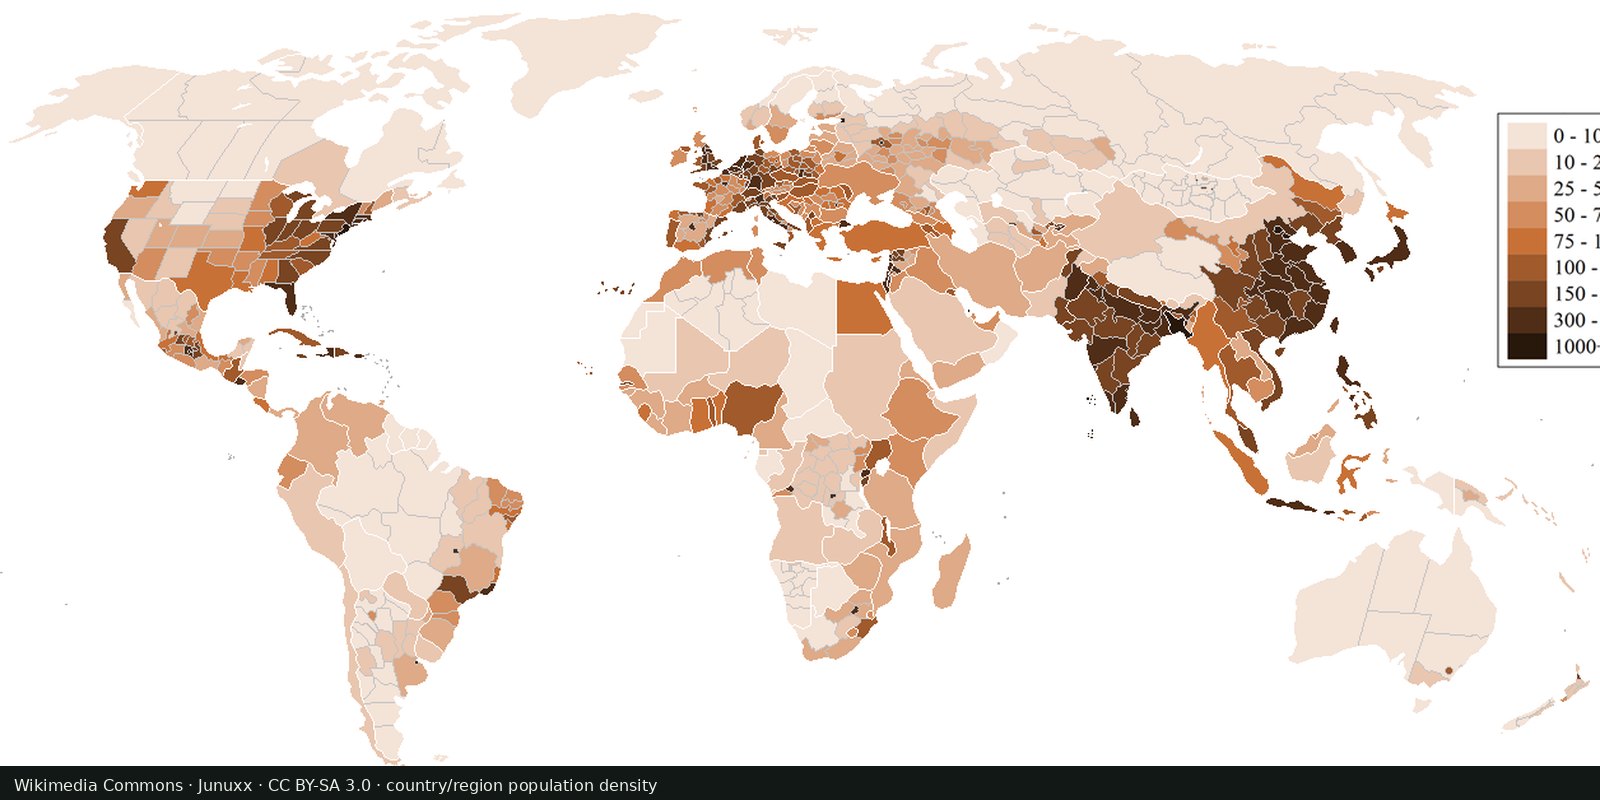
Population density
Where people live, gridded: NASA SEDAC GPW and WorldPop, models fitted to censuses, not a headcount of every street.
Read the card →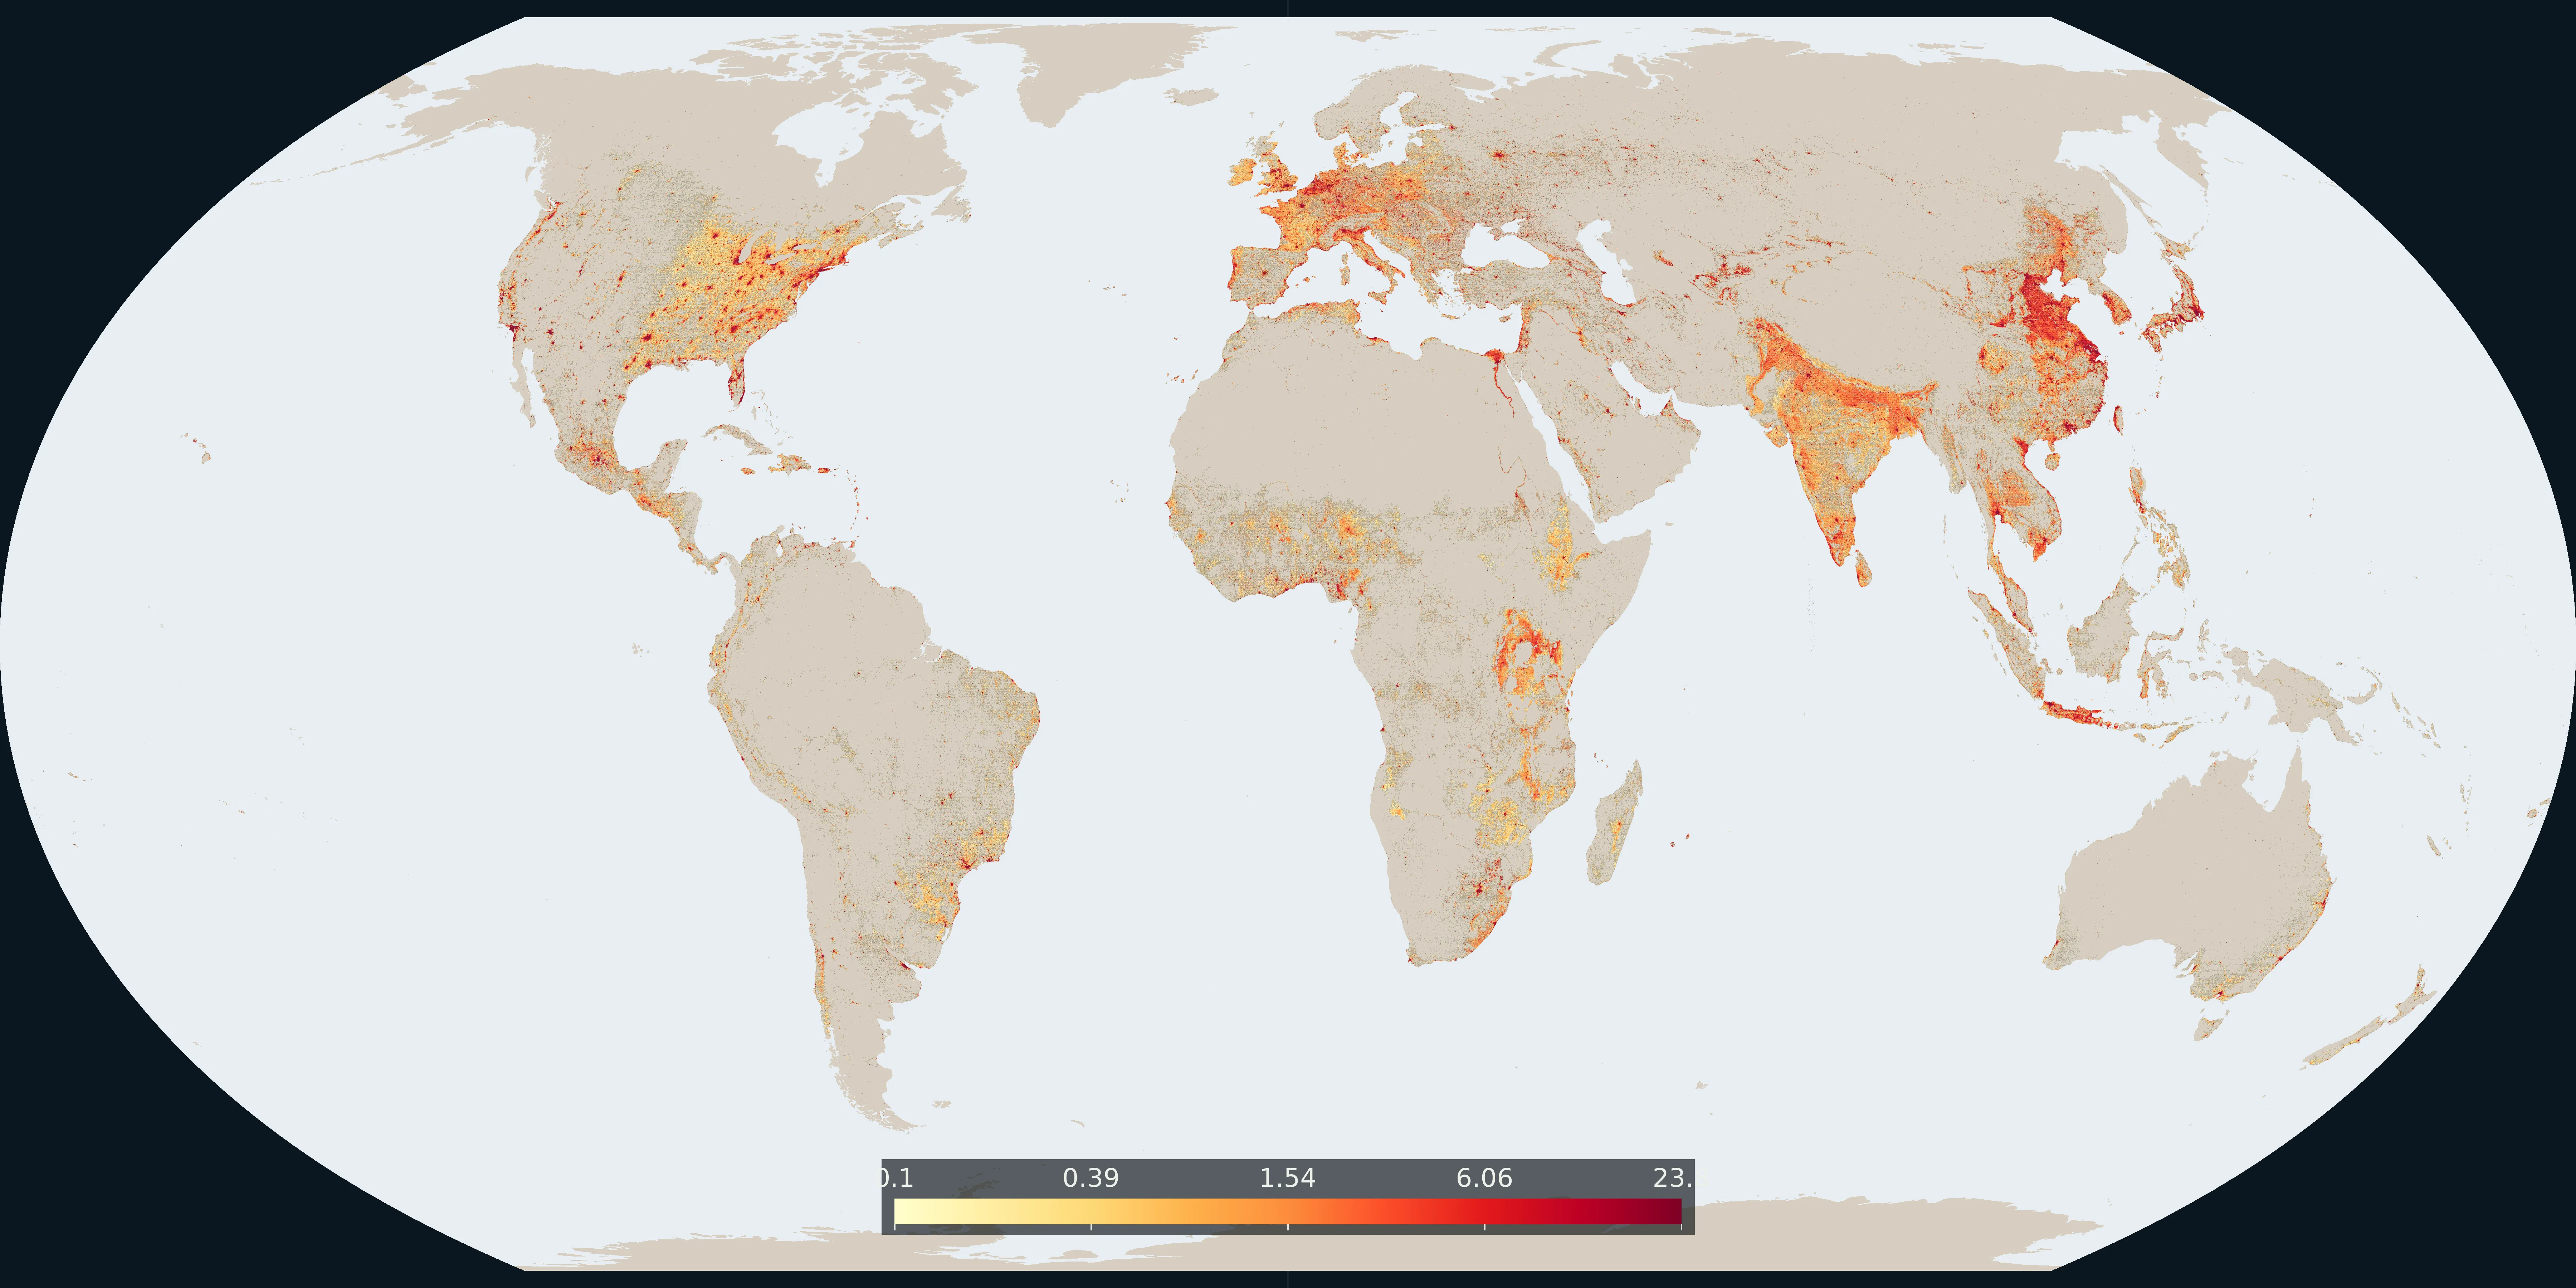
Map: Fix Planet from the European Commission GHSL GHS-BUILT-S R2023A, 2020 epoch. The number is the percent of each 0.02° cell that is built-up surface, on a log scale from 0.1. CC BY 4.0. Boundaries: Natural Earth.
The plate sums GHS-BUILT-S R2023A built-up surface for the 2020 epoch, the latest epoch in that release built from satellite observations. Square metres from the 30 arc-second grid are added inside each 0.02° cell and divided by the area of that cell. The colour is that percent, on a log scale from 0.1 to about 24. Cells under 0.1 percent stay the base land colour. The top of the bar is the 99.5th percentile of cells that have any built-up surface.
Built-up surface is the ground covered by buildings. It is not the number of people and not the lights seen at night.
Yellow to deep red is a larger share of the cell. The number on the bar is percent of the 0.02° cell. A cell can pass 0.1 percent with a dense district or with a thinner scatter of buildings.
The value is built-up surface divided by the area of the cell, not floor space stacked in towers and not a legal city boundary. Ocean and lakes are not coloured. Aside: the 2025 and 2030 epochs in the same release are model projections, and they are not this map.
European Commission Joint Research Centre, GHSL GHS-BUILT-S R2023A, 2020 epoch, CC BY 4.0. Aggregated to a 0.02° grid. Boundaries: Natural Earth.
Open source map → Where people live, gridded: NASA SEDAC GPW and WorldPop, models fitted to censuses, not a headcount of every street.
Read the card →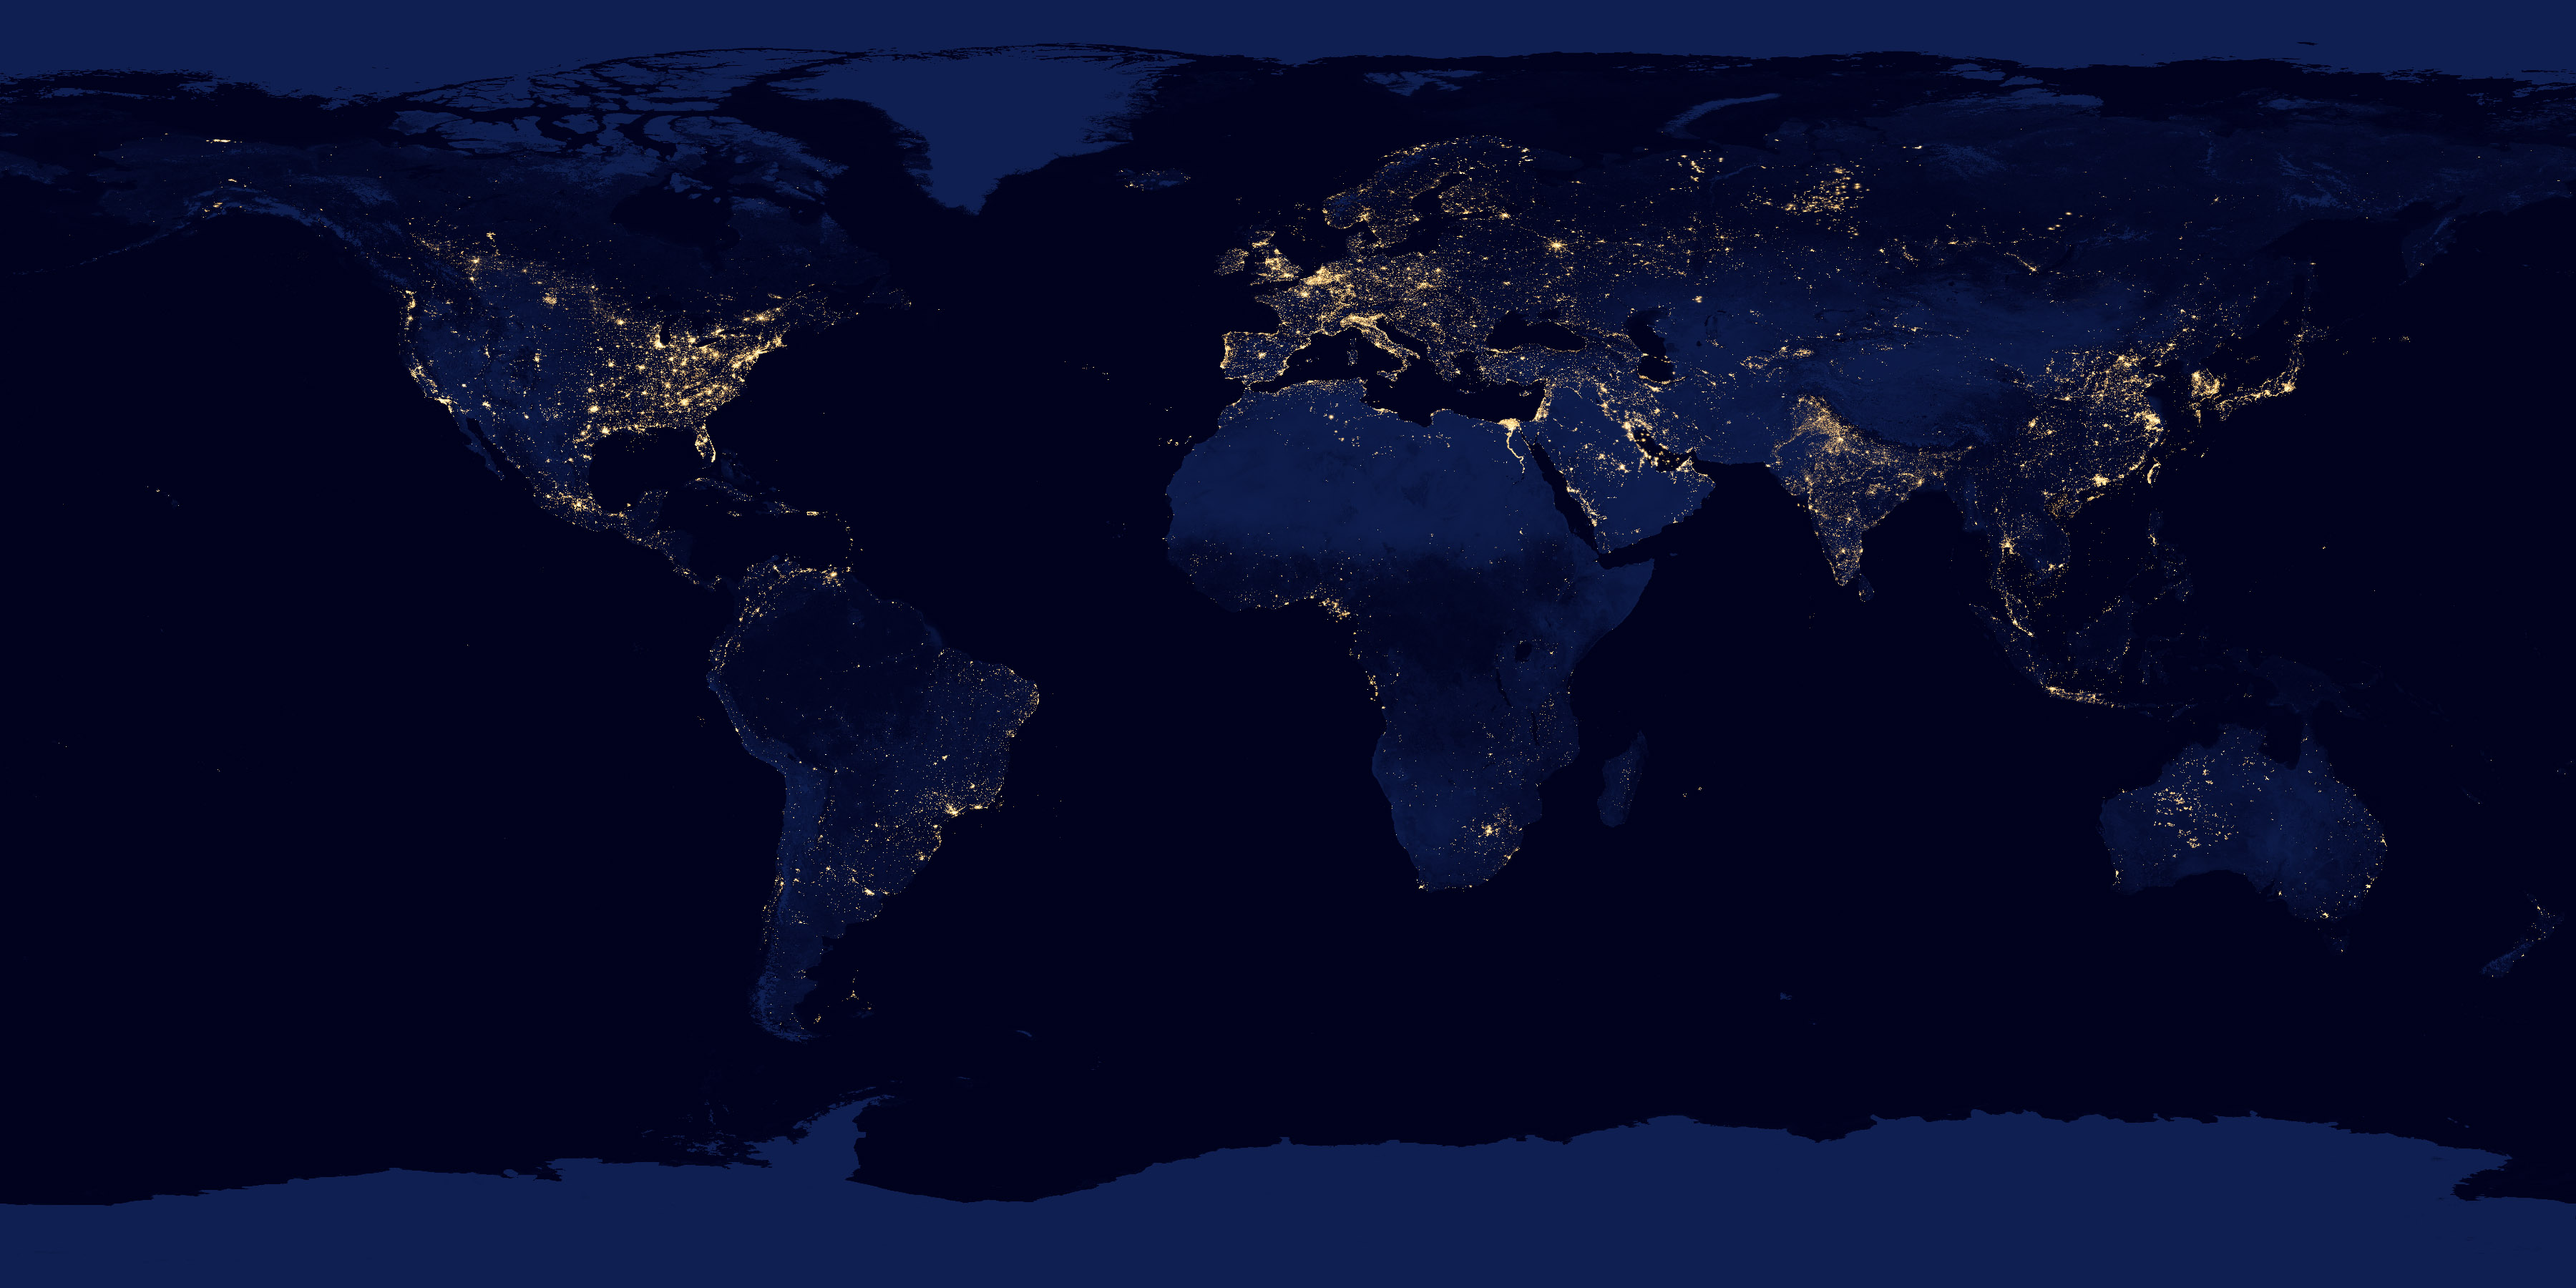
NASA Black Marble: city lights and gas flares as seen from orbit, a picture of electrified settlement.
Read the card →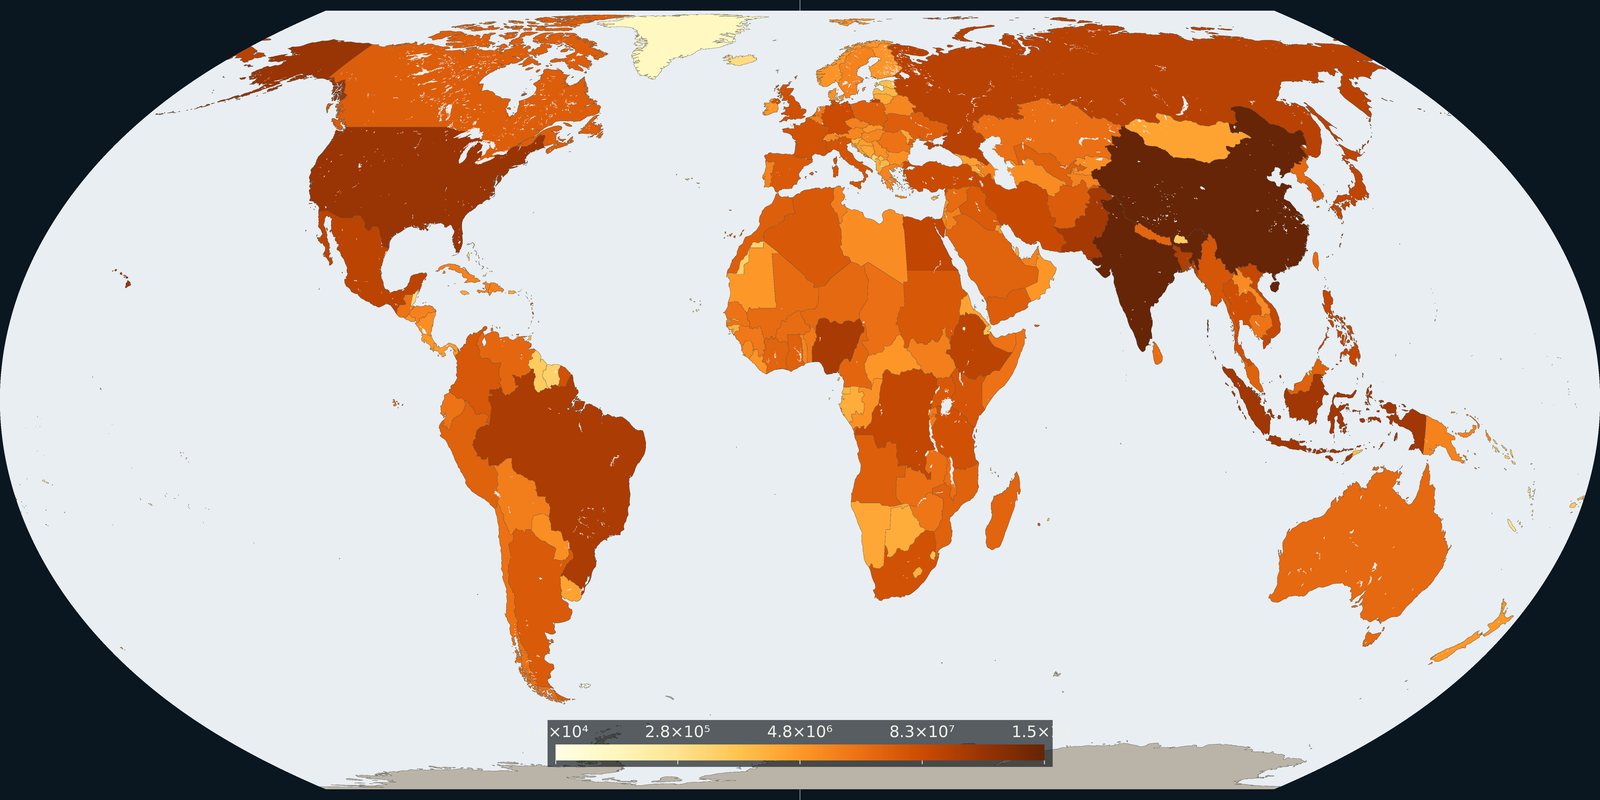
How many people live in each country on 1 July 2024, from the UN medium-variant estimates.
Read the card →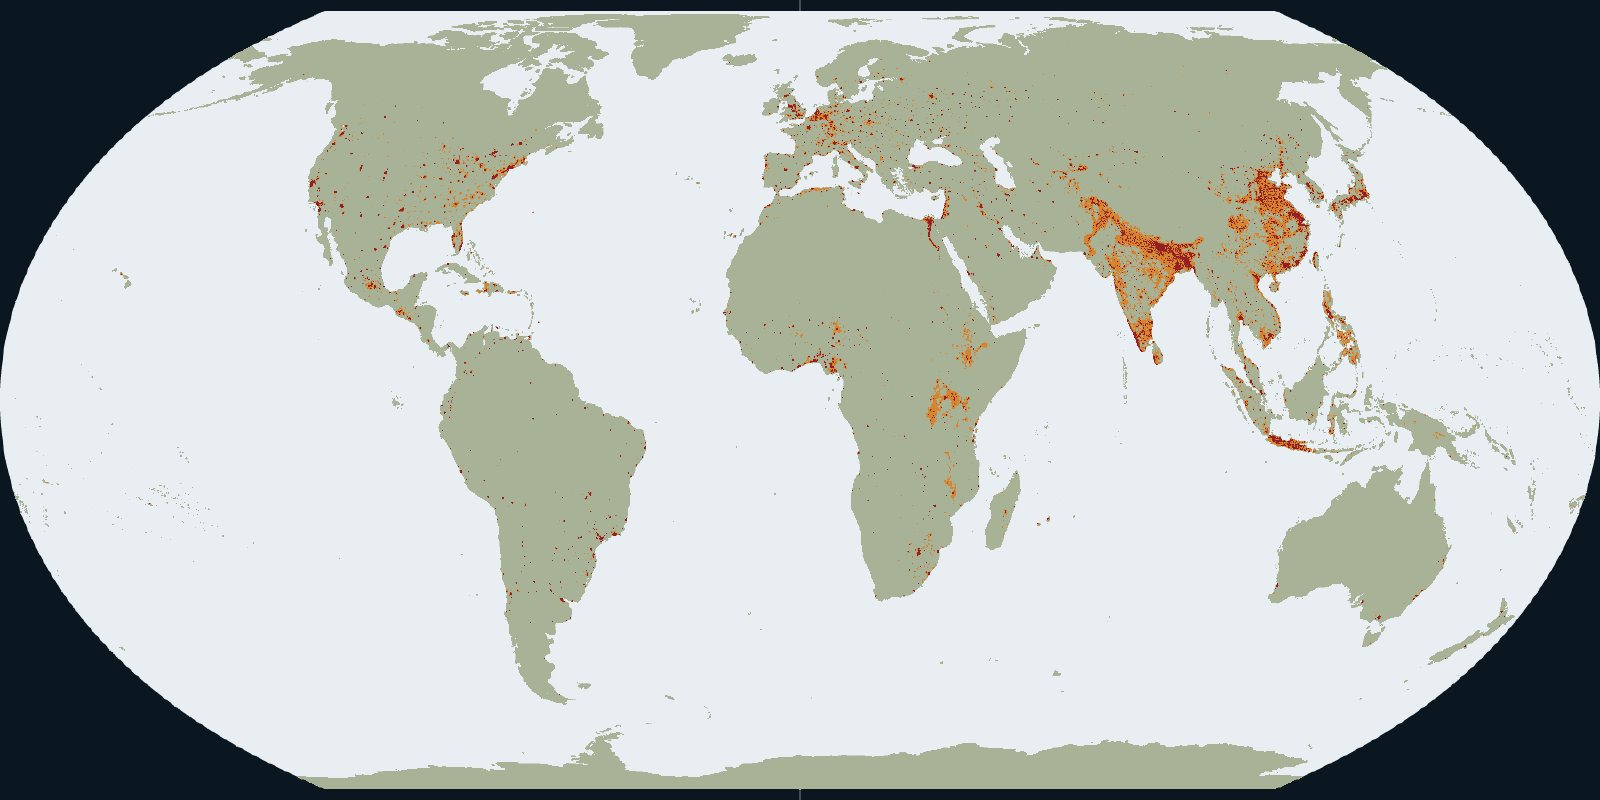
Urban centres, towns and rural land in the GHSL settlement grid for 2020.
Read the card →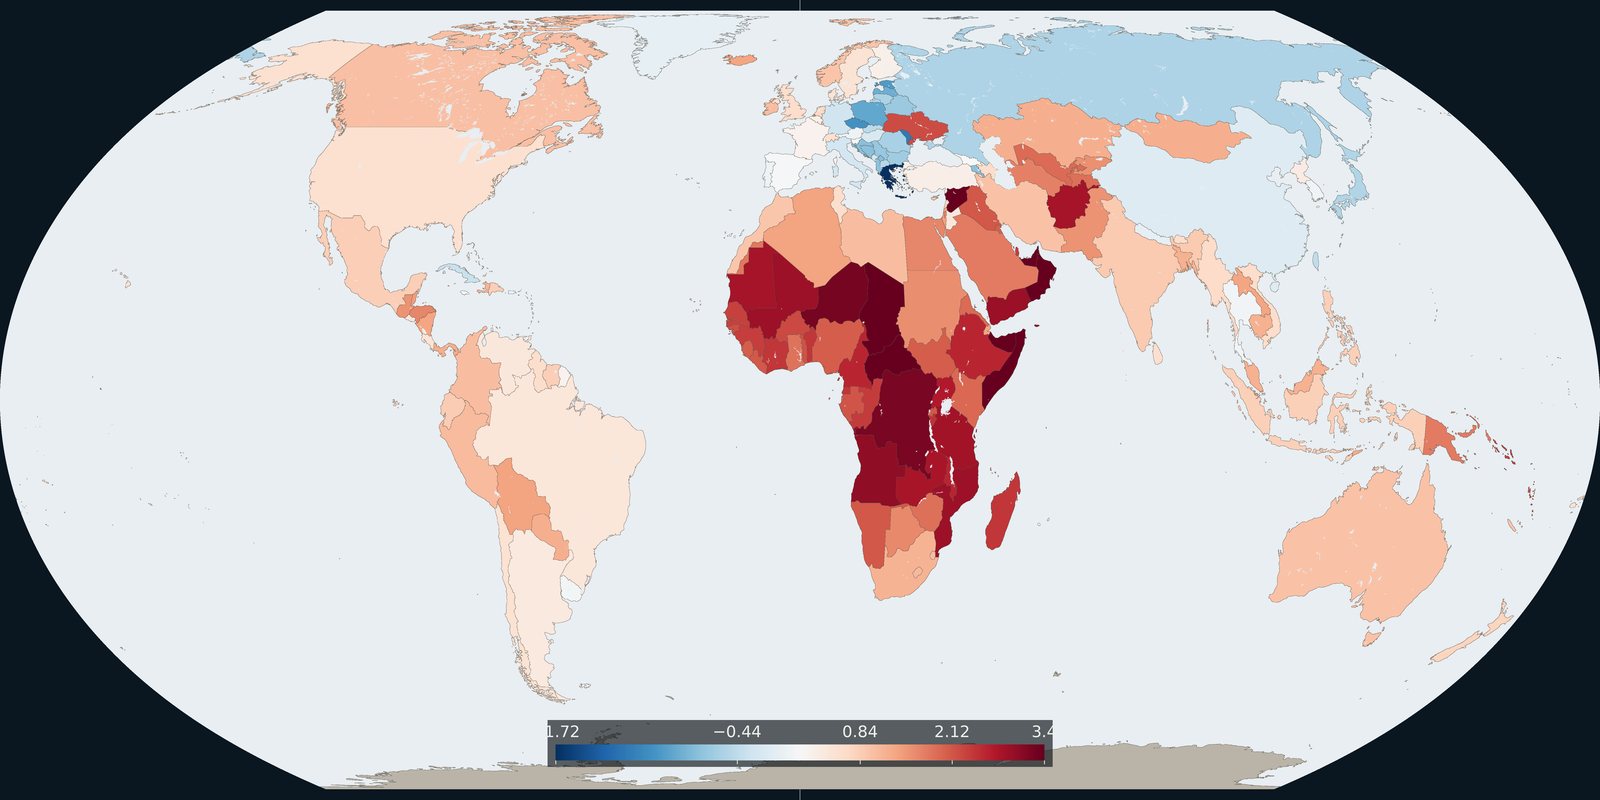
The 2024 annual rate of population change in each country, from the same UN medium variant.
Read the card →