

Population
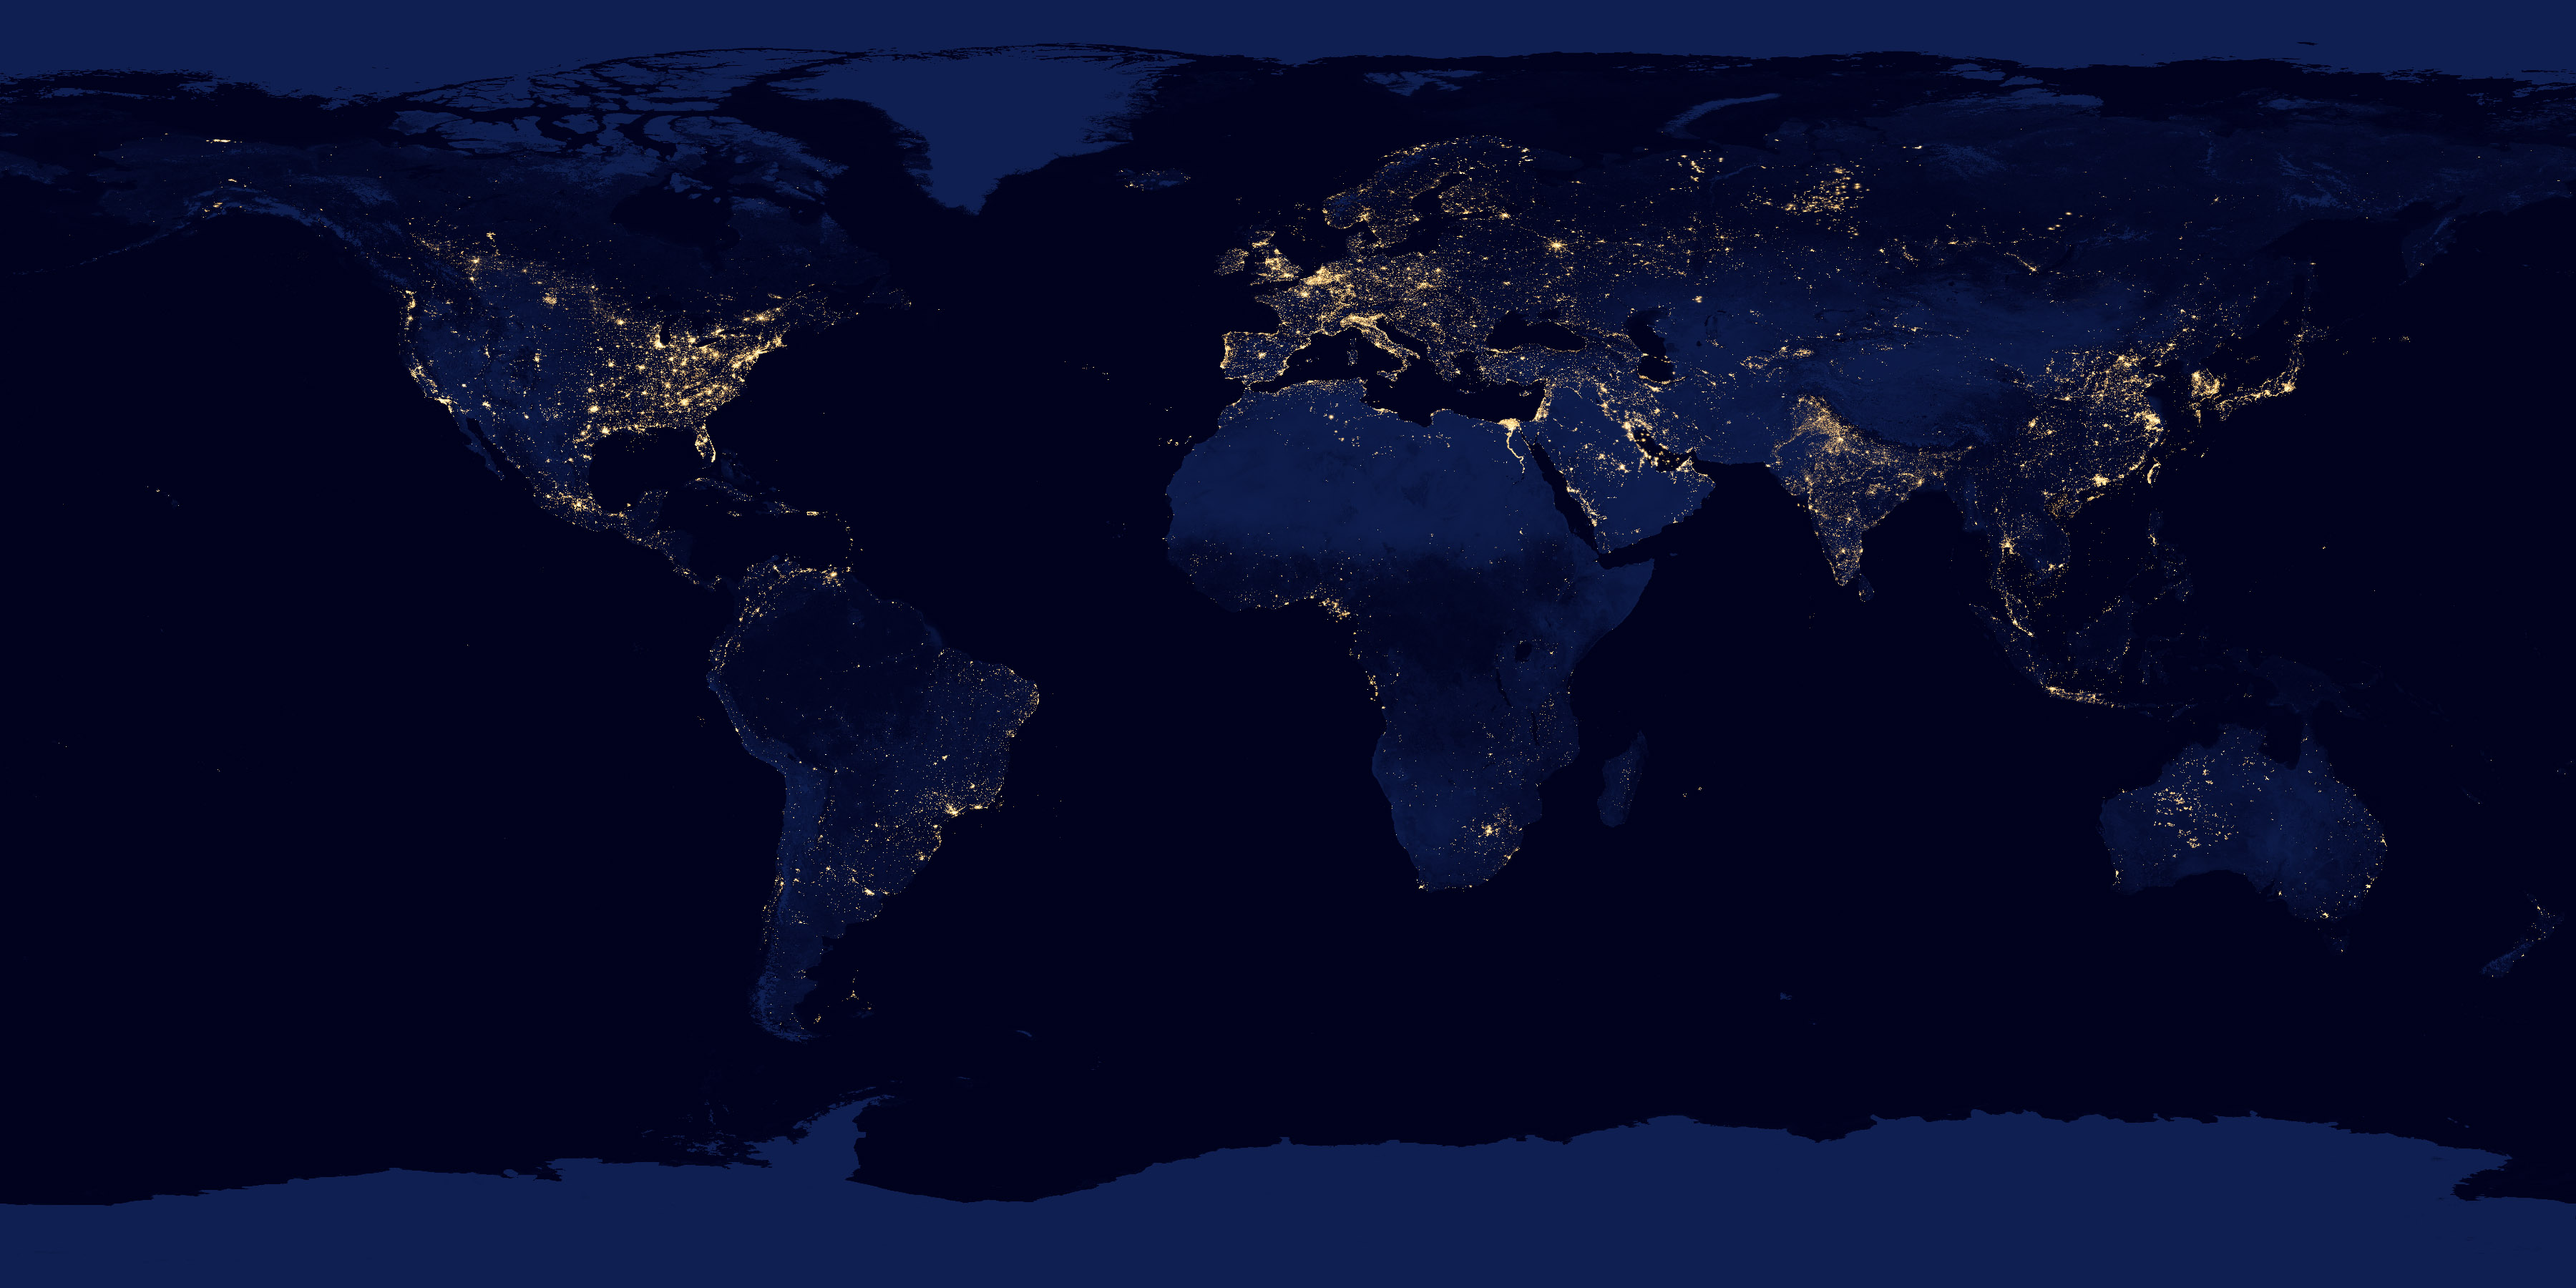
Earth at night
NASA Black Marble: city lights and gas flares as seen from orbit, a picture of electrified settlement.
Read the card →Where people live, gridded: NASA SEDAC GPW and WorldPop, models fitted to censuses, not a headcount of every street.
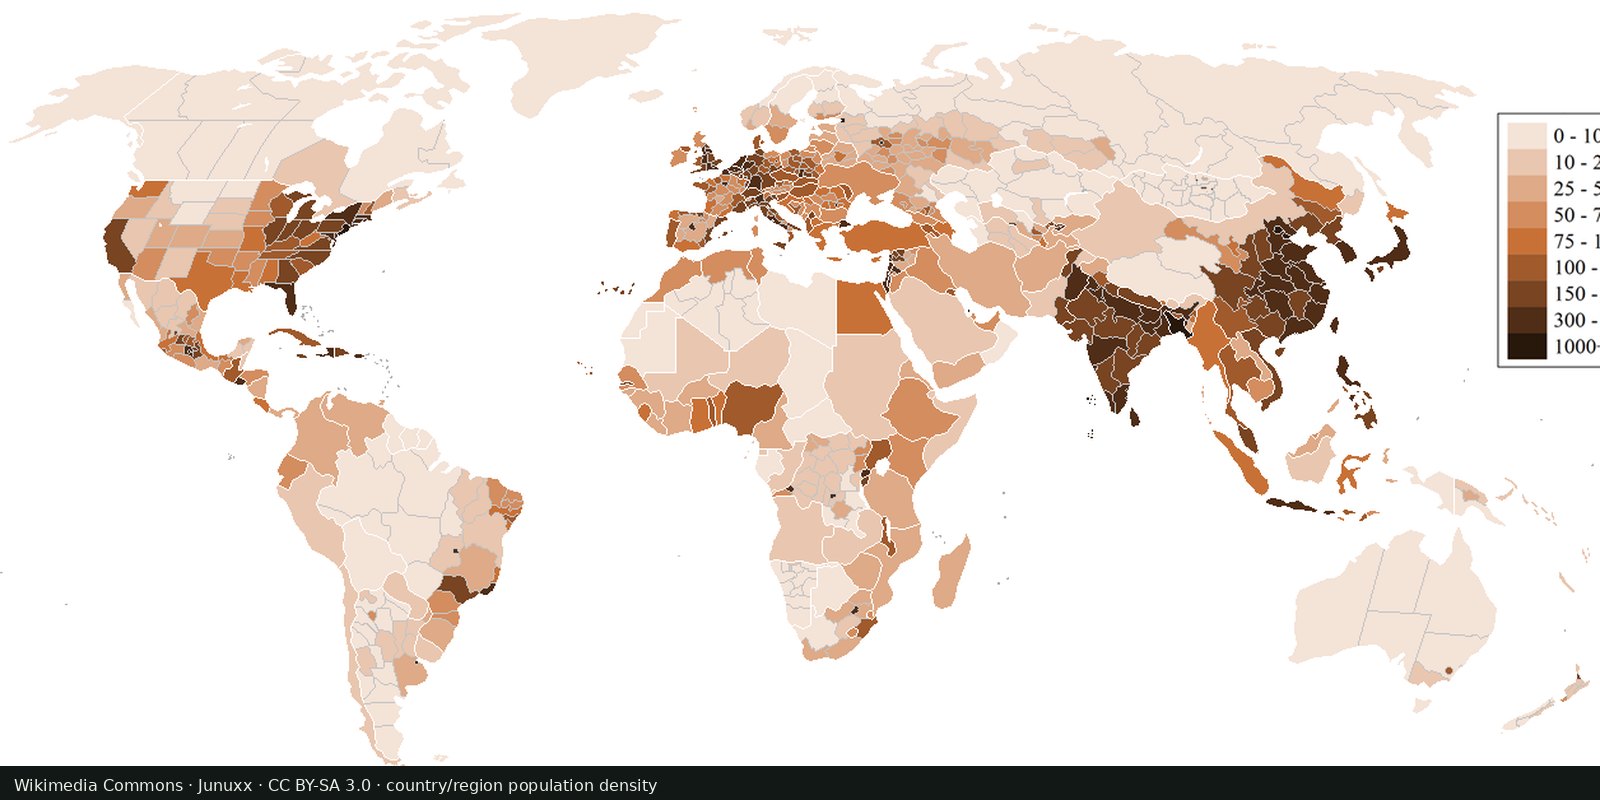
Gridded Population of the World (SEDAC / CIESIN) and WorldPop spread census counts onto a grid with satellite covariates. UN World Population Prospects give the national totals those grids are often aligned to. Night lights (see Earth at night) are a related brightness proxy, not a census.
NASA SEDAC Gridded Population of the World; WorldPop; UN WPP
Vintage: 2020
https://sedac.ciesin.columbia.edu/data/collection/gpw-v4
SEDAC GPW has academic-use terms; WorldPop is typically CC BY. The preview is Wikimedia’s Countries and regions by population density (Junuxx, CC BY-SA 3.0). Open SEDAC’s map viewer for the population grid.
Bright or dark cells are estimated people per square kilometre. Rural sparsity can hide large absolute populations. City cores saturate any color scale.
Censuses are uneven and sometimes old. Conflict zones and informal settlements are hard to count. A grid is an estimate. The preview is a Wikimedia country-and-region density map, not the SEDAC grid itself.
Open source map → NASA Black Marble: city lights and gas flares as seen from orbit, a picture of electrified settlement.
Read the card →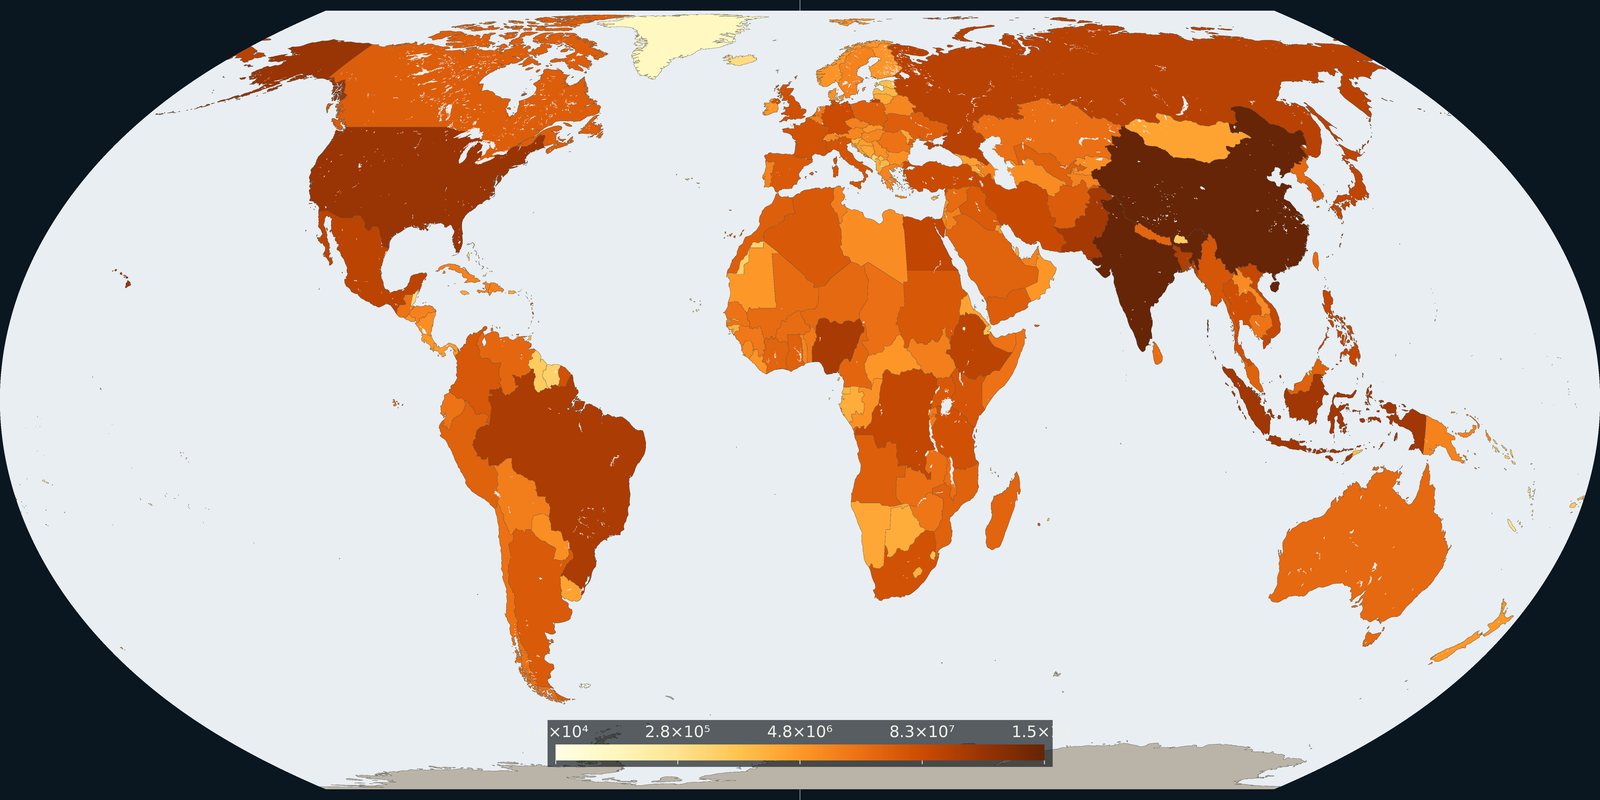
How many people live in each country on 1 July 2024, from the UN medium-variant estimates.
Read the card →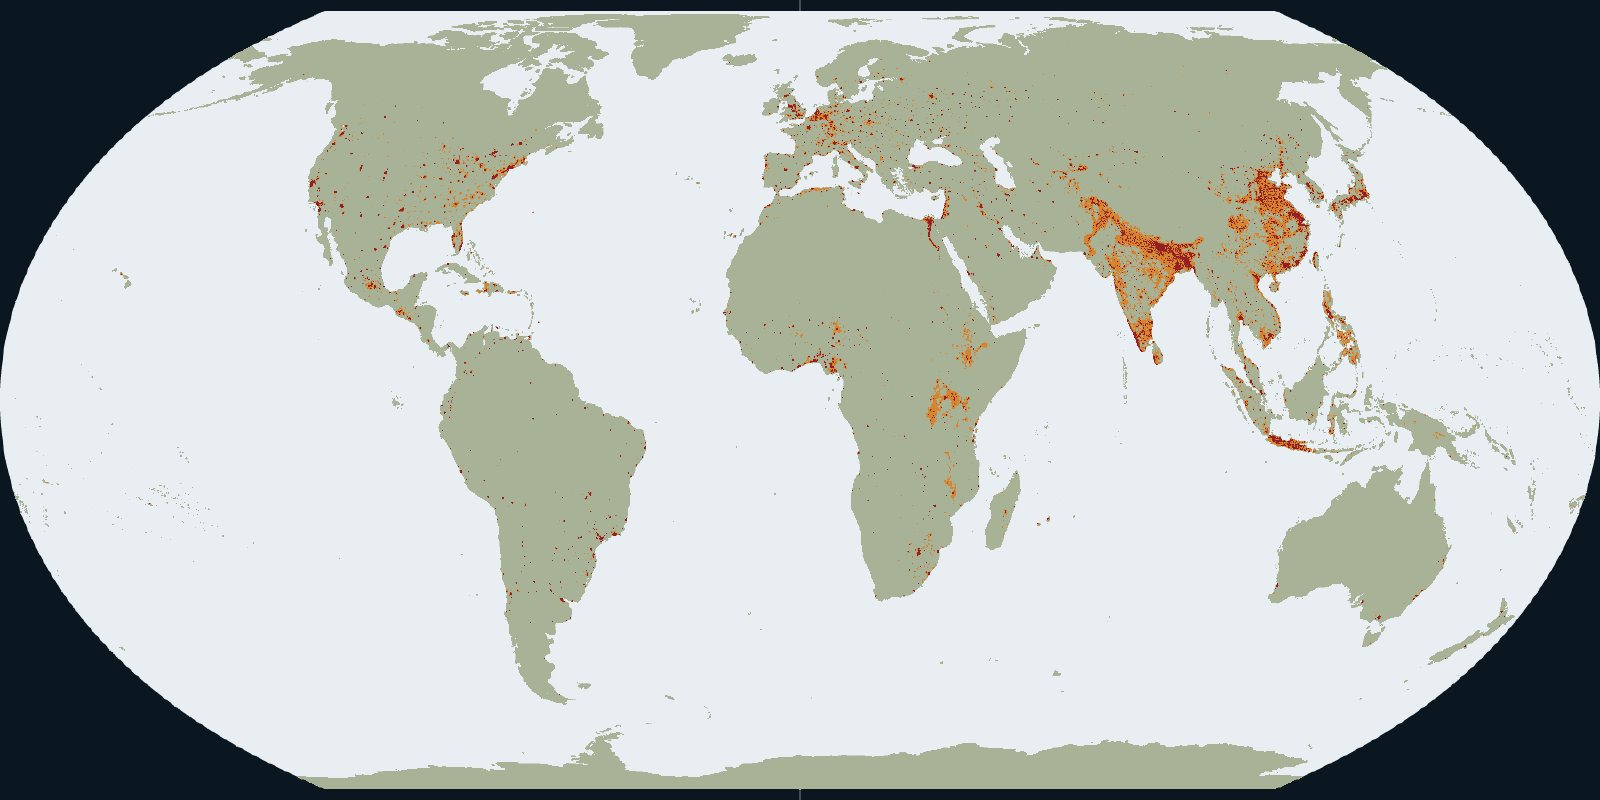
Urban centres, towns and rural land in the GHSL settlement grid for 2020.
Read the card →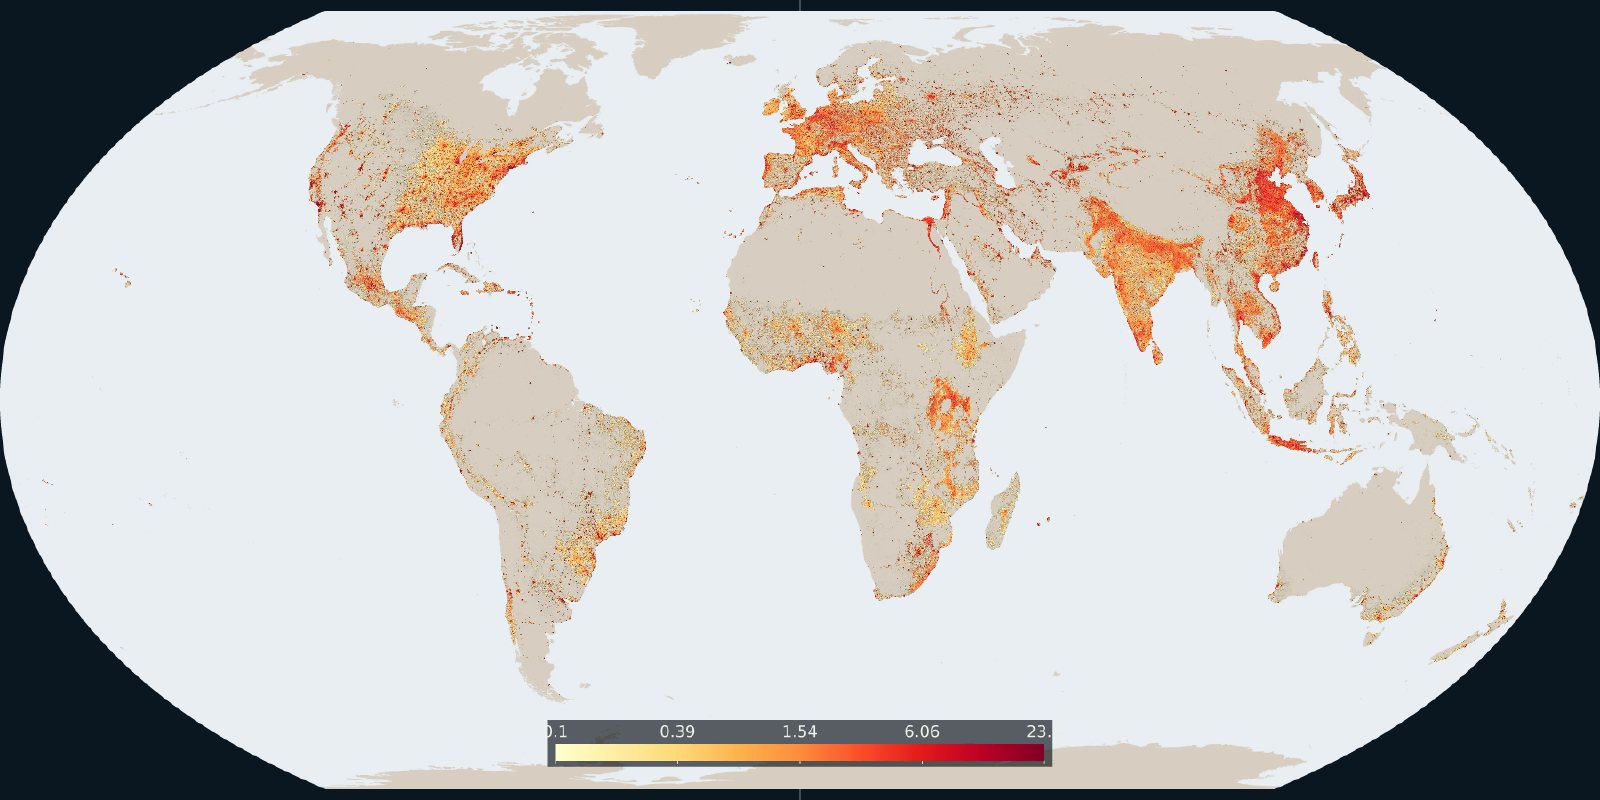
How much of each cell is built-up surface in the 2020 GHSL grid.
Read the card →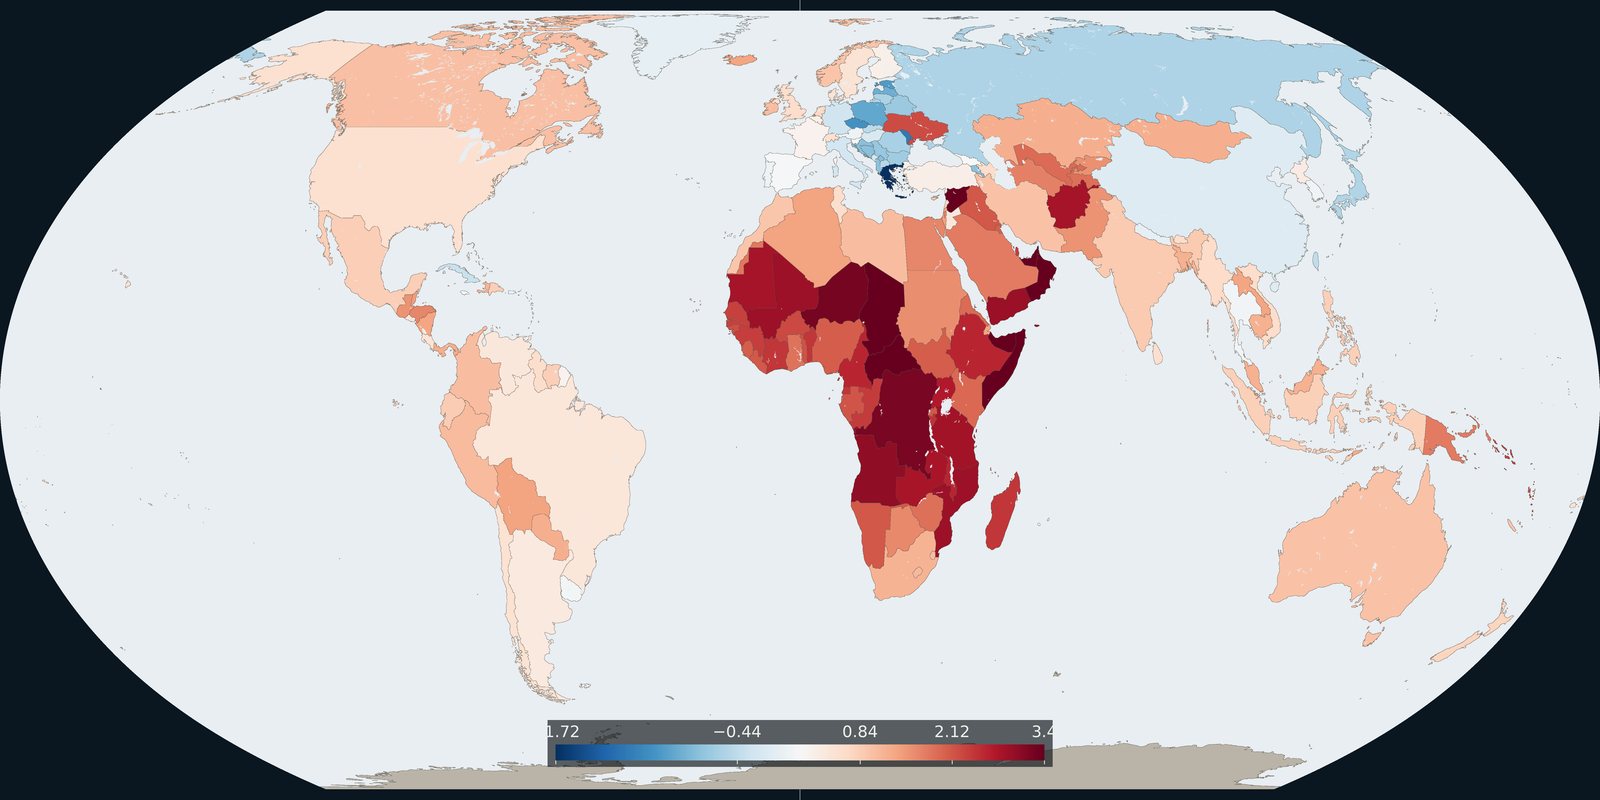
The 2024 annual rate of population change in each country, from the same UN medium variant.
Read the card →