

Pollution
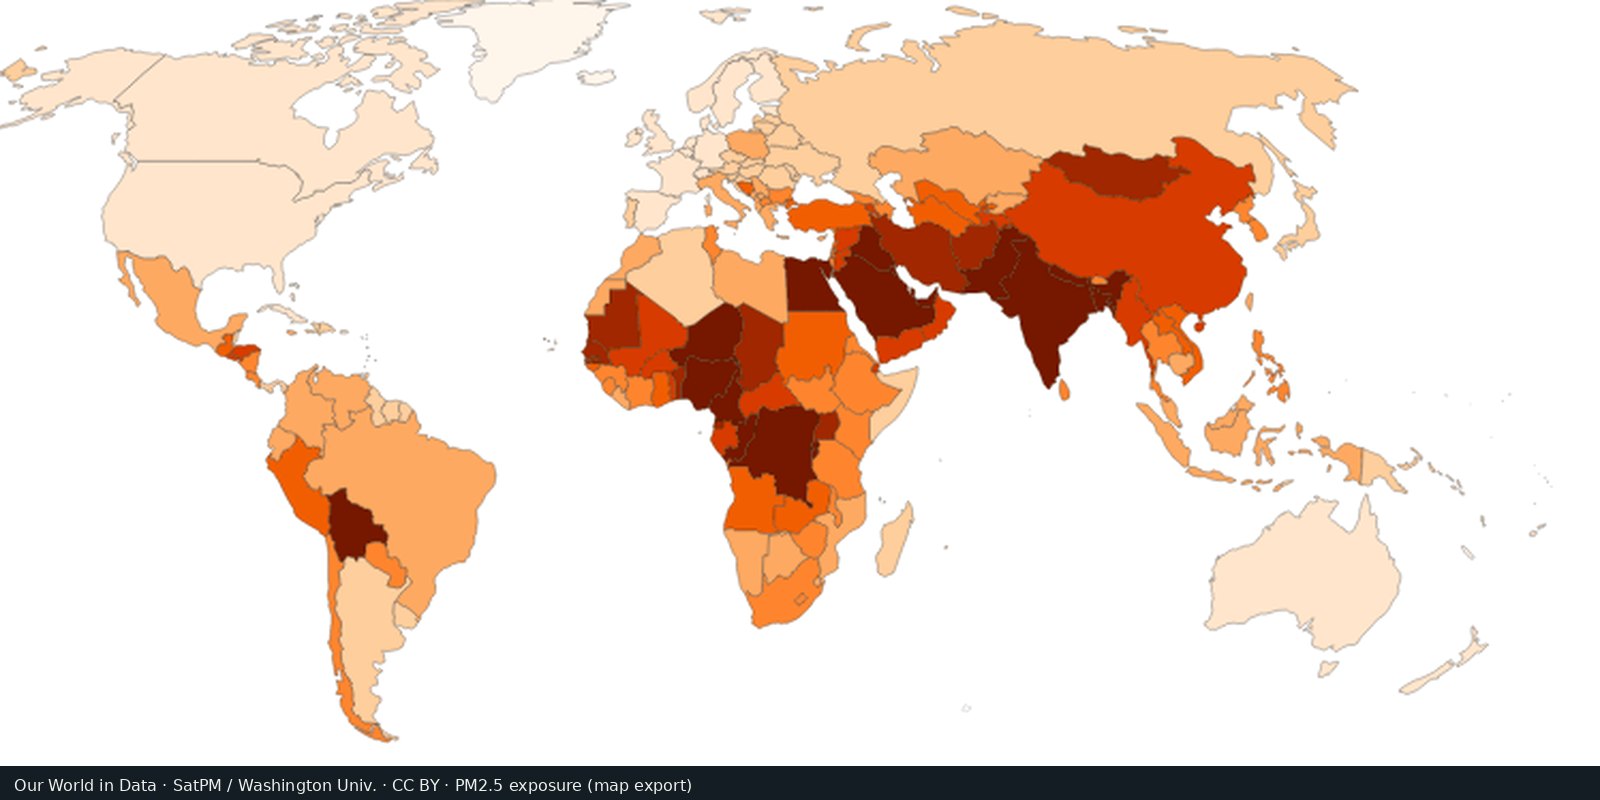
Fine particle air pollution (PM2.5)
Outdoor fine particles that damage lungs and hearts, from satellites, models, and monitors, not a smell test.
Read the card →Satellite column of nitrogen dioxide over cities, industry, and shipping: combustion pollution, not the same as PM2.5 mass.
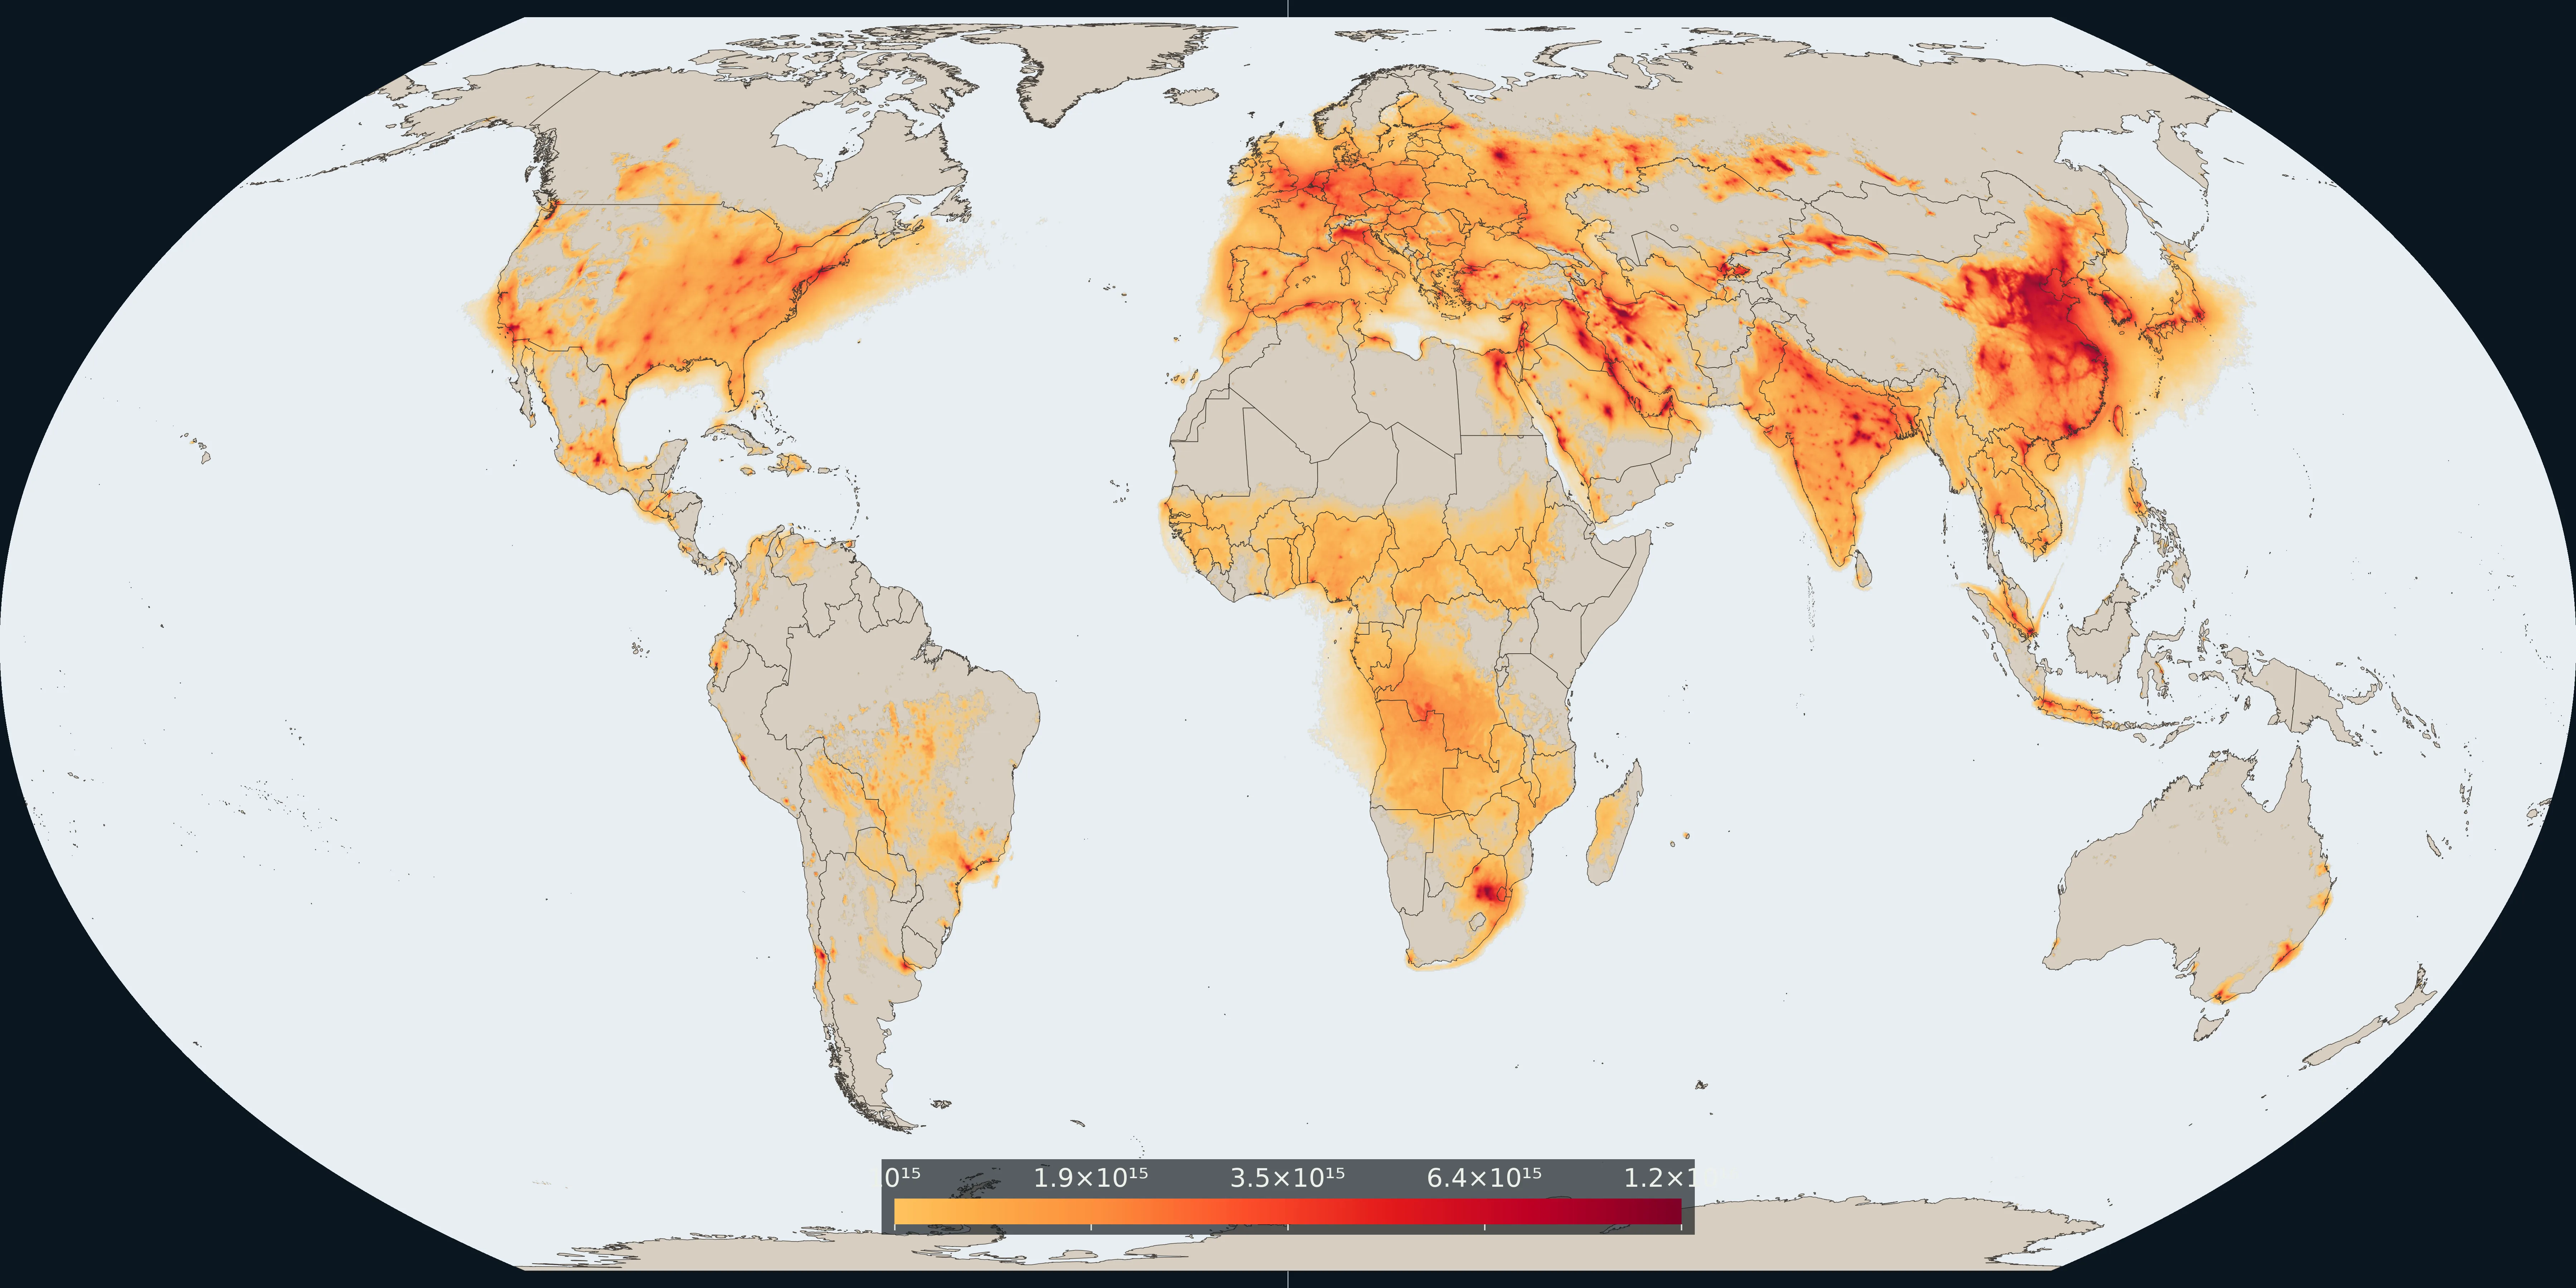
Map: Fix Planet from Copernicus Sentinel-5P TROPOMI, annual mean tropospheric NO₂ for 2024, KNMI/TEMIS monthly grids. Colour is a log scale of the column, from 1×10¹⁵ molecules/cm². Boundaries: Natural Earth.
Tropospheric nitrogen dioxide measured by the TROPOMI instrument on Copernicus Sentinel-5P. This plate is the annual mean for 2024, the average of the twelve KNMI/TEMIS monthly grids. NO₂ is a short-lived combustion tracer from traffic, power plants, industry, shipping, and fires.
PM2.5 answers how much fine particle mass a person breathes on average. NO₂ answers a different air question: where is fresh combustion nitrogen oxide pollution visible from orbit? It is not a CO₂ inventory and not a plastic-waste map.
Colour is a log scale of the tropospheric column, starting at 1×10¹⁵ molecules per square centimetre. Clean air stays the base map; orange and deep red mark urban and industrial hotspots. The 2024 annual mean closes the daily swath gaps. It is not a legal limit and not WHO’s PM2.5 guideline. Open the TEMIS monthly archive for the source grids.
Clouds hide the surface. A bright column is not an annual legal limit and not WHO’s PM2.5 guideline. This is not a CO₂ inventory and not a plastic-waste map.
The preview is a Fix Planet overview of the 2024 annual mean tropospheric NO₂ column, not an ESA or TEMIS marketing still. Attribute Copernicus Sentinel-5P / TROPOMI and KNMI/TEMIS. Open the TEMIS monthly archive for the source grids.
Open source map → Outdoor fine particles that damage lungs and hearts, from satellites, models, and monitors, not a smell test.
Read the card →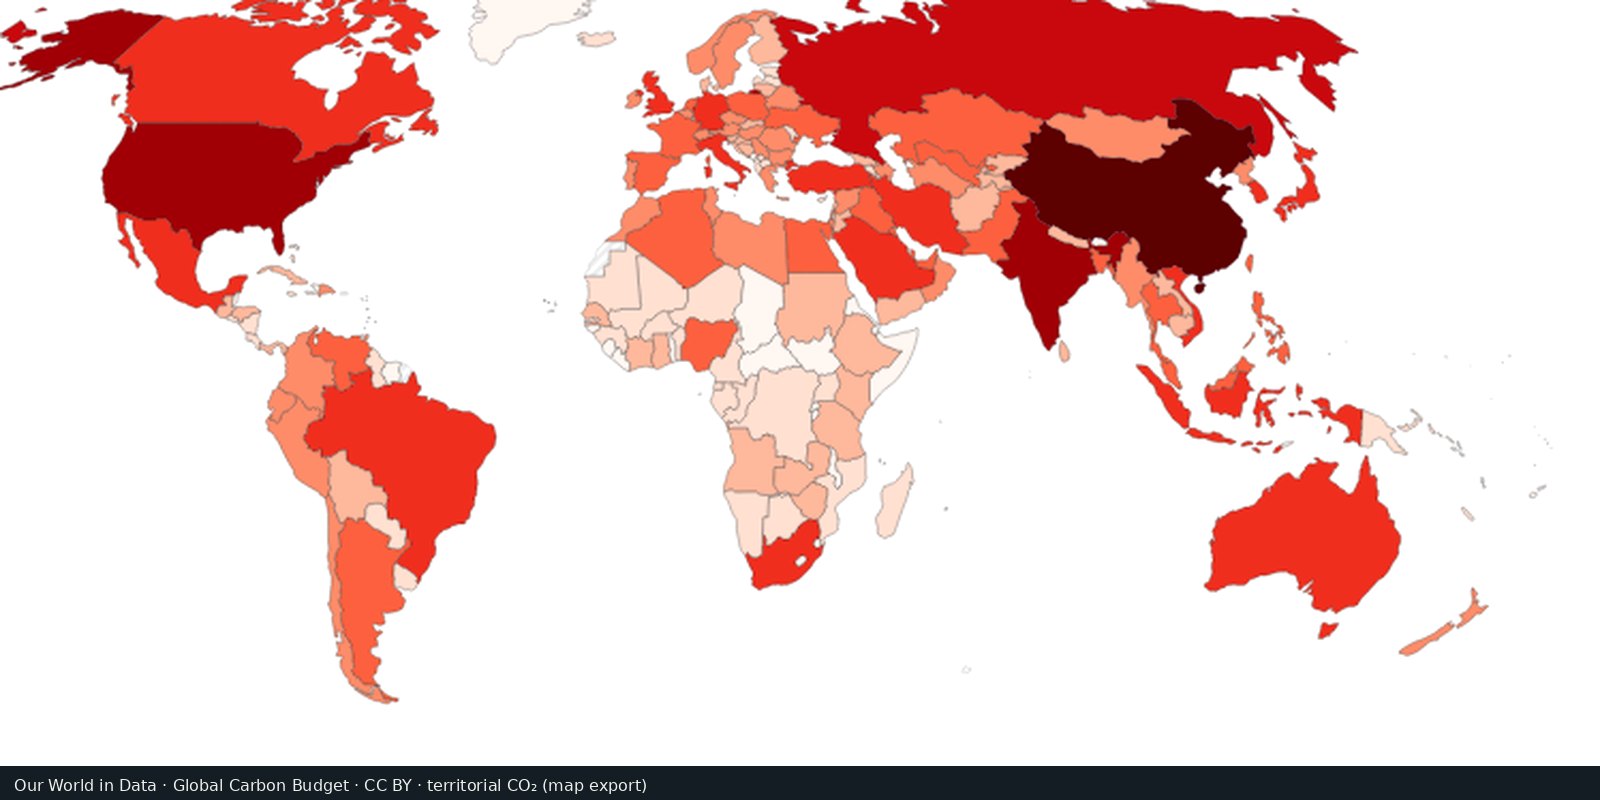
Carbon dioxide from fossil fuels and industry, by country of production: the Global Carbon Project series.
Read the card →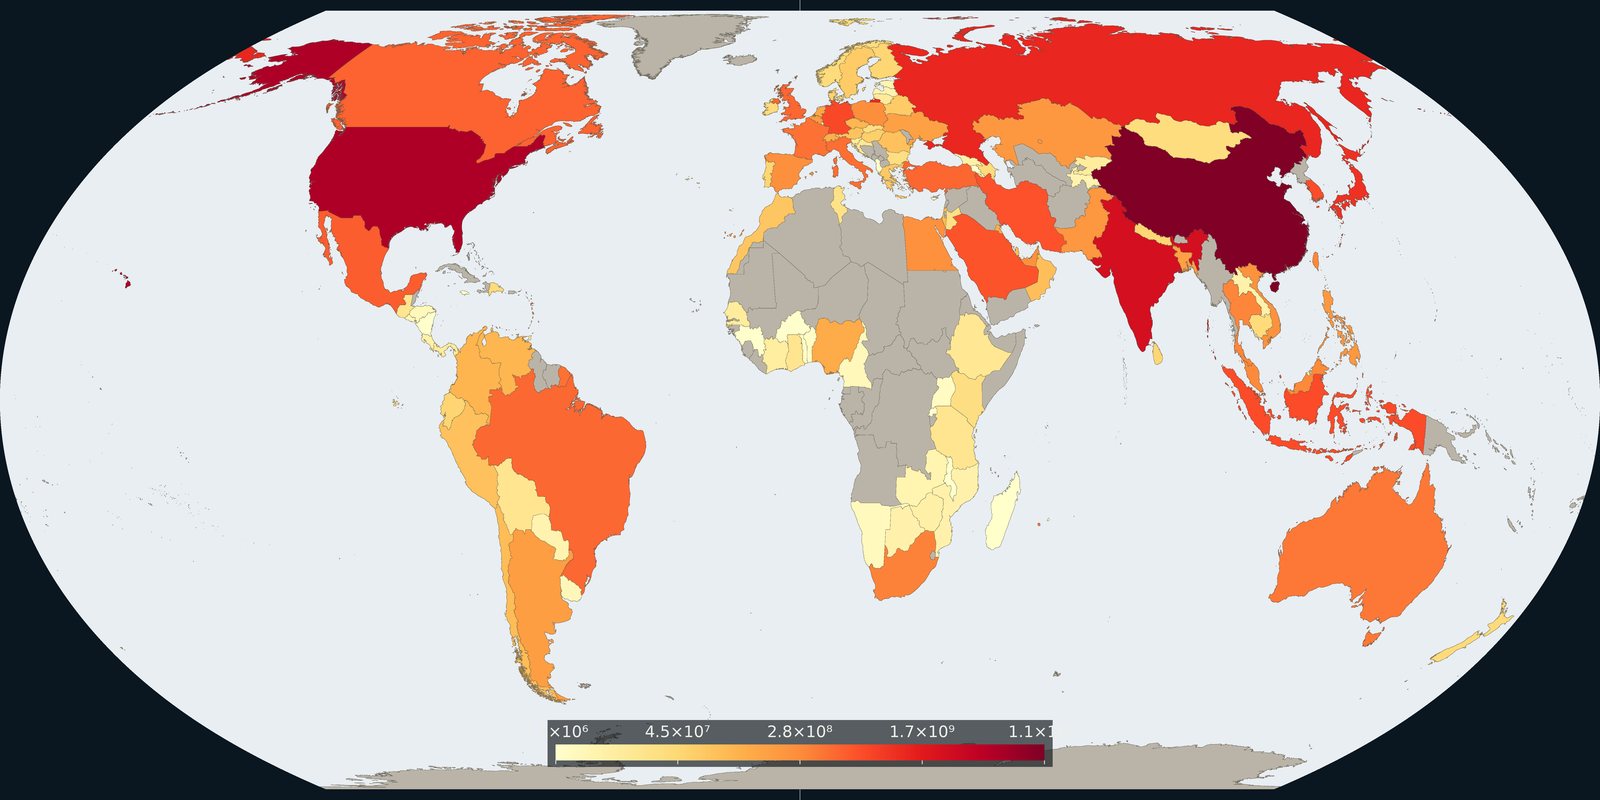
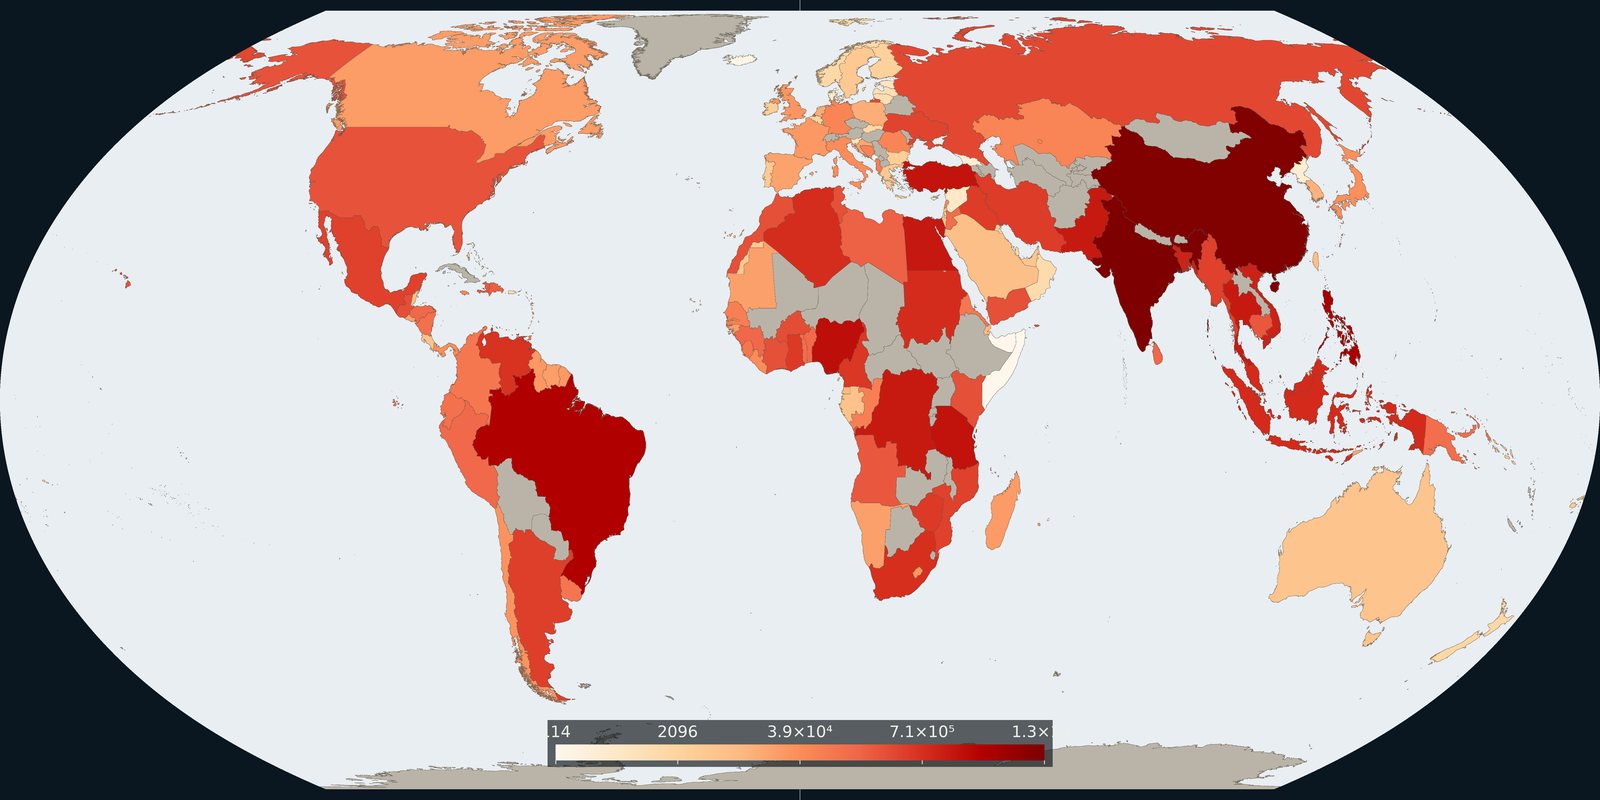
Carbon dioxide attributed to where goods and services are consumed, territorial inventories adjusted for trade, not a second production map.
Read the card →Source: Global Carbon Project / Our World in Data, consumption-based CO₂
Plastic waste not recycled, incinerated, or sealed in landfill: the leak risk to rivers and coasts, not a beach litter photo.
Read the card →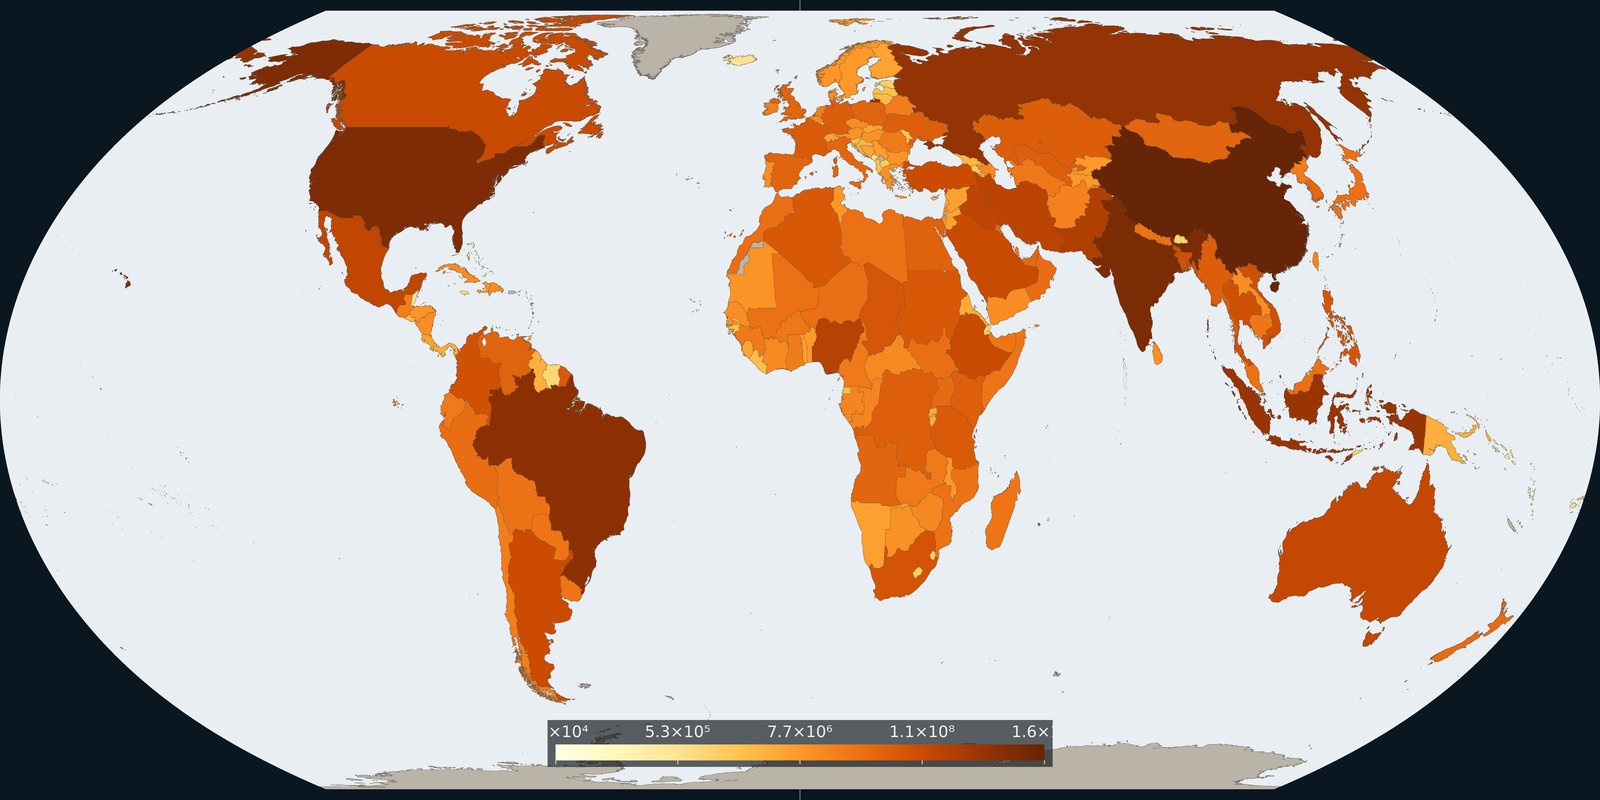
Country and grid maps of methane from fossil fuels, agriculture, and waste: a different greenhouse gas than the CO₂ cards.
Read the card →