

Pollution
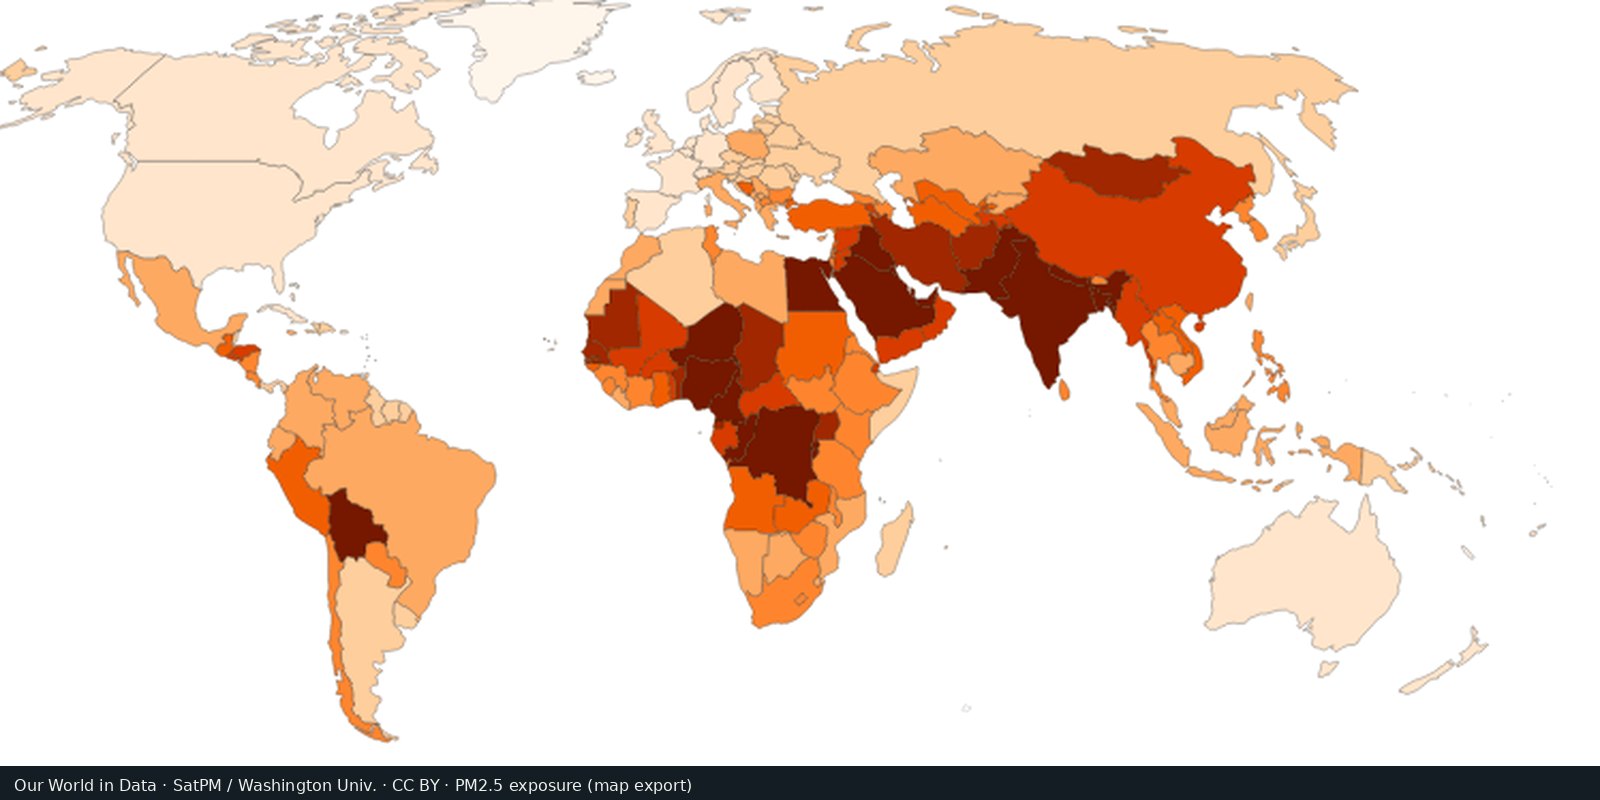
Fine particle air pollution (PM2.5)
Outdoor fine particles that damage lungs and hearts, from satellites, models, and monitors, not a smell test.
Read the card →Carbon dioxide from fossil fuels and industry, by country of production: the Global Carbon Project series.
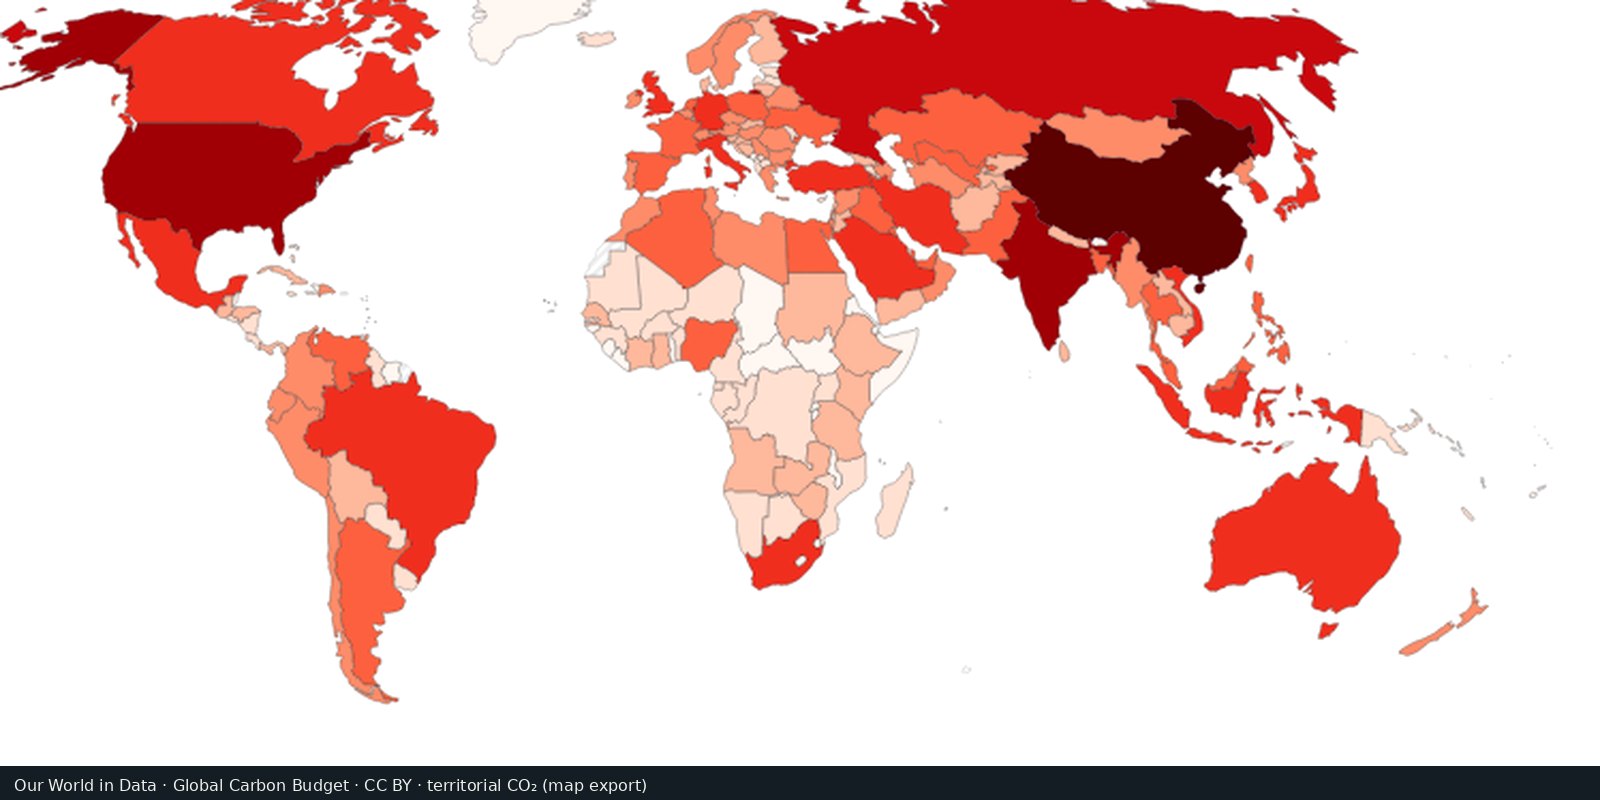
The Global Carbon Project estimates territorial CO₂ from coal, oil, gas, and cement. Our World in Data maps production-based totals and per-capita rates, and also discusses consumption-based (trade-adjusted) accounts.
Global Carbon Project; Our World in Data
Vintage: 2023
https://www.globalcarbonproject.org/
GCP data are published for reuse with citation. We host a cropped Our World in Data map export (CC BY) of territorial CO₂. Open their emissions map for the interactive layer.
A large country with heavy industry will dominate a “total emissions” map. Per-capita and consumption-based views change the picture. Bunker fuels and land-use change are often separate lines.
Territorial inventories miss emissions embodied in imports. Year-to-year jumps can be methodology or recession, not virtue. This is not a map of local smog.
Open source map → Outdoor fine particles that damage lungs and hearts, from satellites, models, and monitors, not a smell test.
Read the card →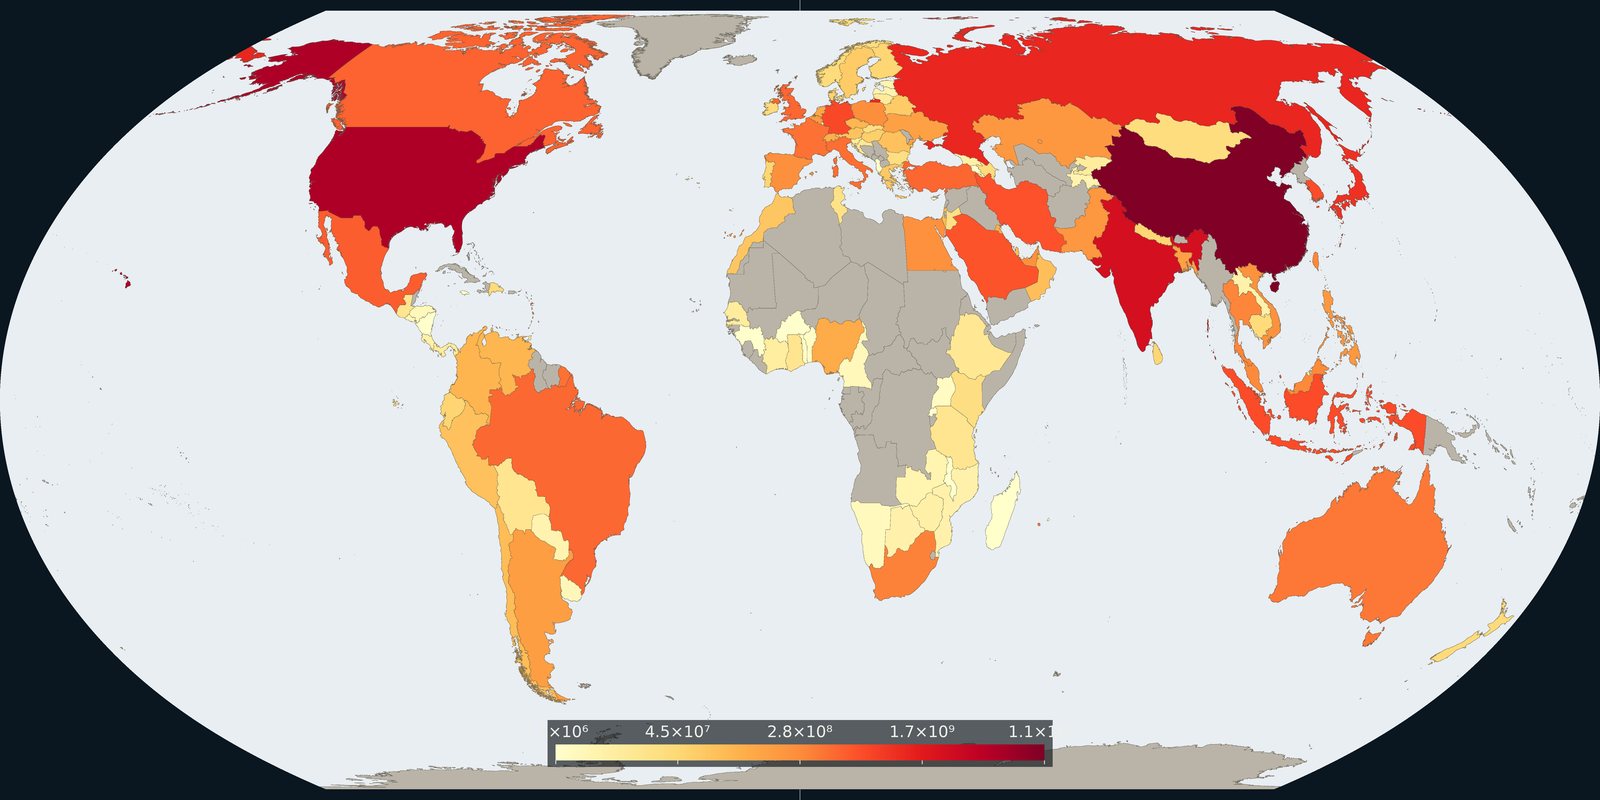
Carbon dioxide attributed to where goods and services are consumed, territorial inventories adjusted for trade, not a second production map.
Read the card →Source: Global Carbon Project / Our World in Data, consumption-based CO₂
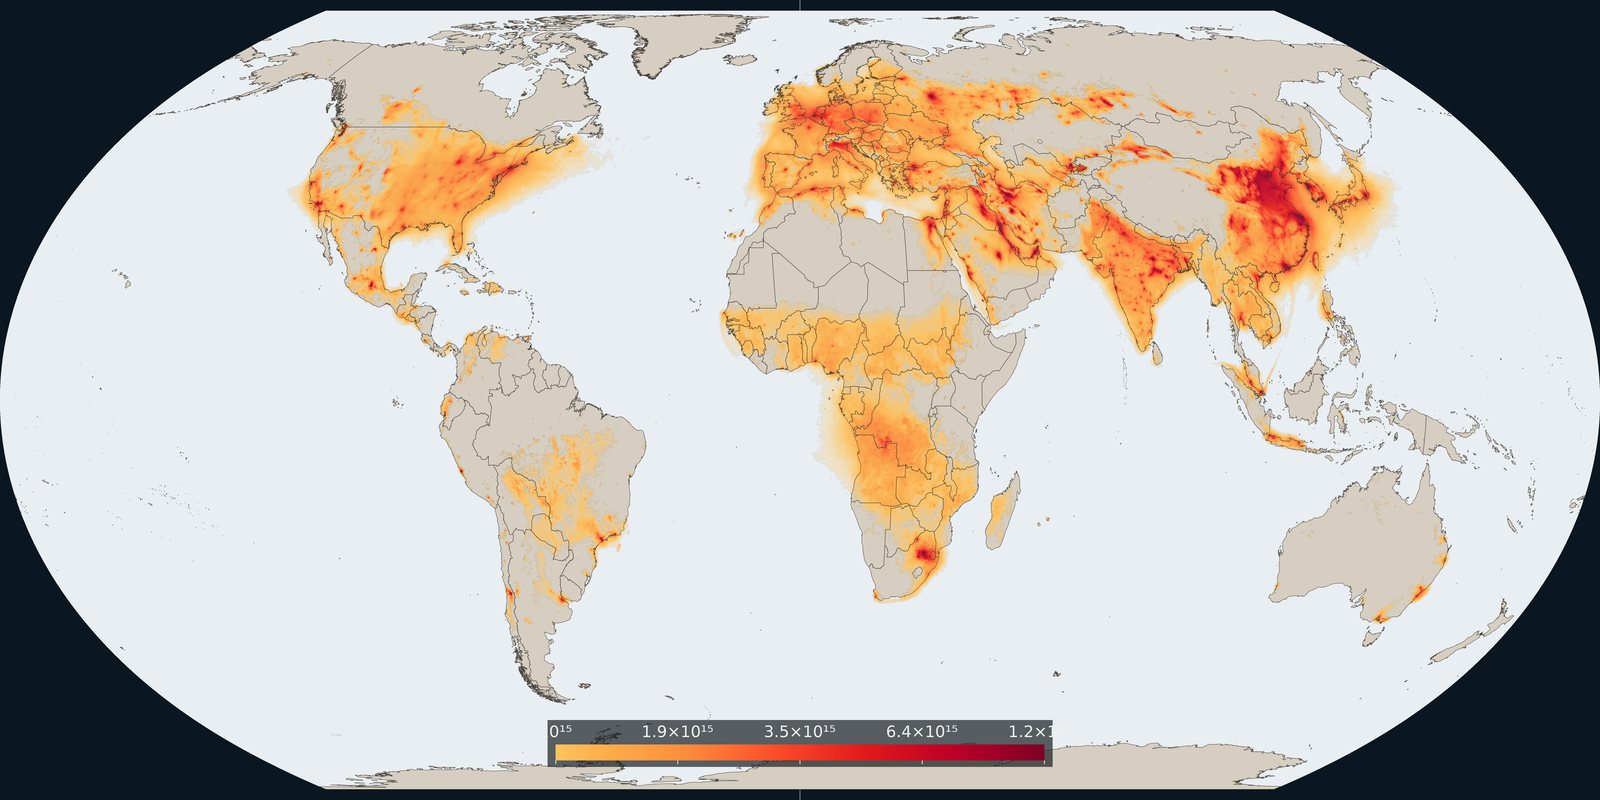
Satellite column of nitrogen dioxide over cities, industry, and shipping: combustion pollution, not the same as PM2.5 mass.
Read the card →Source: KNMI / TEMIS: monthly mean tropospheric NO₂ from TROPOMI
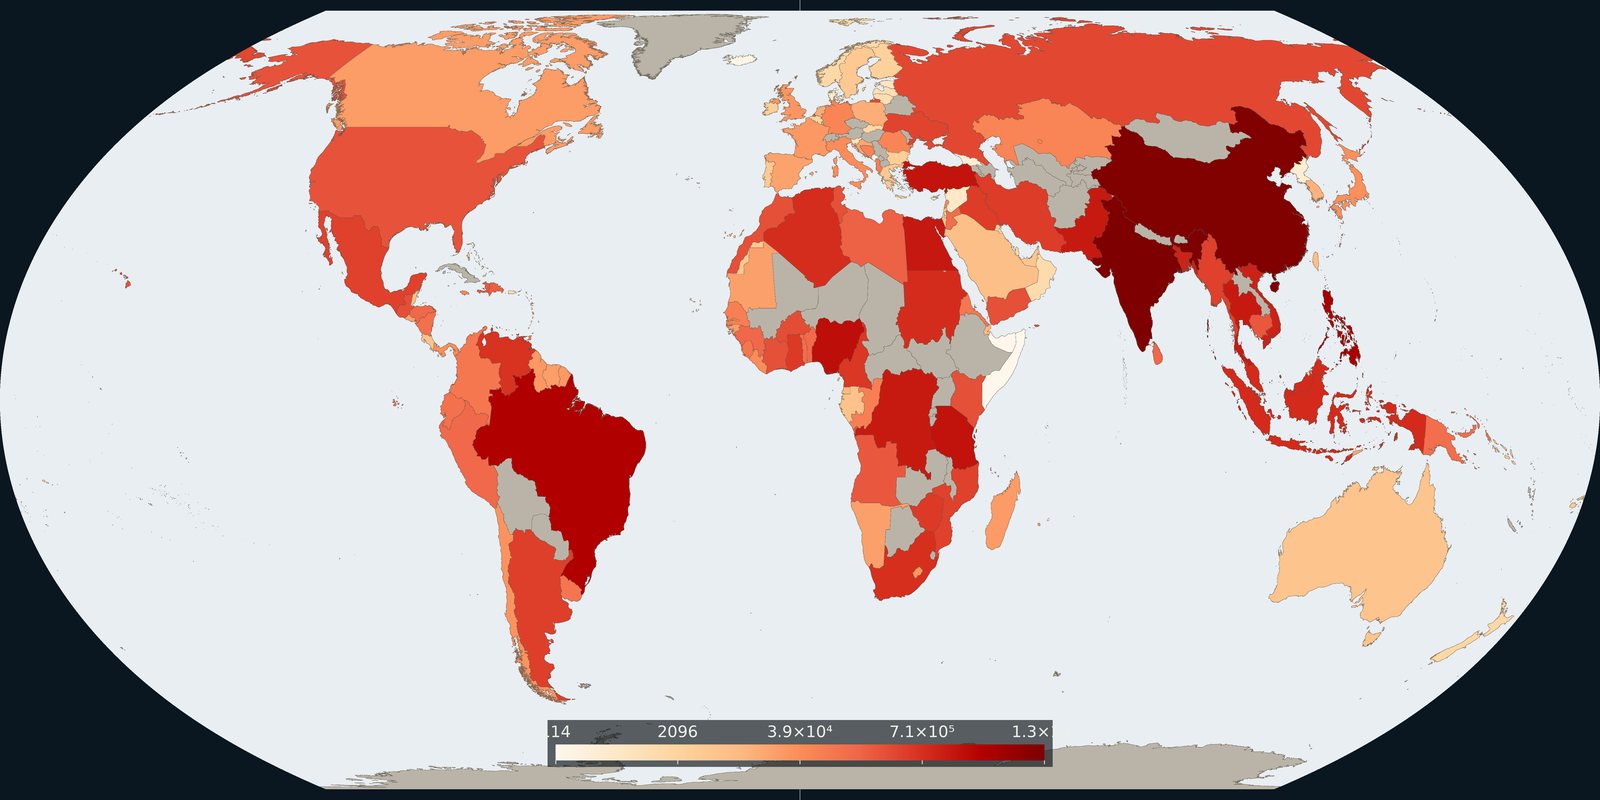
Plastic waste not recycled, incinerated, or sealed in landfill: the leak risk to rivers and coasts, not a beach litter photo.
Read the card →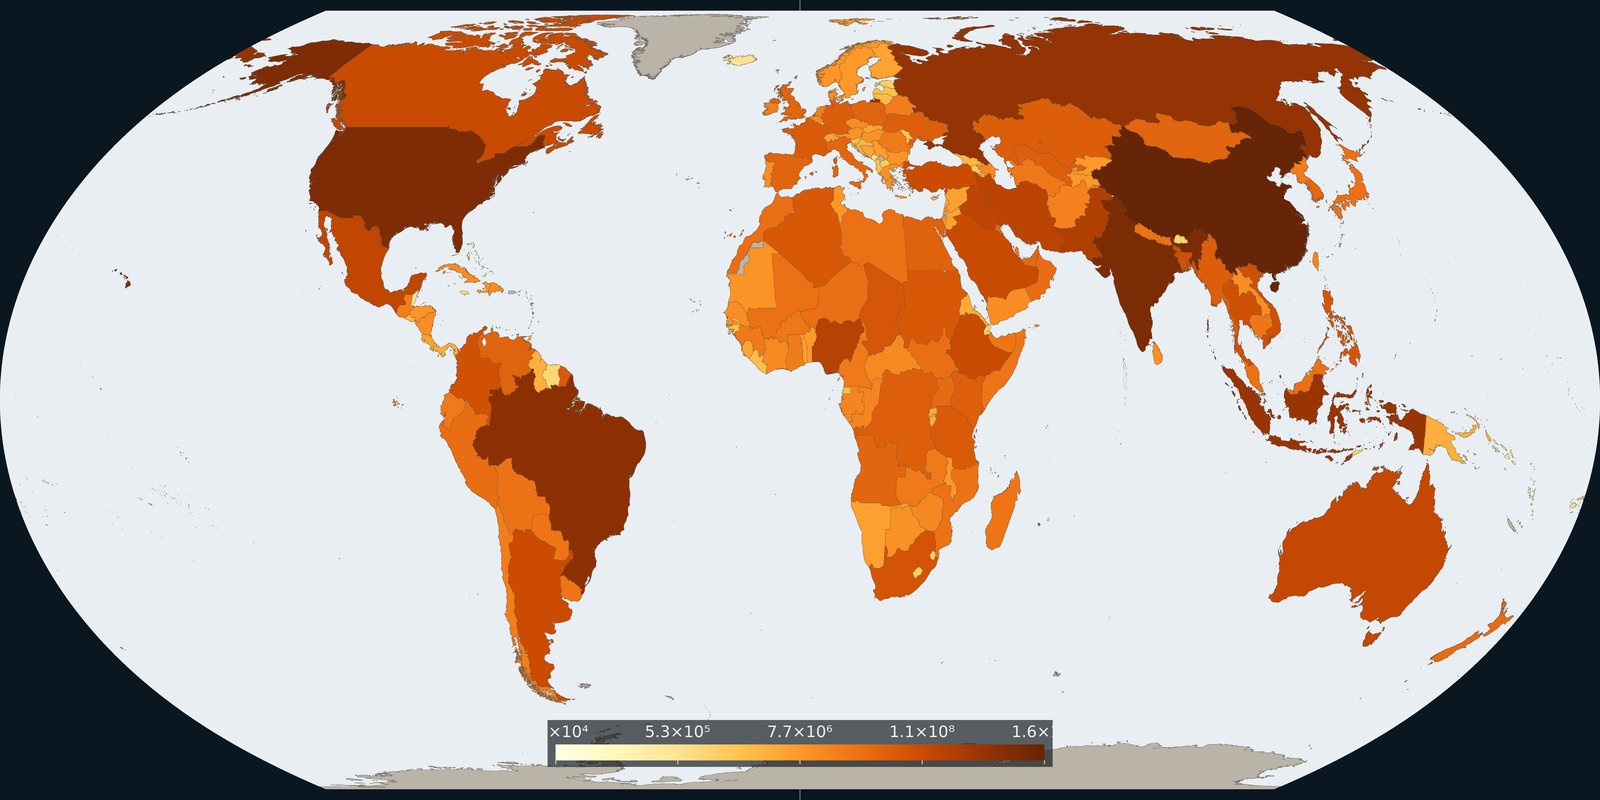
Country and grid maps of methane from fossil fuels, agriculture, and waste: a different greenhouse gas than the CO₂ cards.
Read the card →