

Pollution
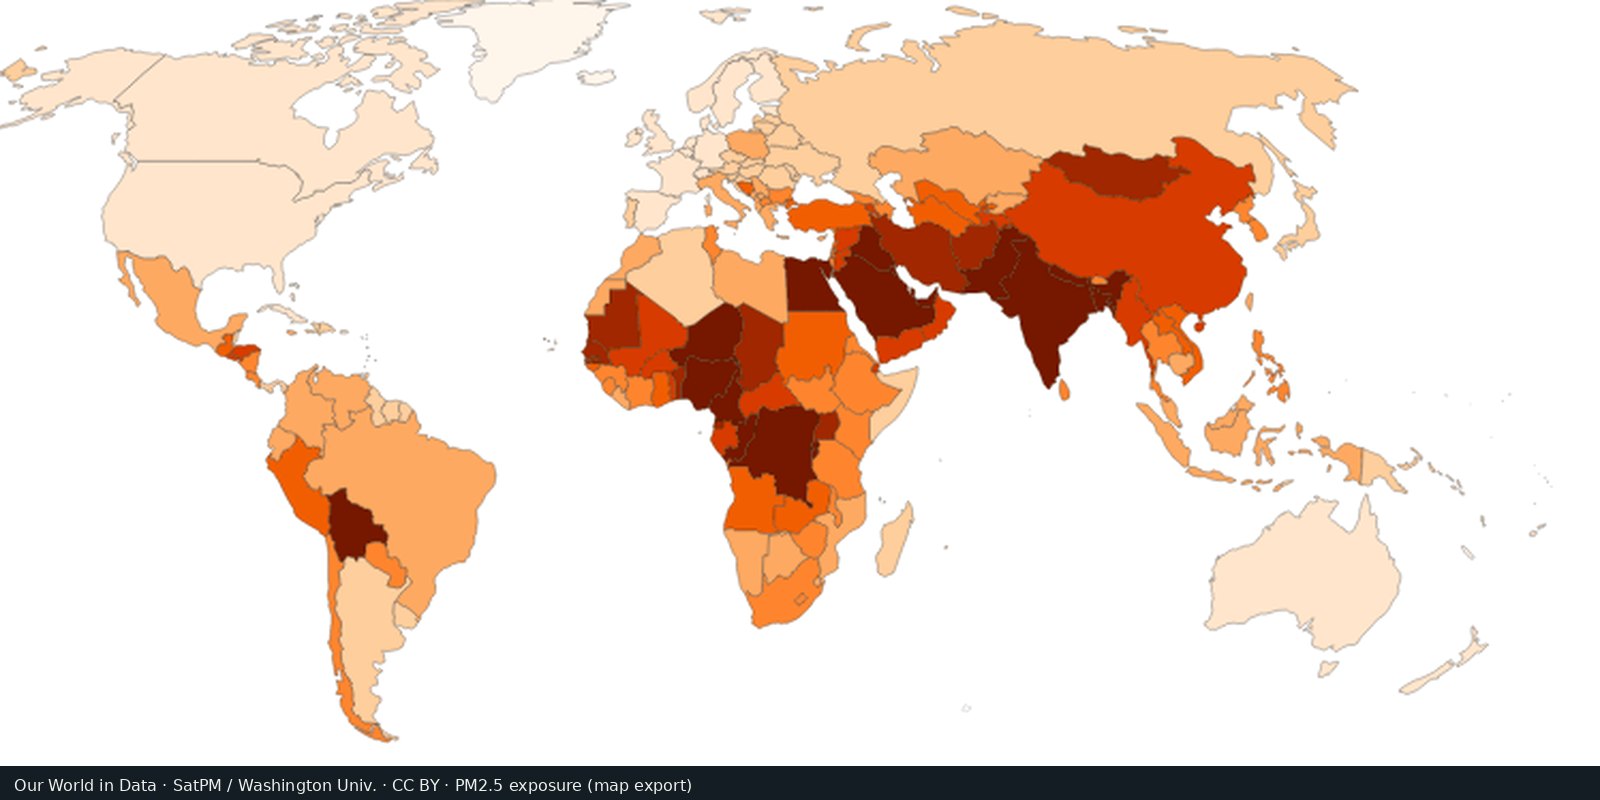
Fine particle air pollution (PM2.5)
Outdoor fine particles that damage lungs and hearts, from satellites, models, and monitors, not a smell test.
Read the card →Country and grid maps of methane from fossil fuels, agriculture, and waste: a different greenhouse gas than the CO₂ cards.
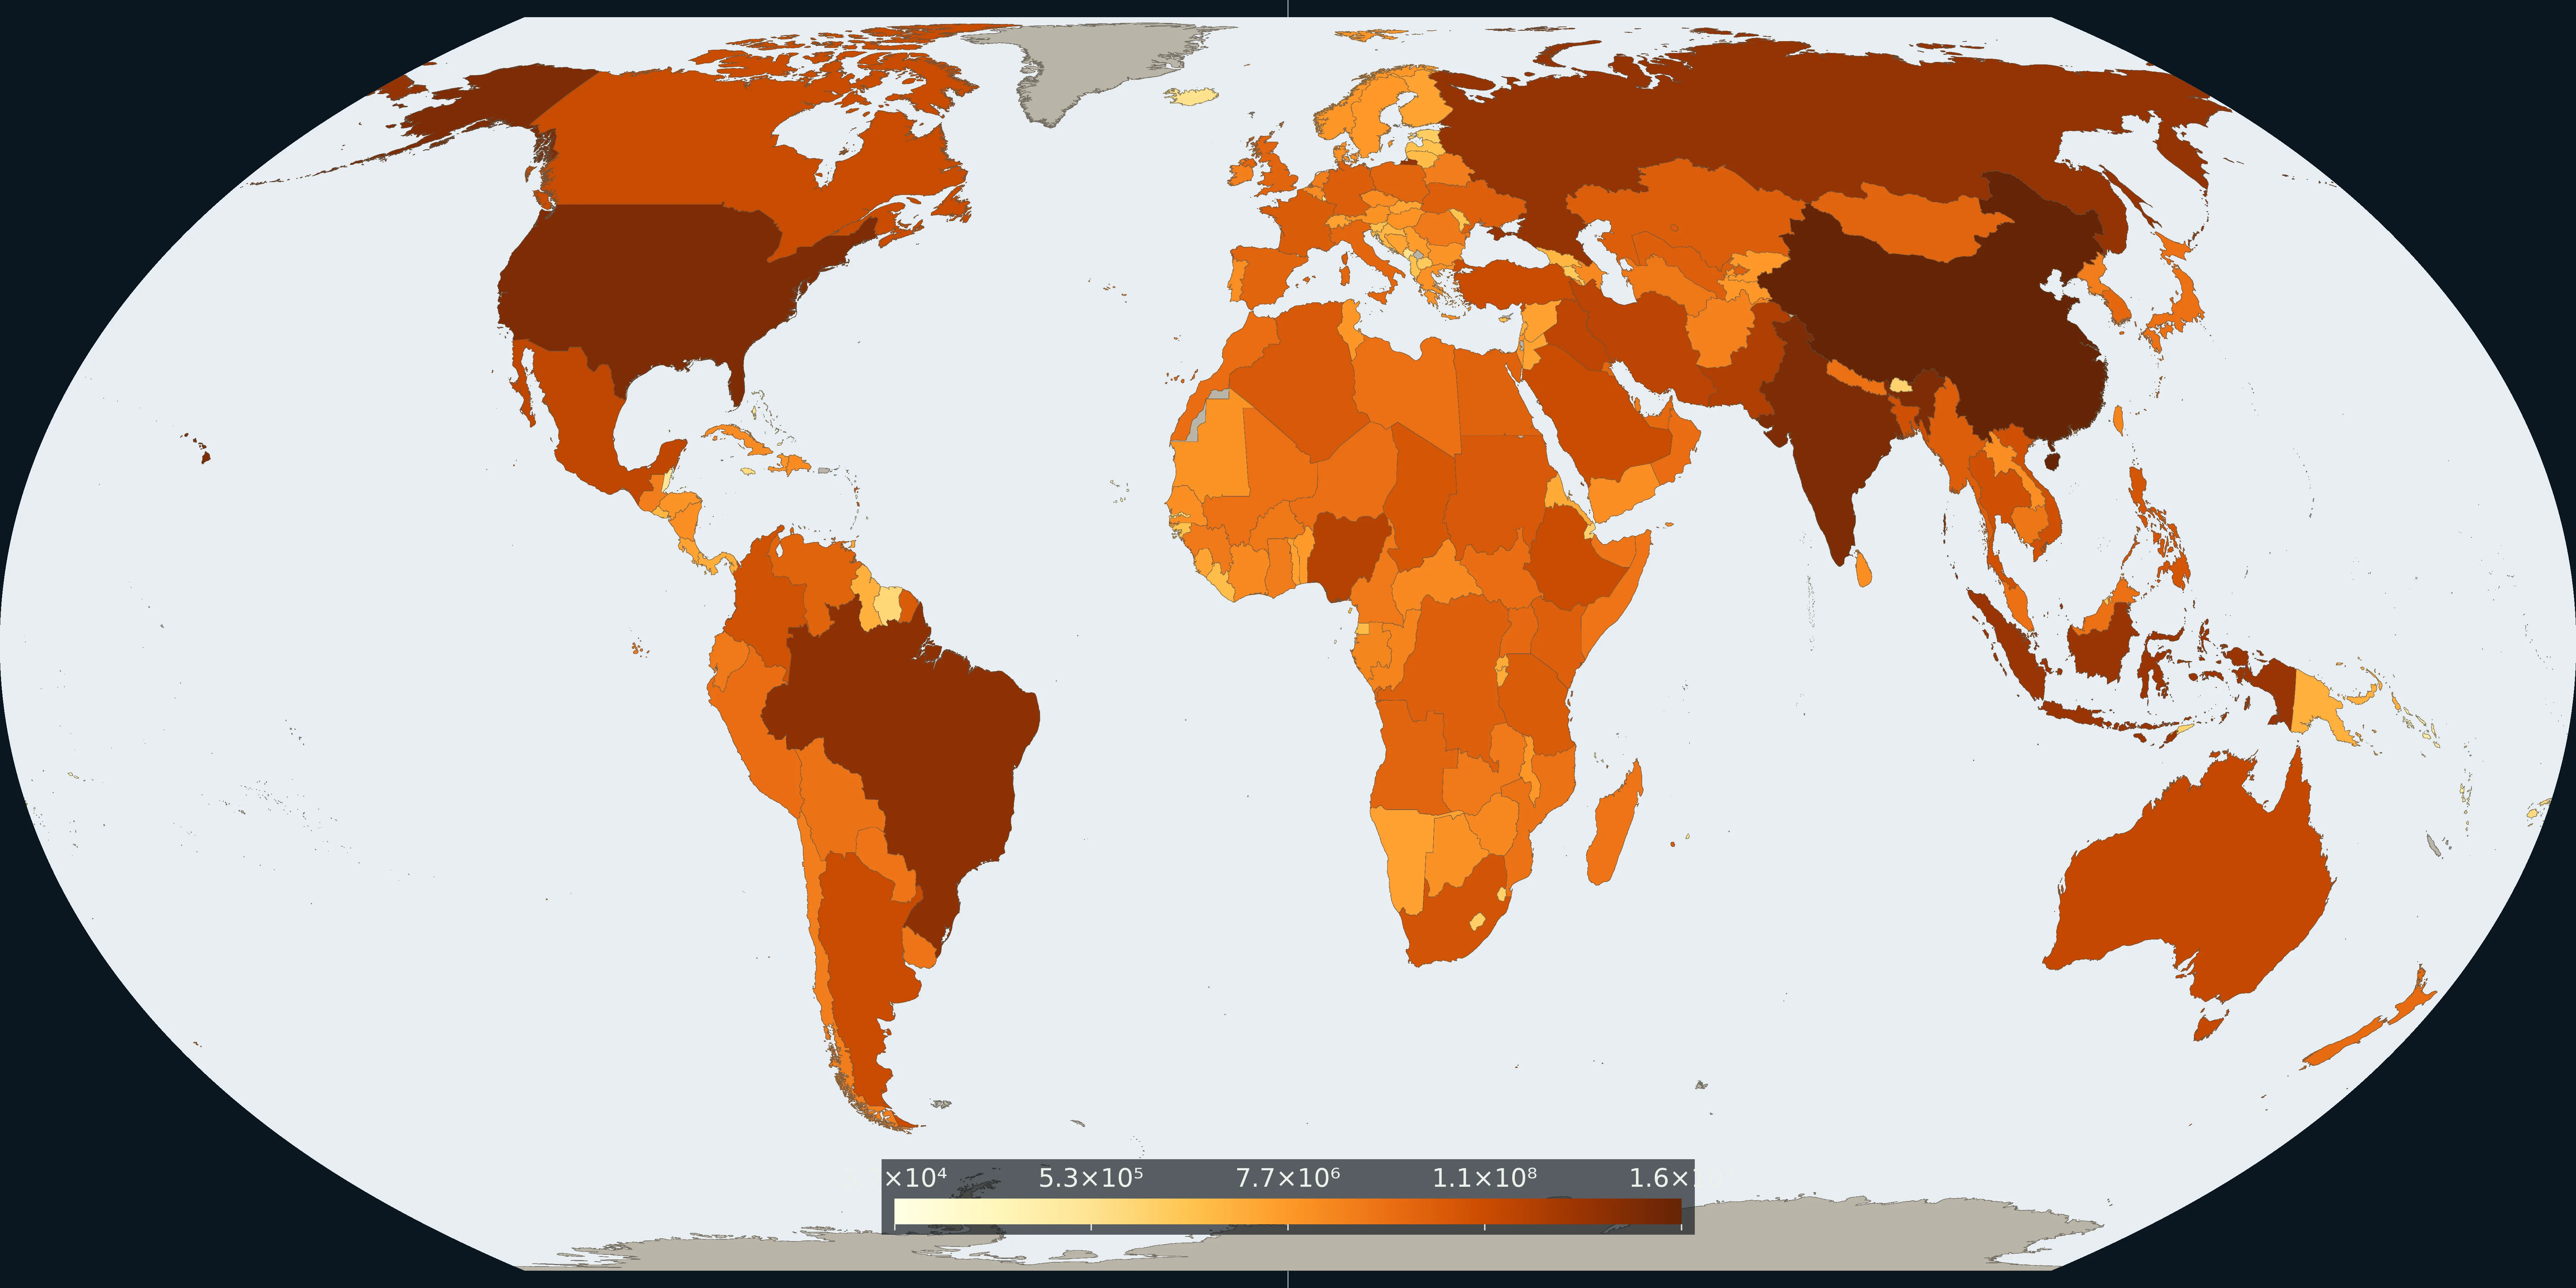
Map: Fix Planet from EDGAR methane emissions data, 2024. Units: tonnes per year. Boundaries: Natural Earth.
Methane (CH₄) emission inventories from the European Commission JRC EDGAR Community GHG database (public release EDGAR_2025_GHG), with a public country map on Our World in Data. EDGAR publishes sector and 0.1° grid products. UNEP IMEO Eye on Methane adds measurement-based plume alerts as a companion, not a replacement inventory. IEA Global Methane Tracker 2025 covers the energy sector in depth.
The CO₂ cards on this shelf are carbon dioxide only. Methane is a separate short-lived greenhouse gas from oil and gas, coal, livestock, rice, and landfills. This is not PM2.5 and not the Climate TRACE card on the Innovations shelf.
Inventory totals are modelled activity × emission factors, not the same object as a satellite plume pin. Sector mix matters: a livestock-heavy country and a gas-flaring country can look similar on a total map for different reasons. Open OWID’s methane map and EDGAR’s GHG 2025 release notes; use methanedata.unep.org for measured events. The preview is a Fix Planet overview after the named sources.
An inventory total is not a satellite plume pin. Livestock, rice, coal, oil and gas, and landfills can add up to a similar country total for different reasons. This is not territorial or consumption-based CO₂, and not a map that shows methane only as CO₂-equivalent.
The preview is a Fix Planet overview of methane emissions, not a flare stock photo and not an EDGAR or OWID marketing crop. Attribute EDGAR (JRC) / Our World in Data. Eye on Methane (UNEP IMEO) is the measurement companion, not a replacement inventory. Open the OWID methane map for the interactive layer.
Open source map → Outdoor fine particles that damage lungs and hearts, from satellites, models, and monitors, not a smell test.
Read the card →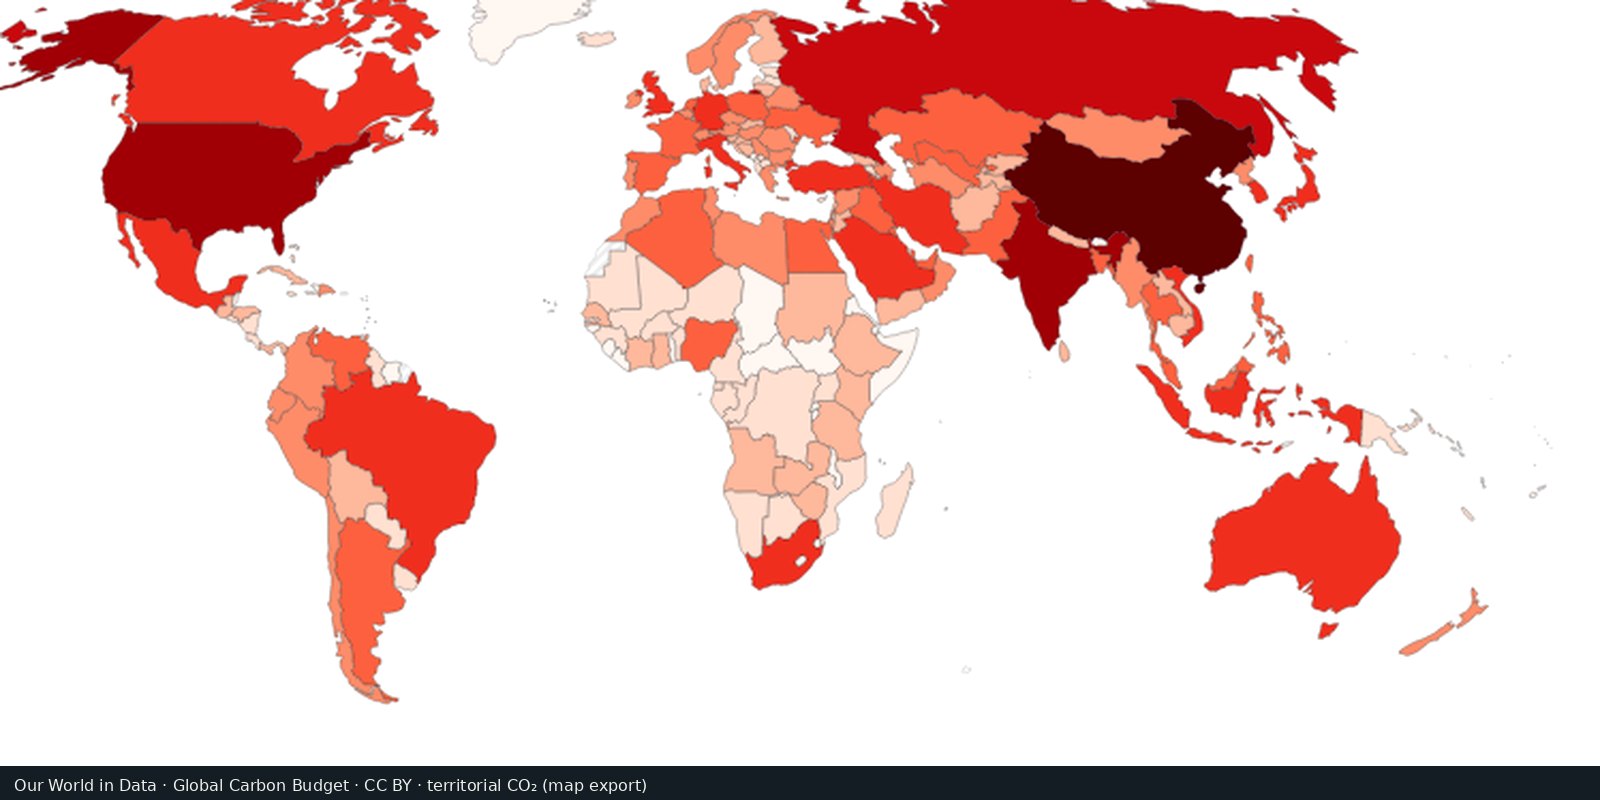
Carbon dioxide from fossil fuels and industry, by country of production: the Global Carbon Project series.
Read the card →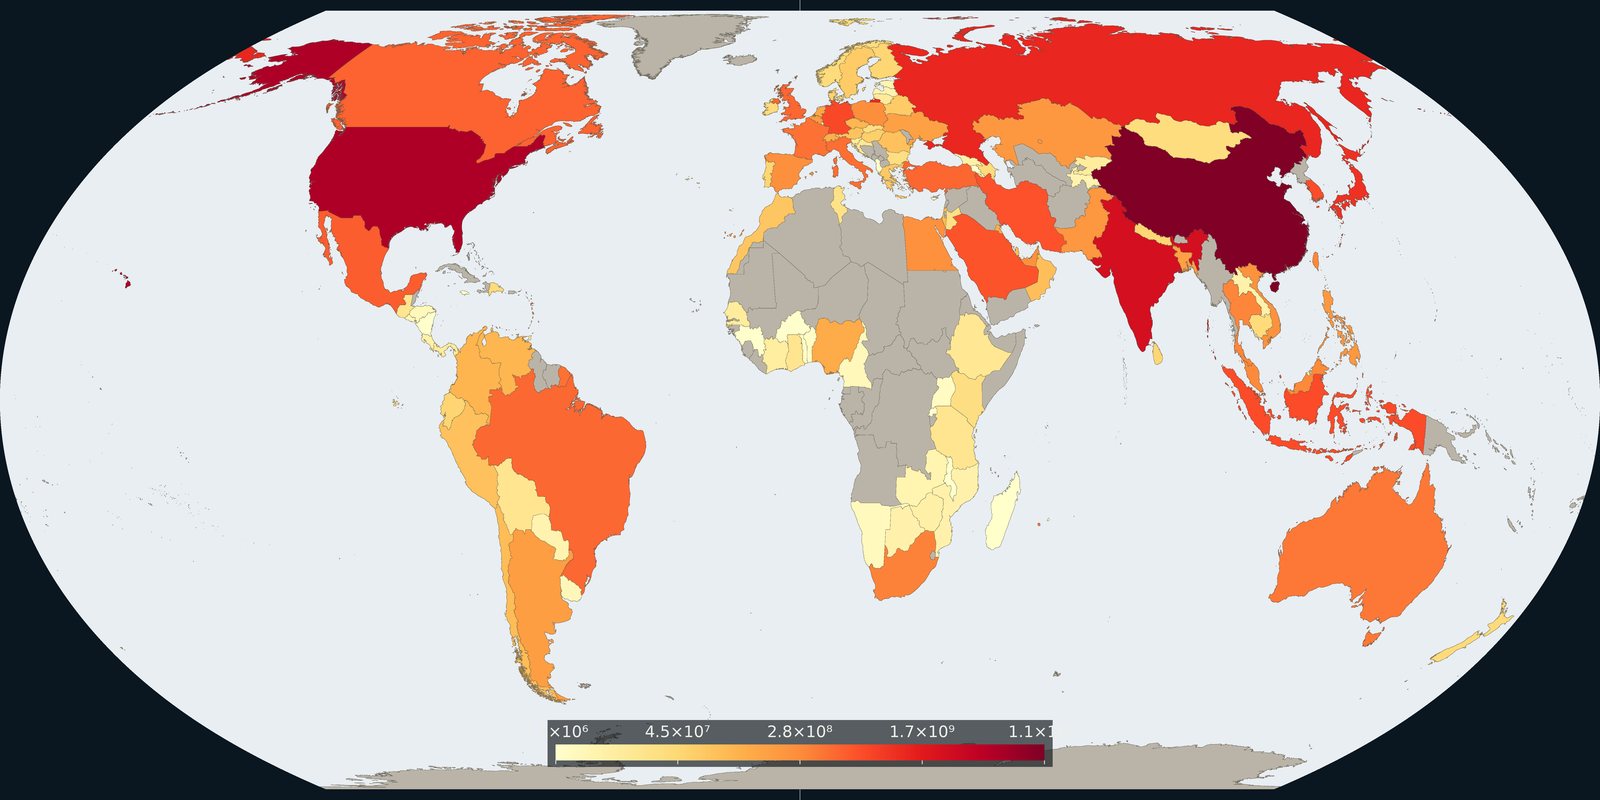
Carbon dioxide attributed to where goods and services are consumed, territorial inventories adjusted for trade, not a second production map.
Read the card →Source: Global Carbon Project / Our World in Data, consumption-based CO₂
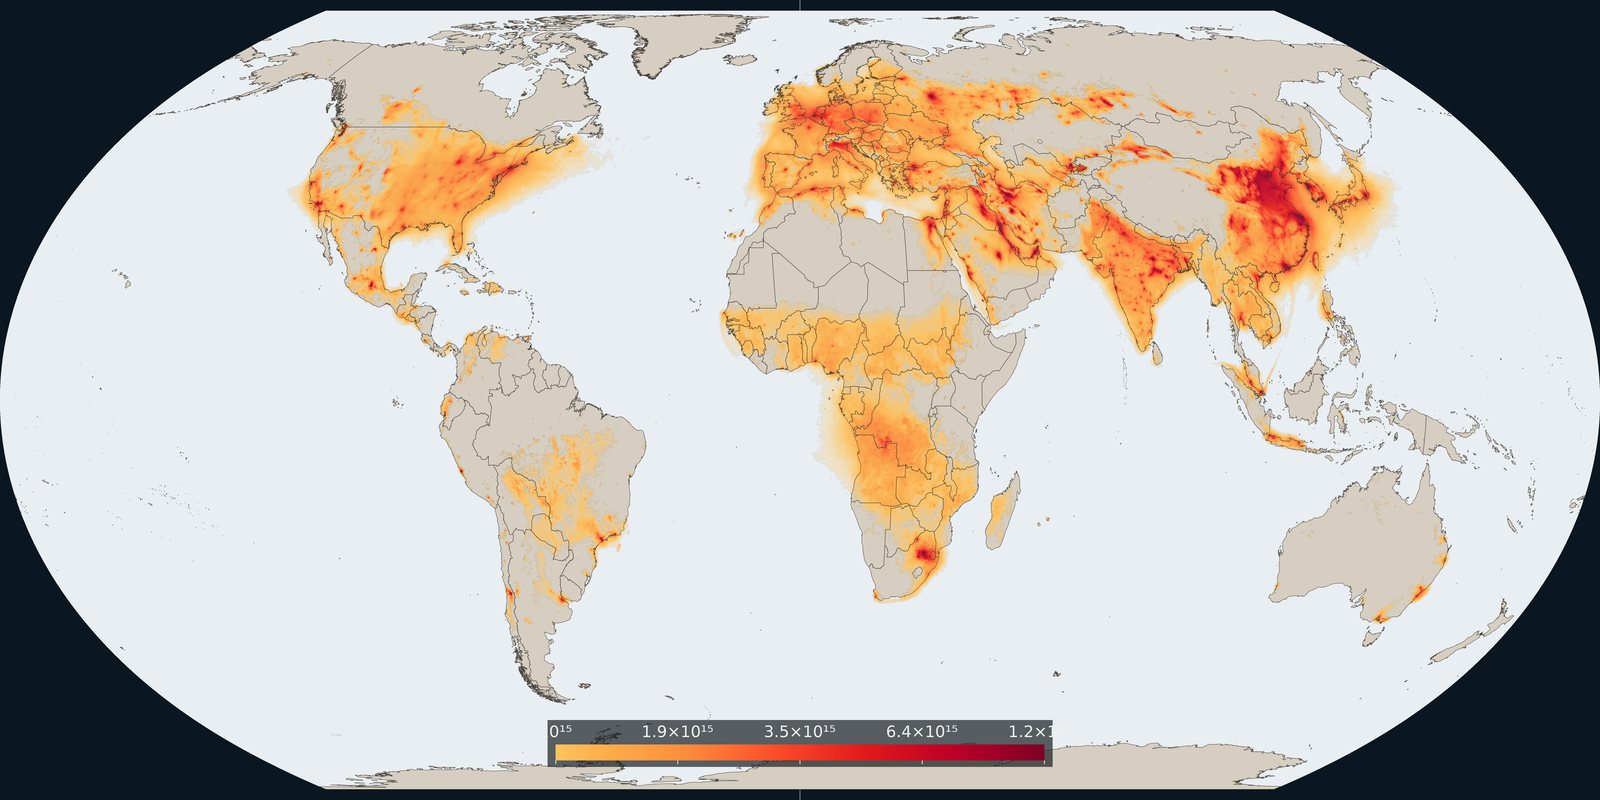
Satellite column of nitrogen dioxide over cities, industry, and shipping: combustion pollution, not the same as PM2.5 mass.
Read the card →Source: KNMI / TEMIS: monthly mean tropospheric NO₂ from TROPOMI
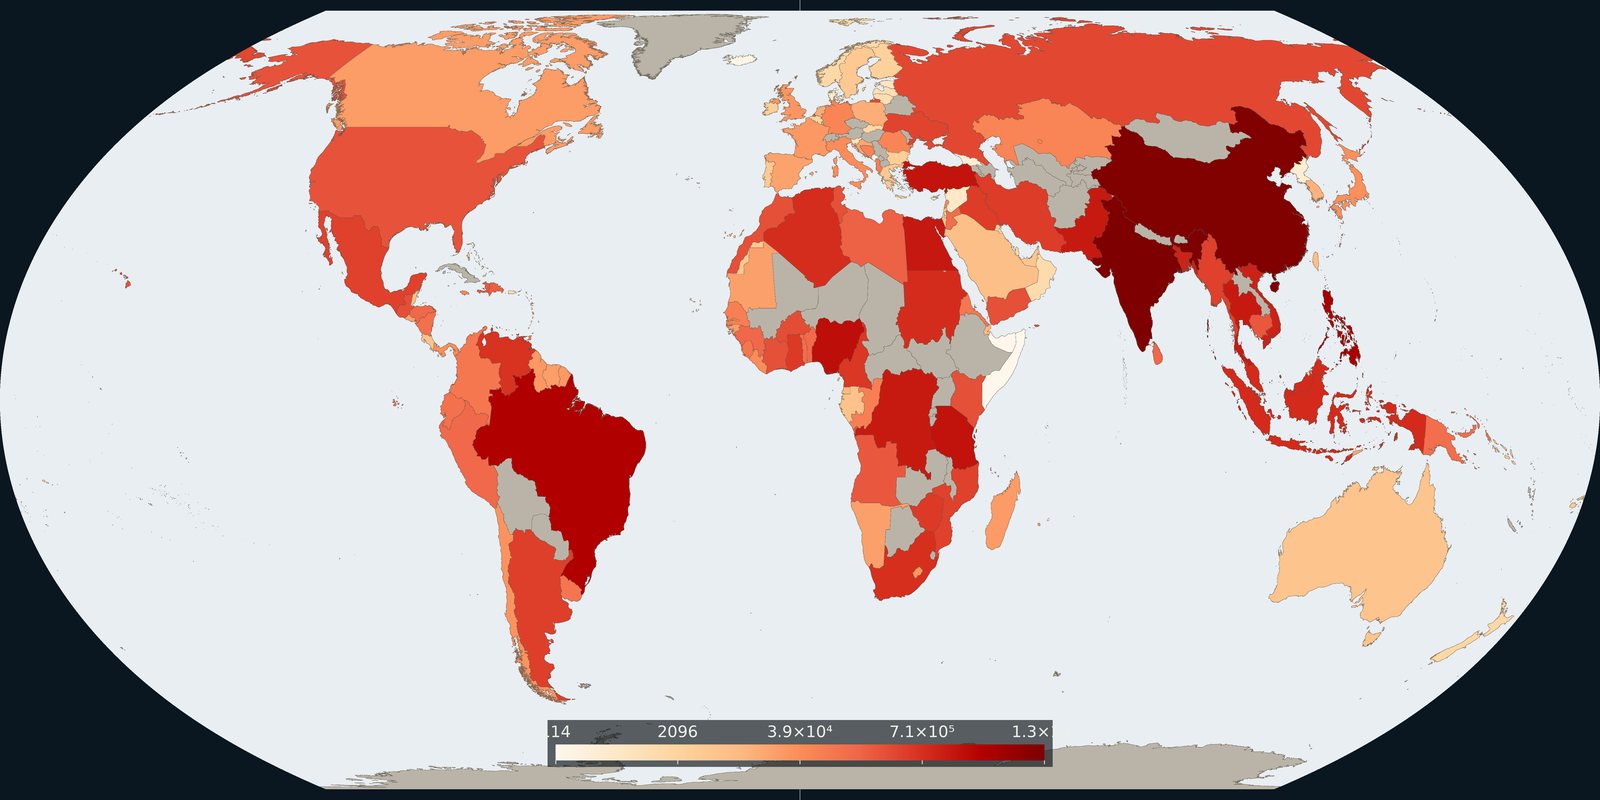
Plastic waste not recycled, incinerated, or sealed in landfill: the leak risk to rivers and coasts, not a beach litter photo.
Read the card →