

Pollution
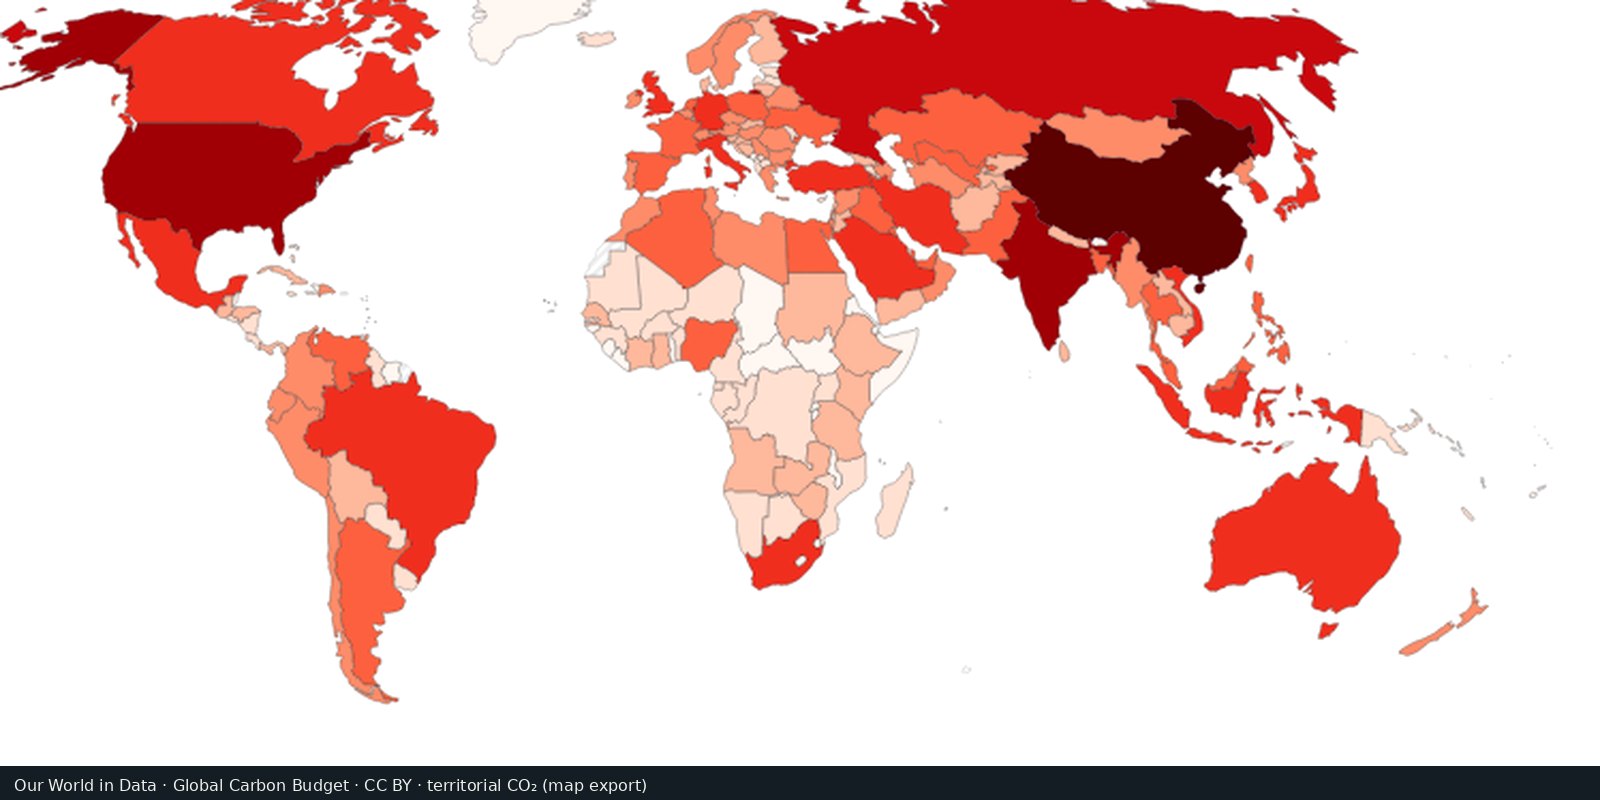
Territorial CO₂ emissions
Carbon dioxide from fossil fuels and industry, by country of production: the Global Carbon Project series.
Read the card →Outdoor fine particles that damage lungs and hearts, from satellites, models, and monitors, not a smell test.
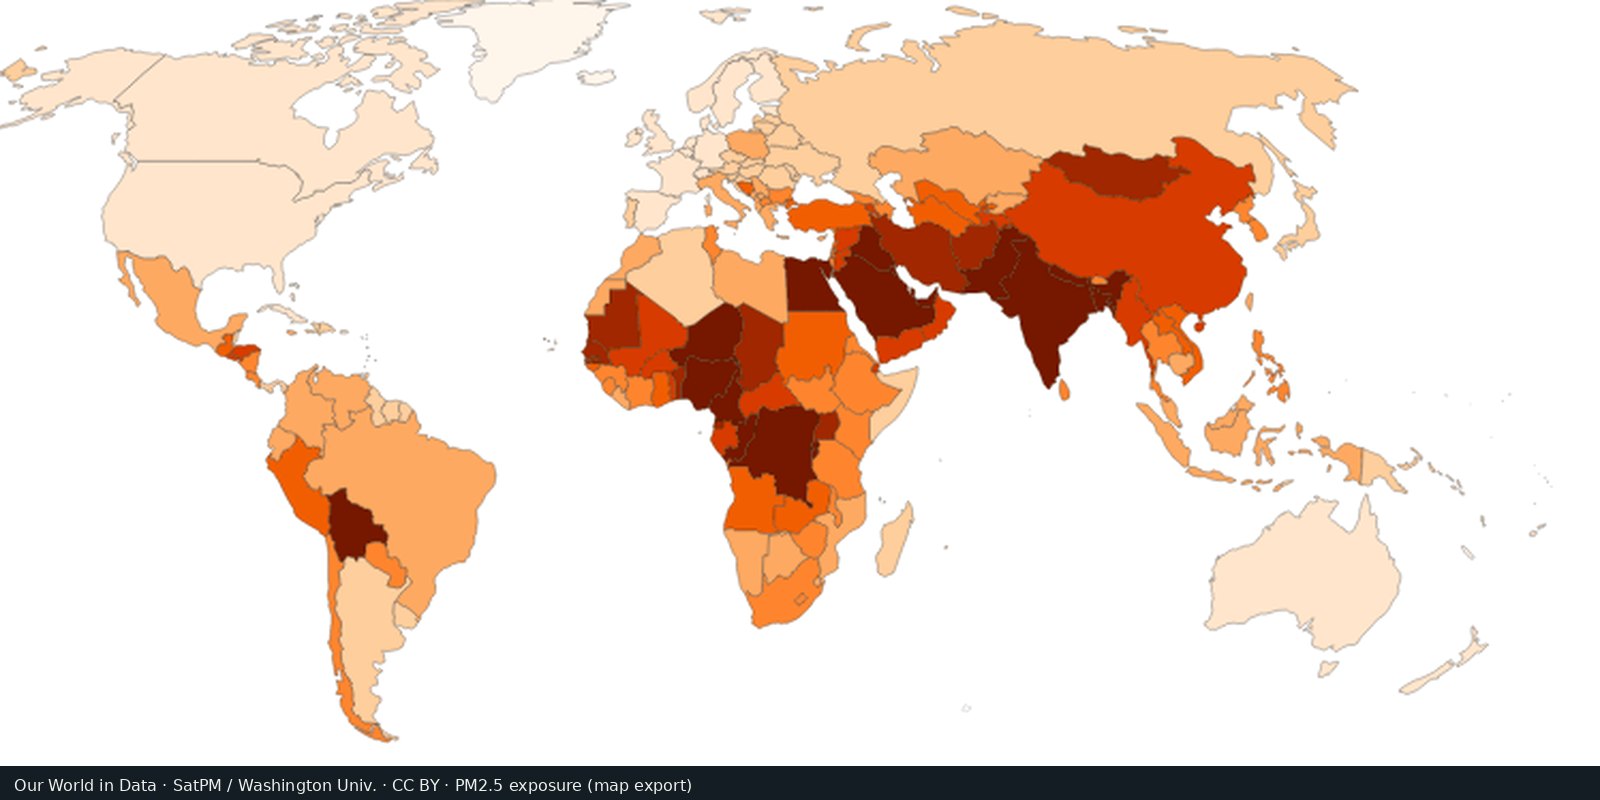
WHO publishes air-quality guidelines and a database of exposures. Our World in Data maps population-weighted PM2.5. NASA instruments (MODIS, VIIRS, and related missions) observe aerosols that help build those estimates. This card points to those public layers.
World Health Organization; Our World in Data; NASA Earth observations
Vintage: 2019-2022
https://www.who.int/data/gho/data/themes/air-pollution
NASA imagery is public domain. We host a cropped Our World in Data map export (CC BY) of population-weighted PM2.5. Open the OWID air-pollution map for the interactive layer.
Darker or higher values usually mean more annual average PM2.5. Cities can be far worse than a country mean. Indoor smoke and ozone are separate problems. WHO’s guideline (5 µg/m³ annual PM2.5) is a health benchmark, not a legal limit everywhere.
Satellite-model blends smooth local peaks. Ground monitors are uneven. Dust storms and fire seasons spike short periods. This page does not rank countries.
Open source map → Carbon dioxide from fossil fuels and industry, by country of production: the Global Carbon Project series.
Read the card →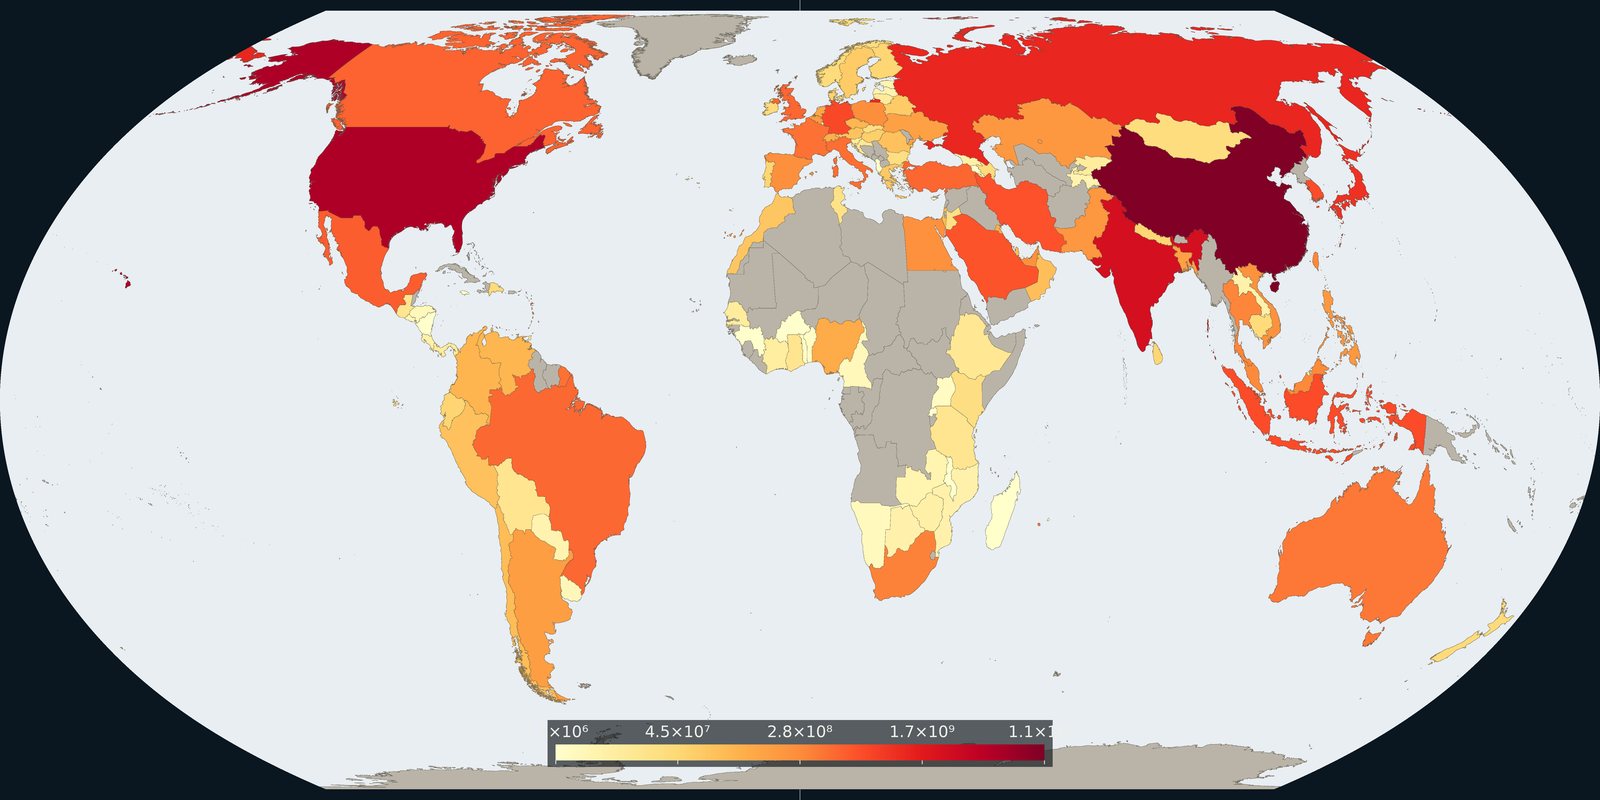
Carbon dioxide attributed to where goods and services are consumed, territorial inventories adjusted for trade, not a second production map.
Read the card →Source: Global Carbon Project / Our World in Data, consumption-based CO₂
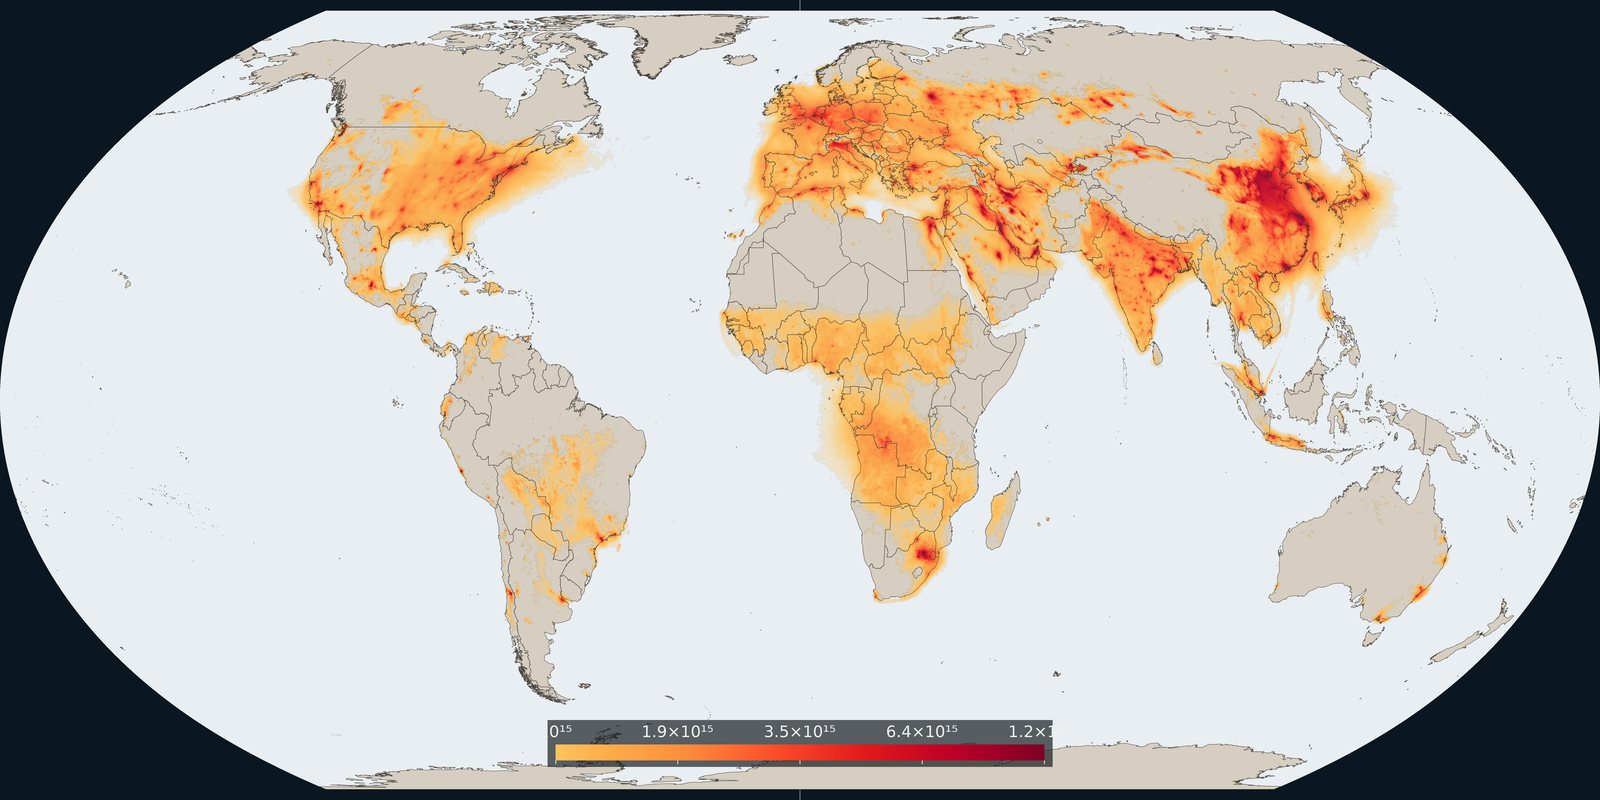
Satellite column of nitrogen dioxide over cities, industry, and shipping: combustion pollution, not the same as PM2.5 mass.
Read the card →Source: KNMI / TEMIS: monthly mean tropospheric NO₂ from TROPOMI
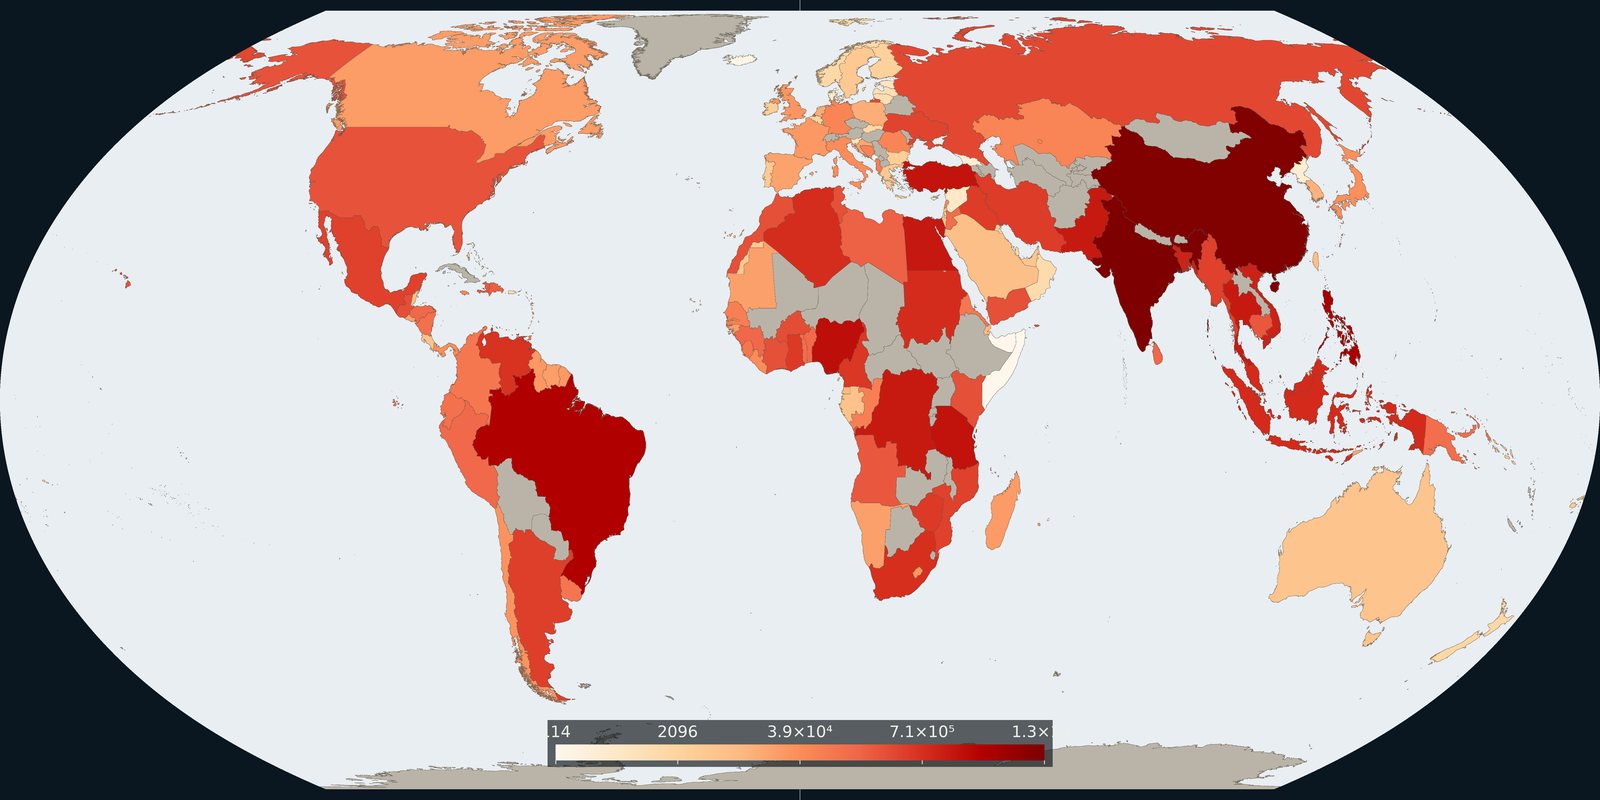
Plastic waste not recycled, incinerated, or sealed in landfill: the leak risk to rivers and coasts, not a beach litter photo.
Read the card →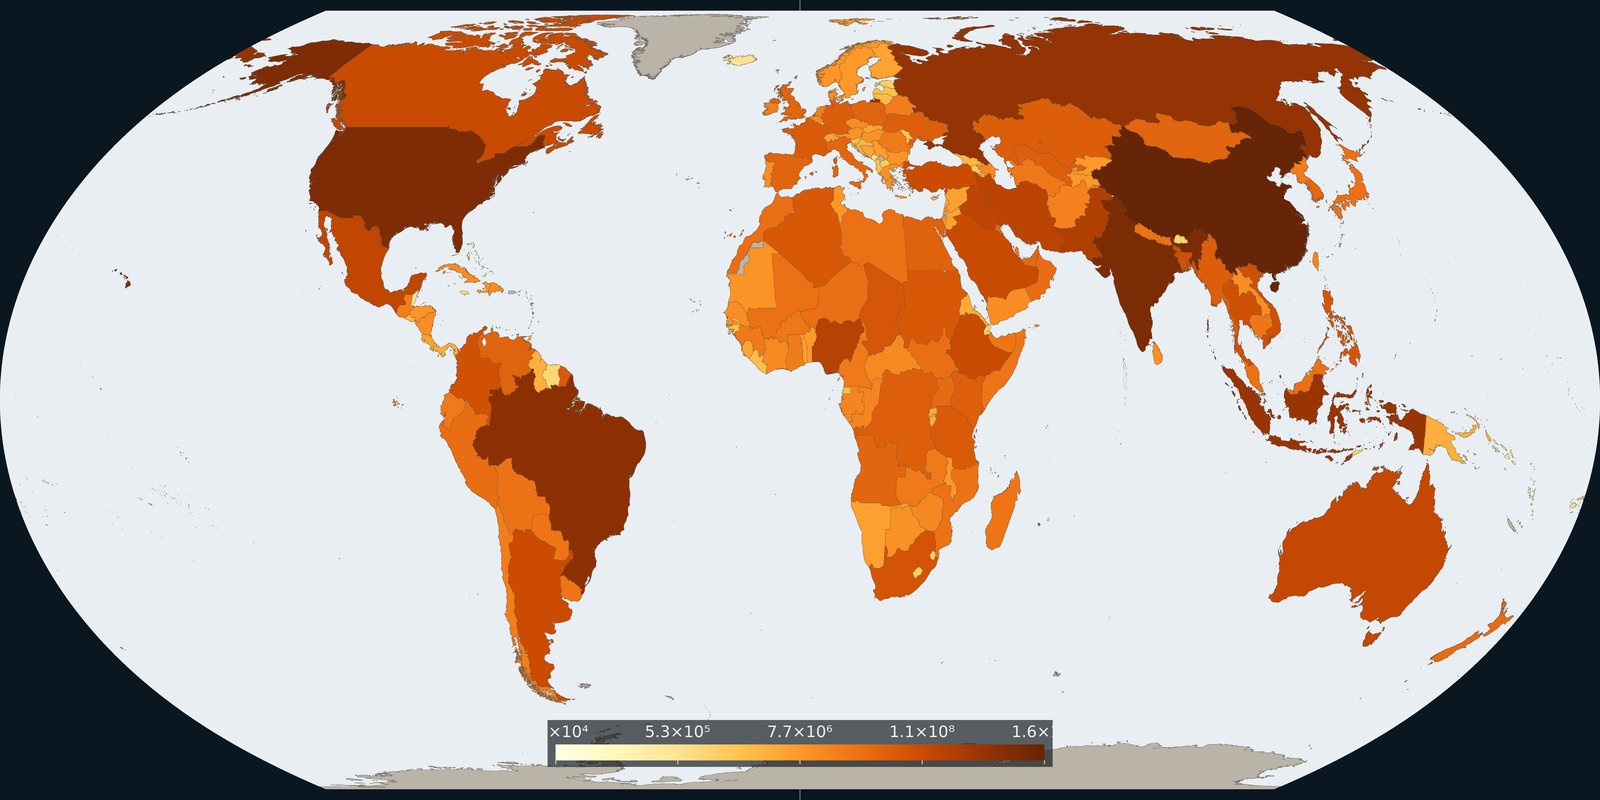
Country and grid maps of methane from fossil fuels, agriculture, and waste: a different greenhouse gas than the CO₂ cards.
Read the card →