

Pollution
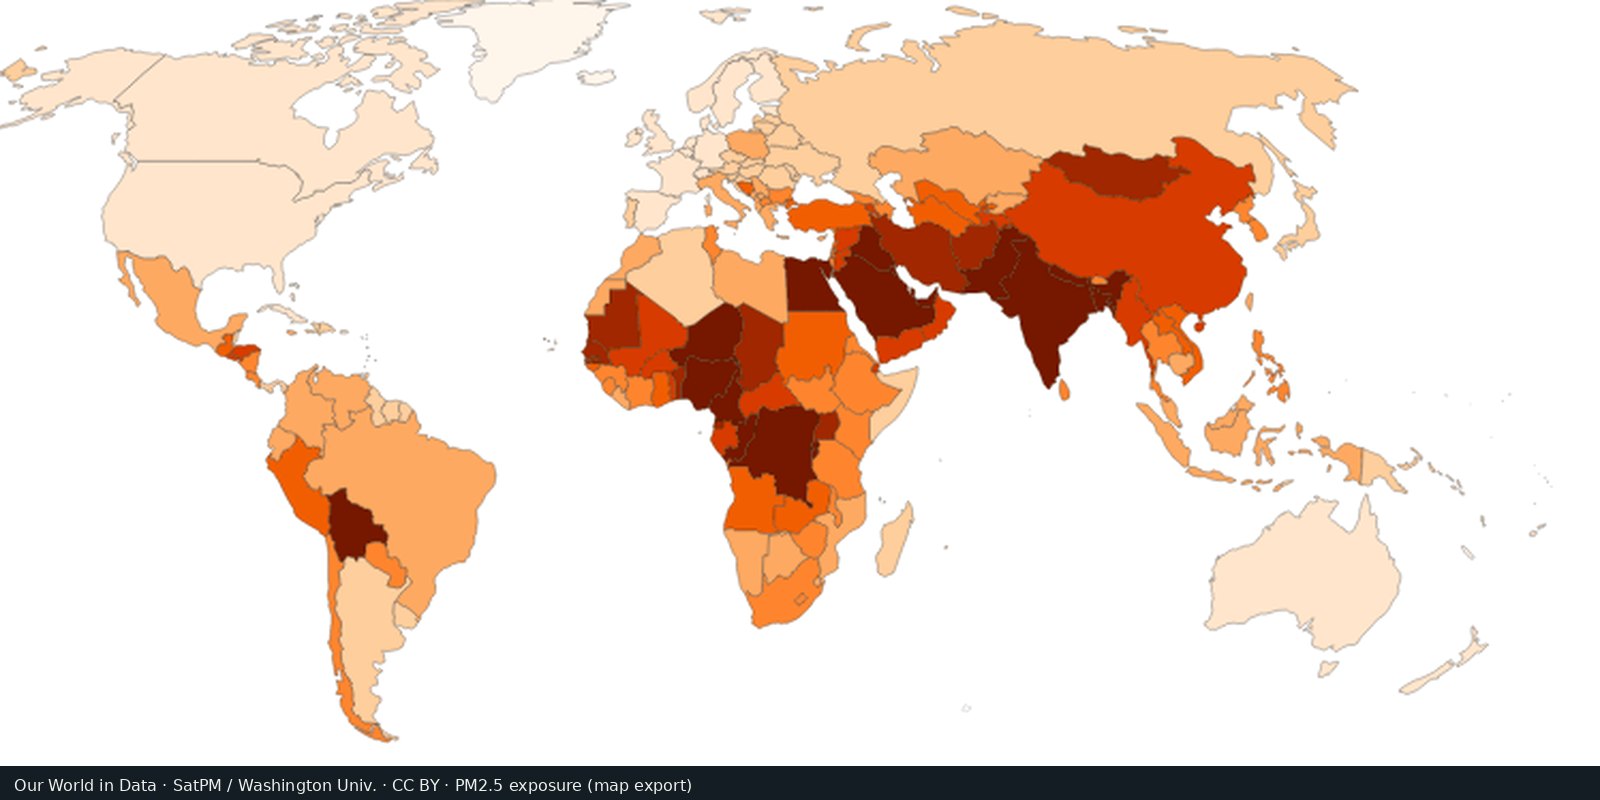
Fine particle air pollution (PM2.5)
Outdoor fine particles that damage lungs and hearts, from satellites, models, and monitors, not a smell test.
Read the card →Plastic waste not recycled, incinerated, or sealed in landfill: the leak risk to rivers and coasts, not a beach litter photo.
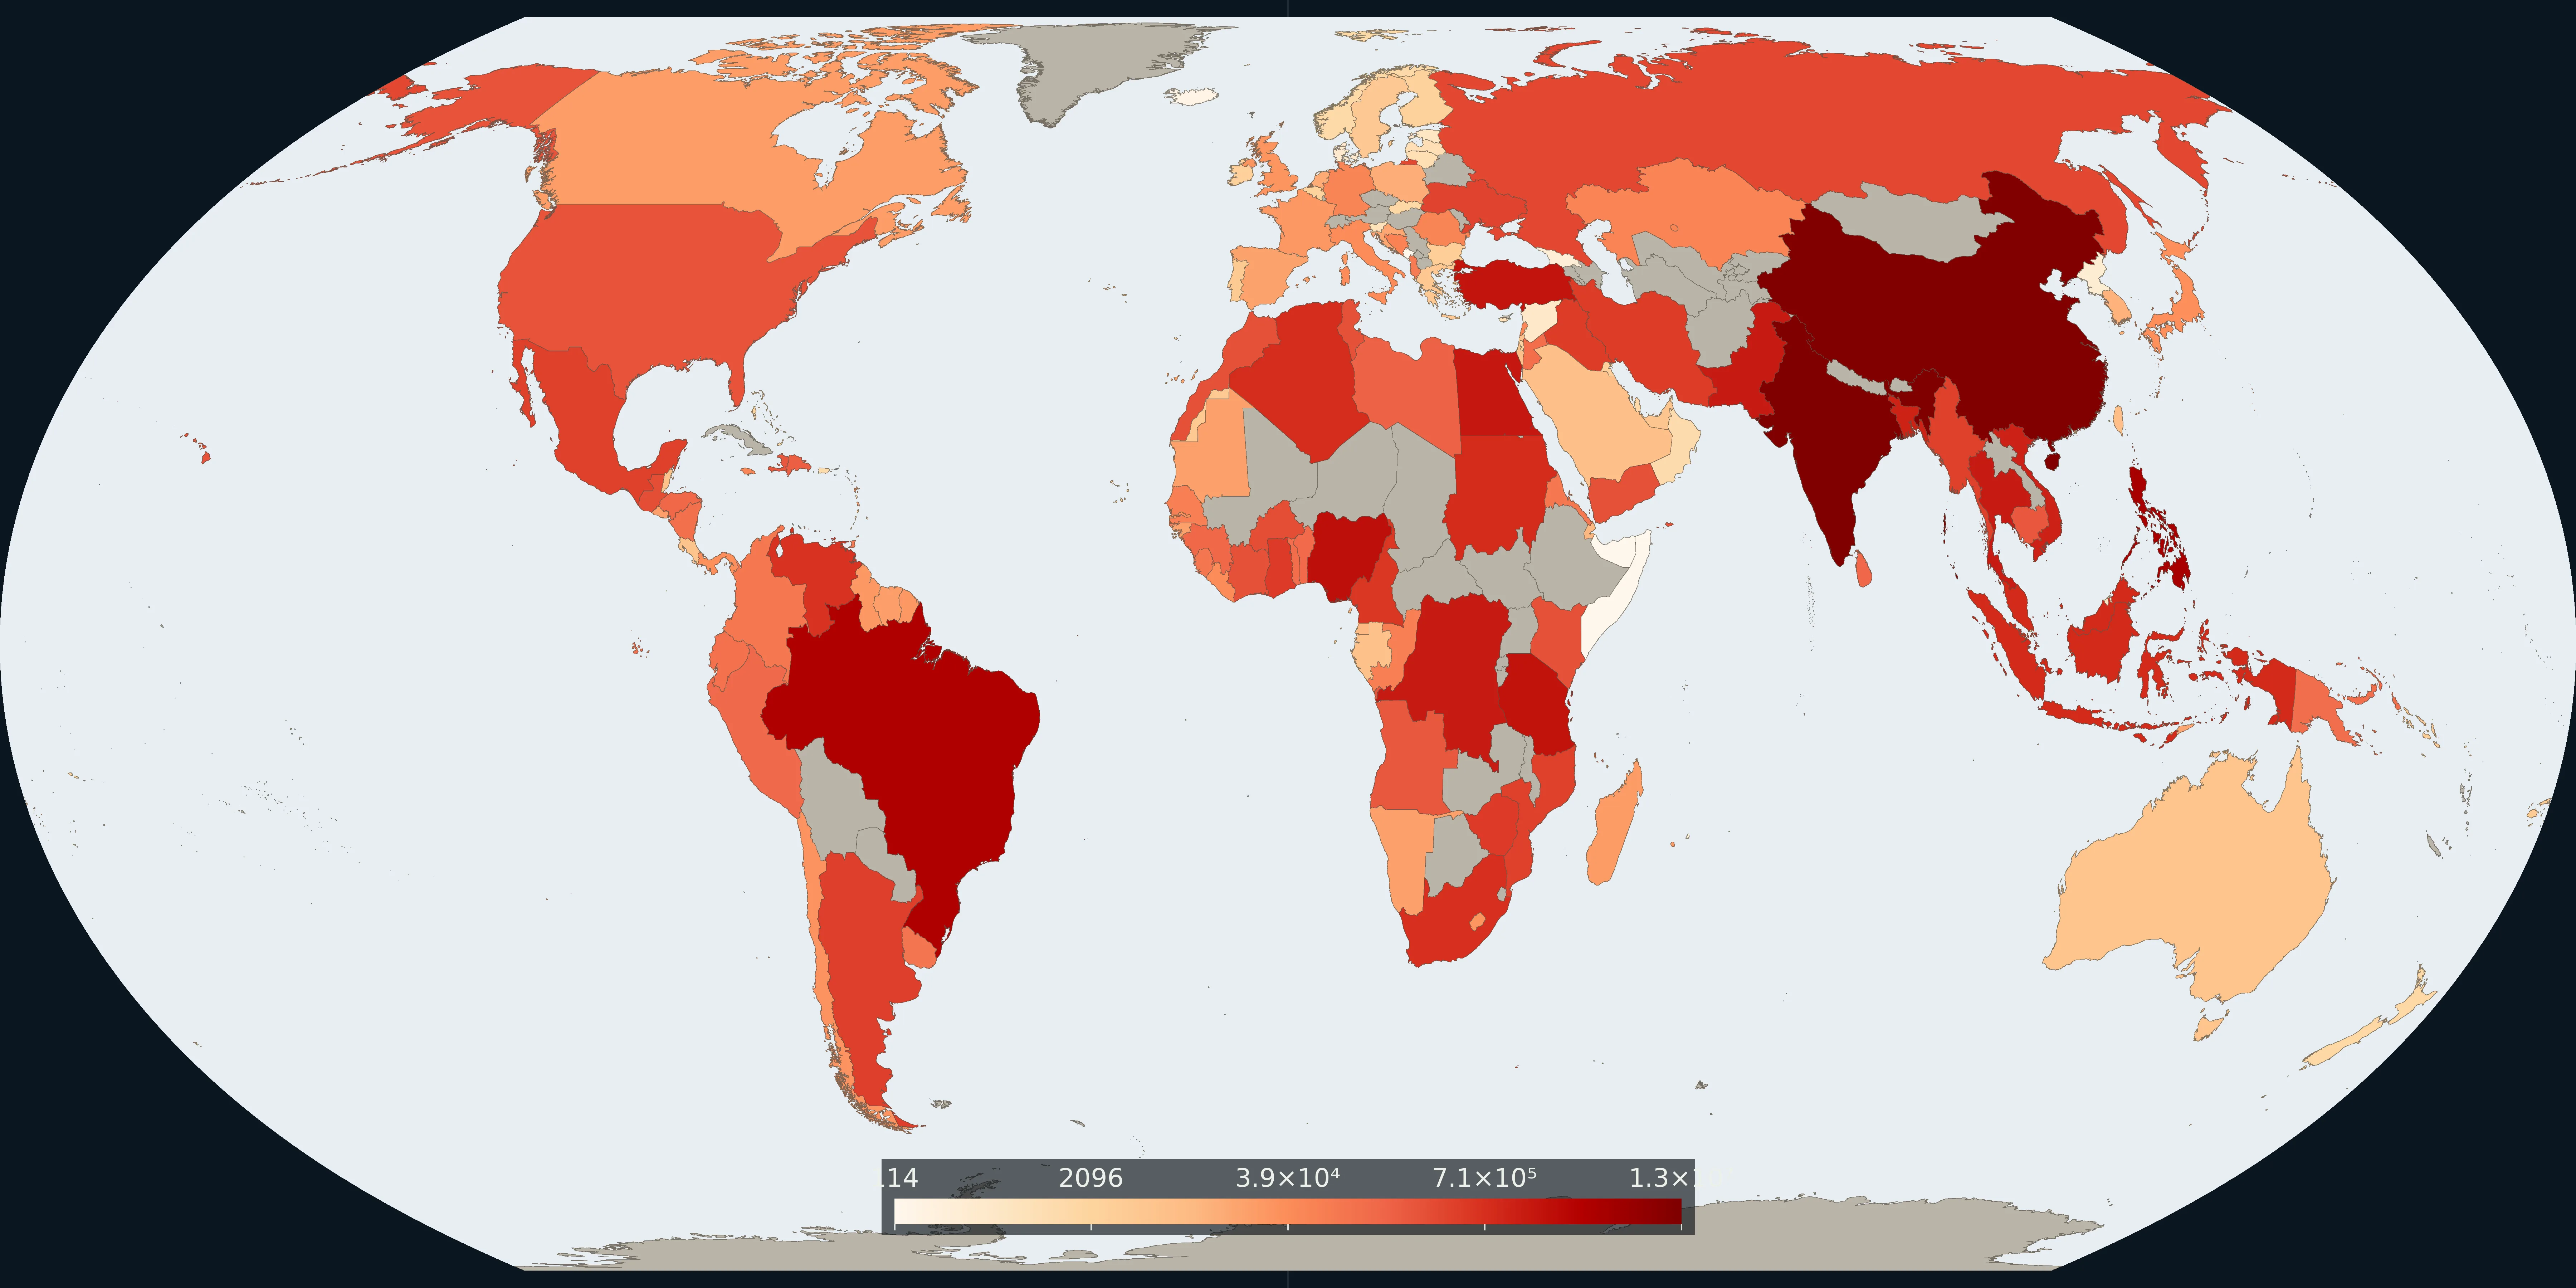
Map: Fix Planet from Meijer and co-authors, mismanaged plastic waste, 2019. Units: tonnes per year. Boundaries: Natural Earth.
Country estimates of mismanaged plastic waste compiled and mapped by Our World in Data after Meijer et al. (2021) (Science Advances; open full text on PMC). Mismanaged means plastic that is not recycled, incinerated, or kept in sealed landfill: the fraction most likely to escape into the environment. Related OWID layers show plastic emitted to the ocean and the share of waste that is mismanaged.
The Pollution shelf covers waste beside air and emissions. The PM2.5 and territorial CO₂ cards do not answer where plastic waste systems fail to contain material. This card is not a count of CO₂ produced and not a count of battle deaths.
A high mismanaged mass often tracks population and weak waste infrastructure more than character. Landlocked countries can mismanage plastic without large ocean emissions. Prefer the interactive OWID map and cite Meijer et al. via PMC. The preview is a Fix Planet overview, not a stock ocean-plastic image.
A high mismanaged mass often tracks population and weak waste infrastructure, not a country’s character. Landlocked countries can mismanage plastic without large ocean emissions. This is not a CO₂ inventory, not PM2.5, and not a beach-litter photograph.
The preview is a Fix Planet overview of mismanaged plastic waste, not an ocean-gyre stock photo and not Our World in Data’s marketing crop. Attribute Our World in Data (CC BY) after Meijer et al. 2021. The open paper is on PMC. Open the OWID map for the interactive layer.
Open source map → Outdoor fine particles that damage lungs and hearts, from satellites, models, and monitors, not a smell test.
Read the card →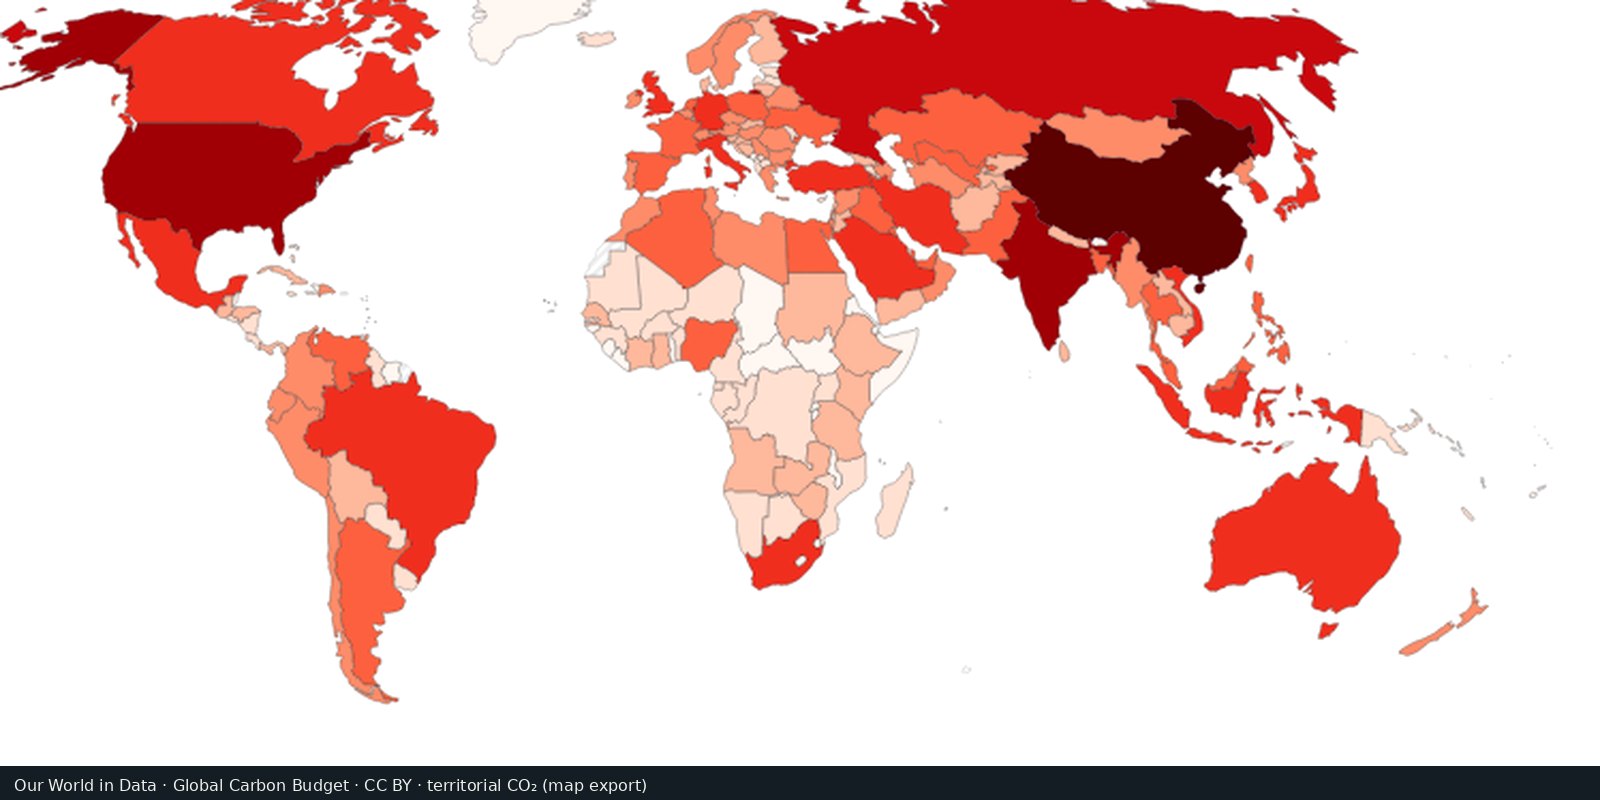
Carbon dioxide from fossil fuels and industry, by country of production: the Global Carbon Project series.
Read the card →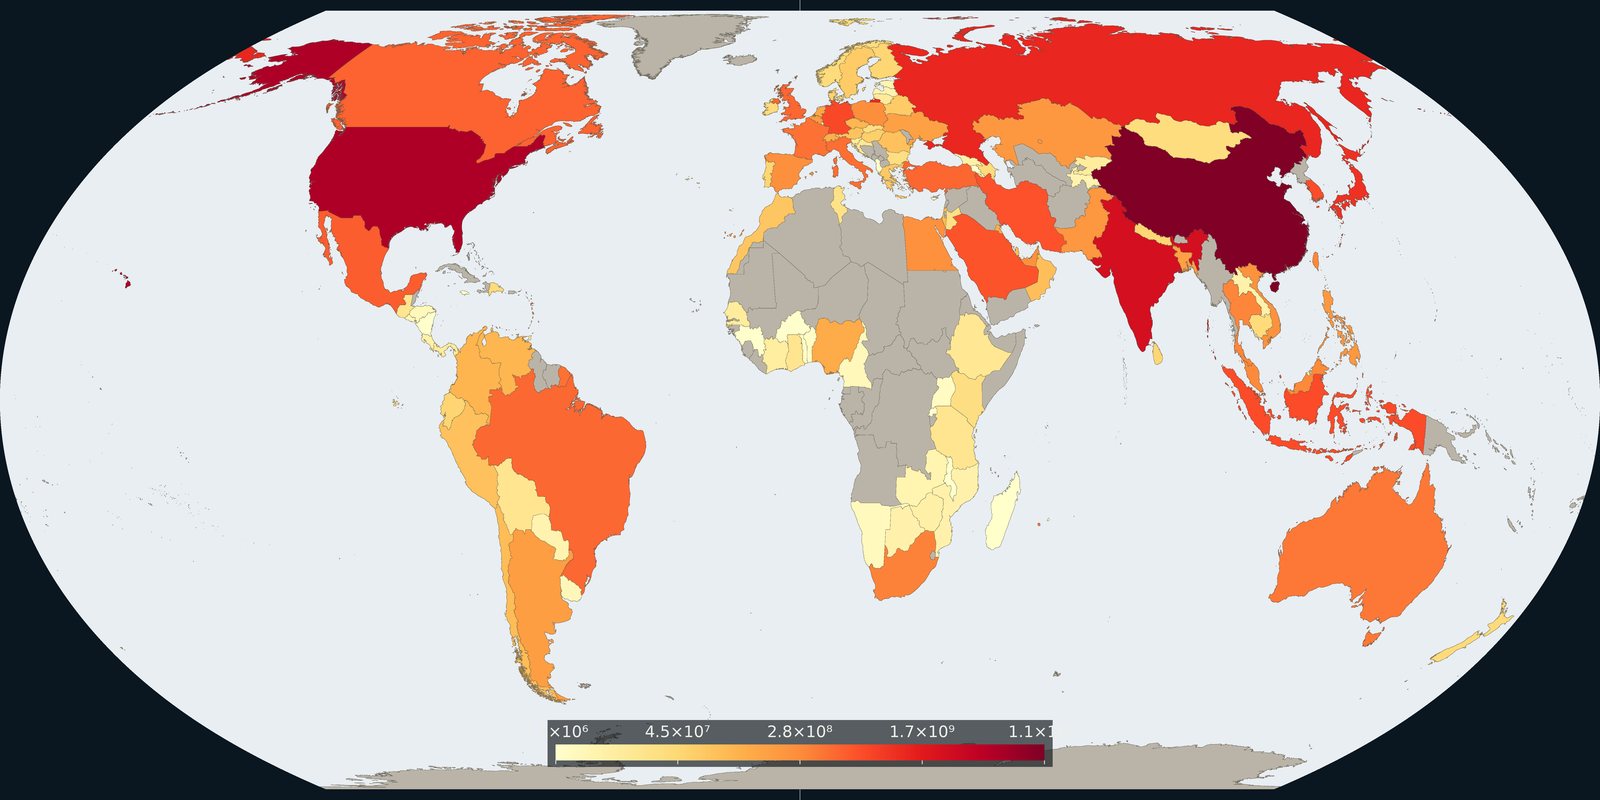
Carbon dioxide attributed to where goods and services are consumed, territorial inventories adjusted for trade, not a second production map.
Read the card →Source: Global Carbon Project / Our World in Data, consumption-based CO₂
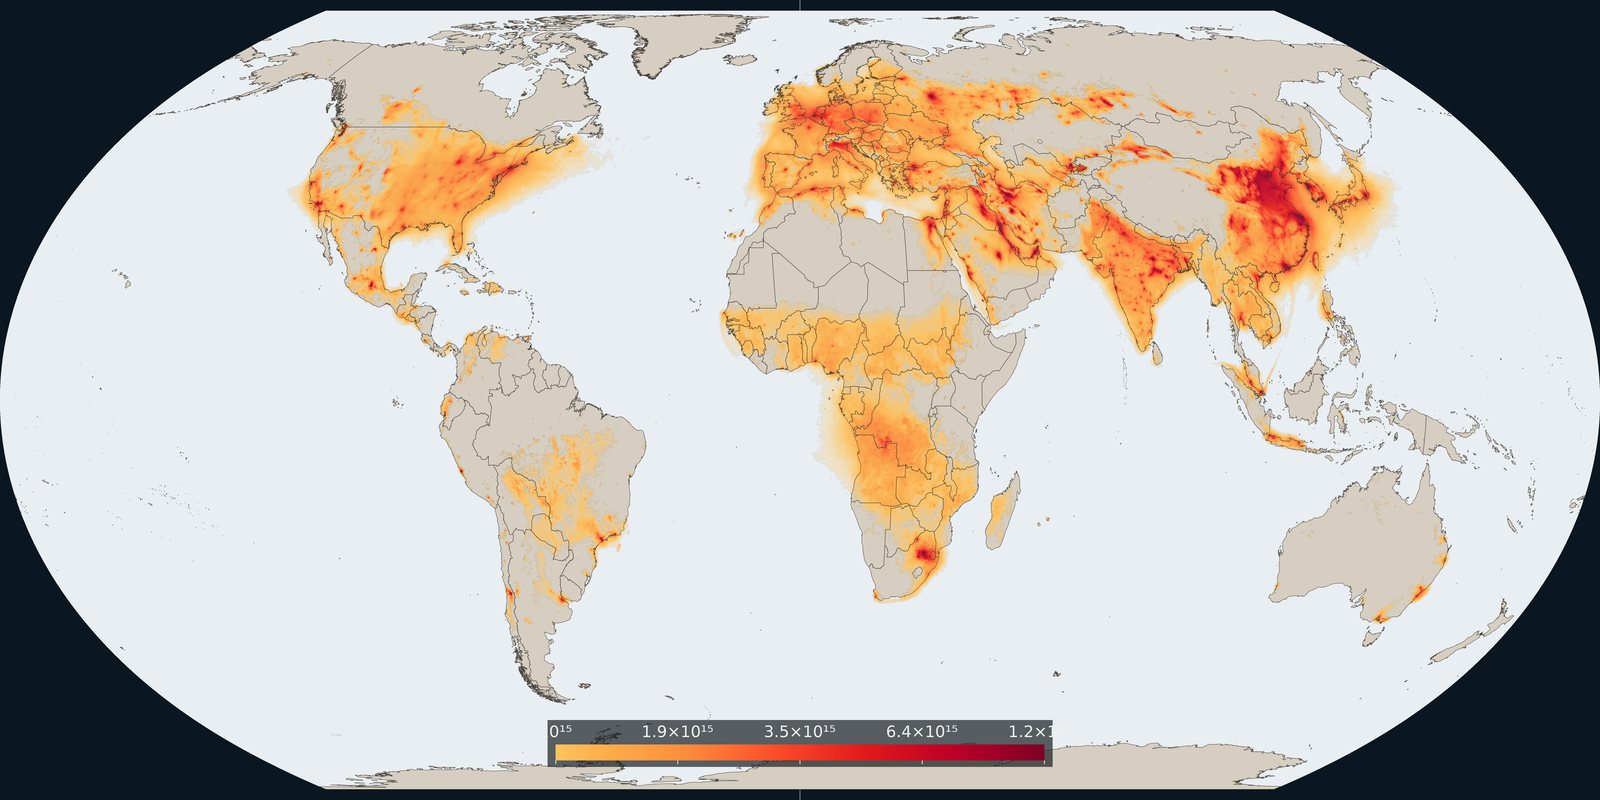
Satellite column of nitrogen dioxide over cities, industry, and shipping: combustion pollution, not the same as PM2.5 mass.
Read the card →Source: KNMI / TEMIS: monthly mean tropospheric NO₂ from TROPOMI
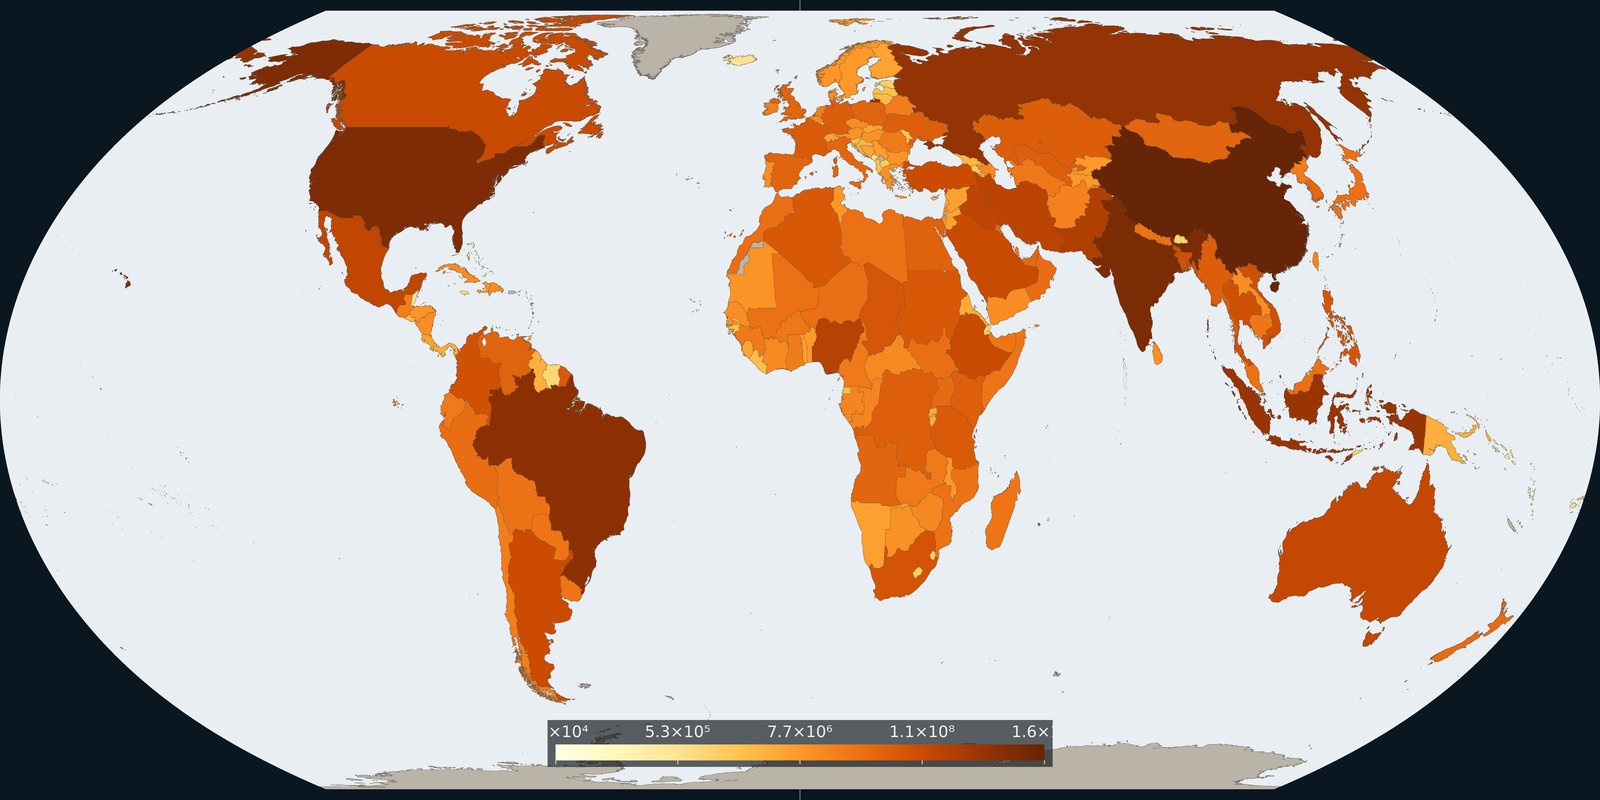
Country and grid maps of methane from fossil fuels, agriculture, and waste: a different greenhouse gas than the CO₂ cards.
Read the card →