
Cost of sending money home
Sending remittances still costs about 6.4% of the amount on a global average: more than double the Sustainable Development Goal (SDG) target of 3%, and the World Bank’s Remittance Prices Worldwide website, updated 18 August 2025, shows about 6.36%.
Prices · RPW
6.4 percent, global average, late 2023
- Global average, fourth quarter 2023
- 6.4%
- Remittance Prices Worldwide, 18 August 2025
- about 6.36%
- Sustainable Development Goal target
- 3%
What the number is
The World Bank Remittance Prices Worldwide (RPW) database tracks the cost of sending a typical small transfer (often benchmarked at $200) across hundreds of country corridors. Migration and Development Brief 40 reported a global average of 6.4% in the fourth quarter of 2023 (up from 6.2% a year earlier). The Remittance Prices Worldwide website, last updated 18 August 2025, highlights a global average near 6.36% across 367 corridors (48 sending / 105 receiving countries).
Why it matters
Every percentage point of fee is money that does not reach households. Digital channels are usually cheaper than non-digital ones; Sub-Saharan corridors have often been among the most expensive. The SDG 10 target is to bring the global average to 3% by 2030: current averages remain well above that line.
How to read it
A global average hides corridor extremes: some corridors cost several times the average. Remittance Prices Worldwide measures the price of a transfer; on its website readers can compare costs corridor by corridor.
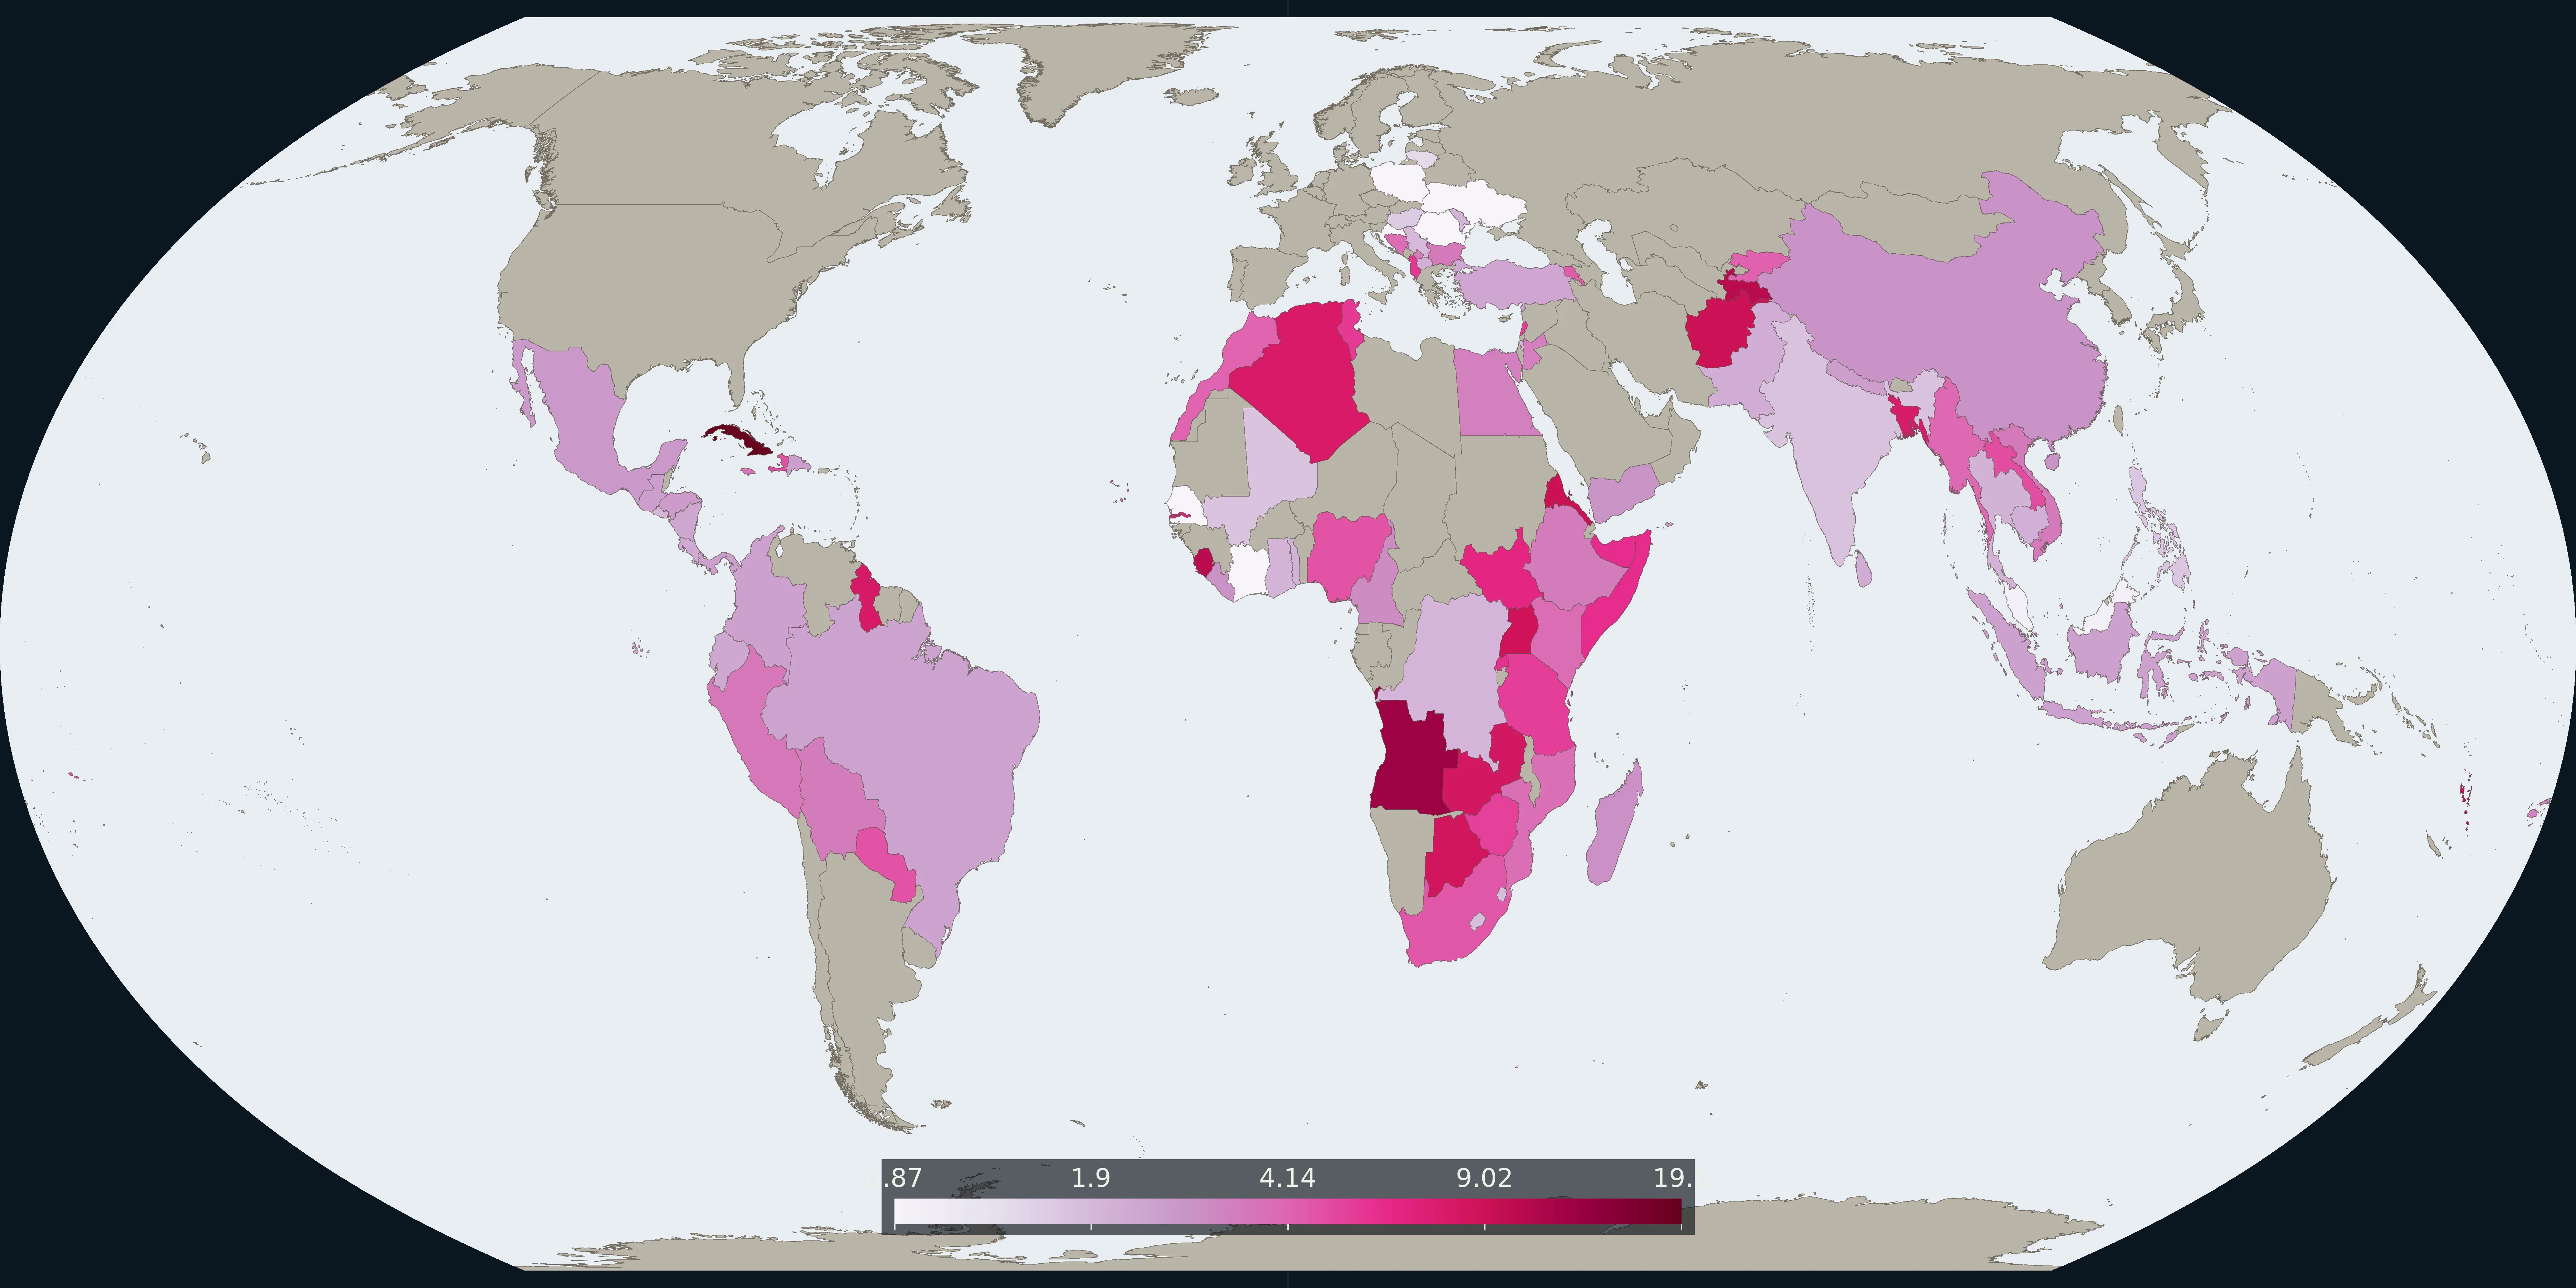
Map: average cost of sending remittances to a country, 2023, World Bank World Development Indicators. These figures differ from the global averages in the text.
Sources
- World Bank: World Development Indicators, average cost of sending remittances to a country
- World Bank: Remittance Prices Worldwide
- World Bank: Remittance Prices Worldwide, Issue 50 (June 2024)
- World Bank: Migration and Development Brief 40 (June 2024)
- World Bank: press release, 26 June 2024: Remittances Slowed in 2023, Expected to Grow Faster in 2024