
Remittances
-
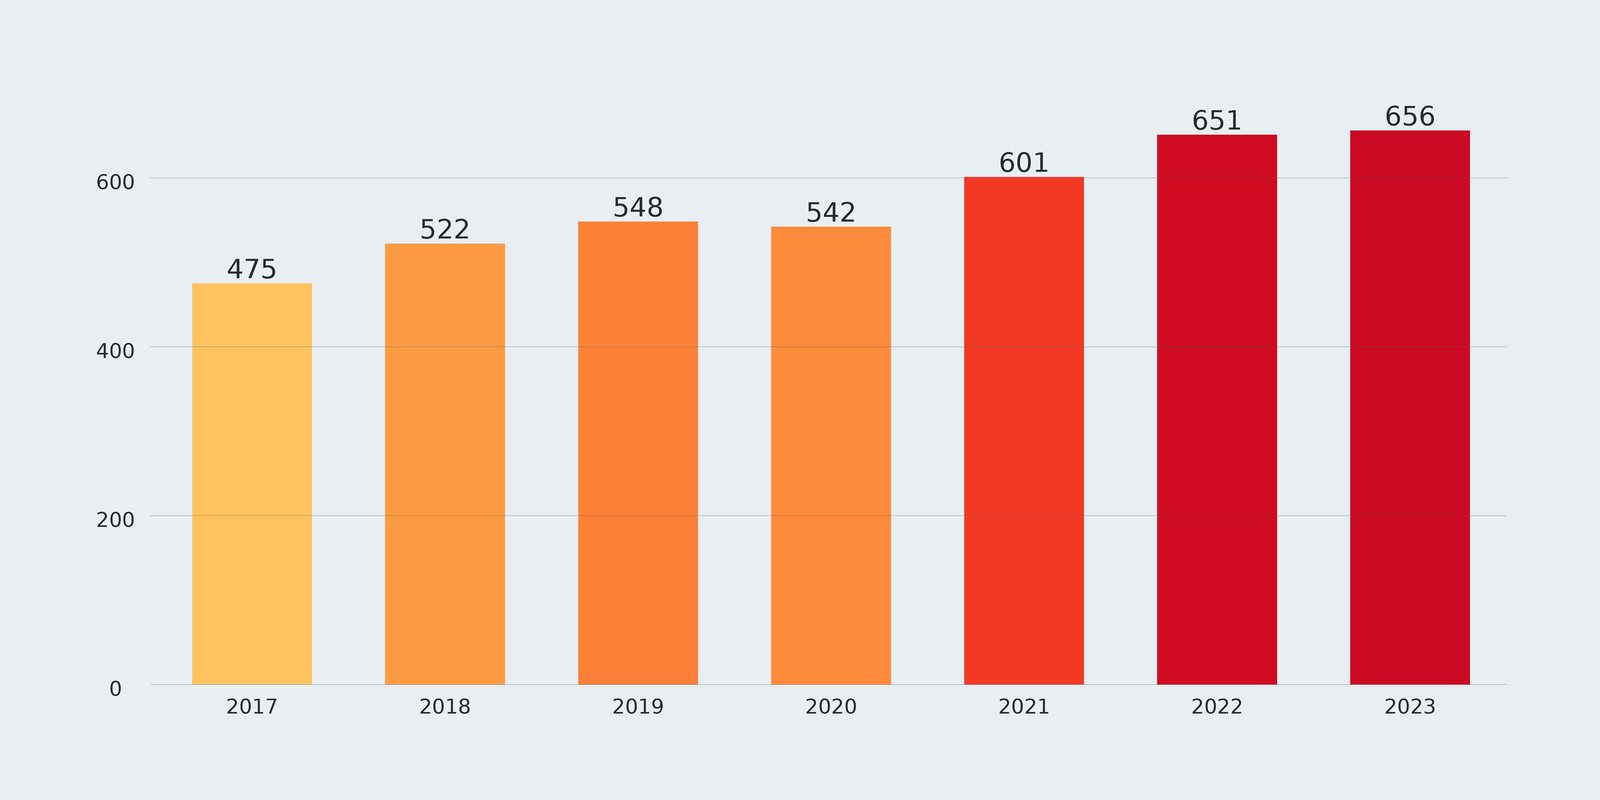
Chart: Fix Planet from World Bank Migration and Development Brief 40, Table 1.1, low- and middle-income countries, 2017-2023. The number is billions of US dollars. CC BY 3.0 IGO. This is an adaptation of an original work by The World Bank. Views and opinions expressed in the adaptation are the sole responsibility of the author or authors of the adaptation and are not endorsed by The World Bank.
Flows · Low and middle income
Remittances to developing countries
656 billion US dollars, 2023
Low- and middle-income countries received an estimated $656 billion in officially recorded remittances in 2023, and World Bank authors put the 2024 total near $685 billion: still larger than foreign direct investment and official development assistance combined.
- 2023
- $656 billion (+0.7%)
- 2024 estimate
- about $685 billion (+5.8%)
Chart: low- and middle-income remittances, 2017-2023, World Bank Migration and Development Brief 40. The number is billions of US dollars.
Read entry → -
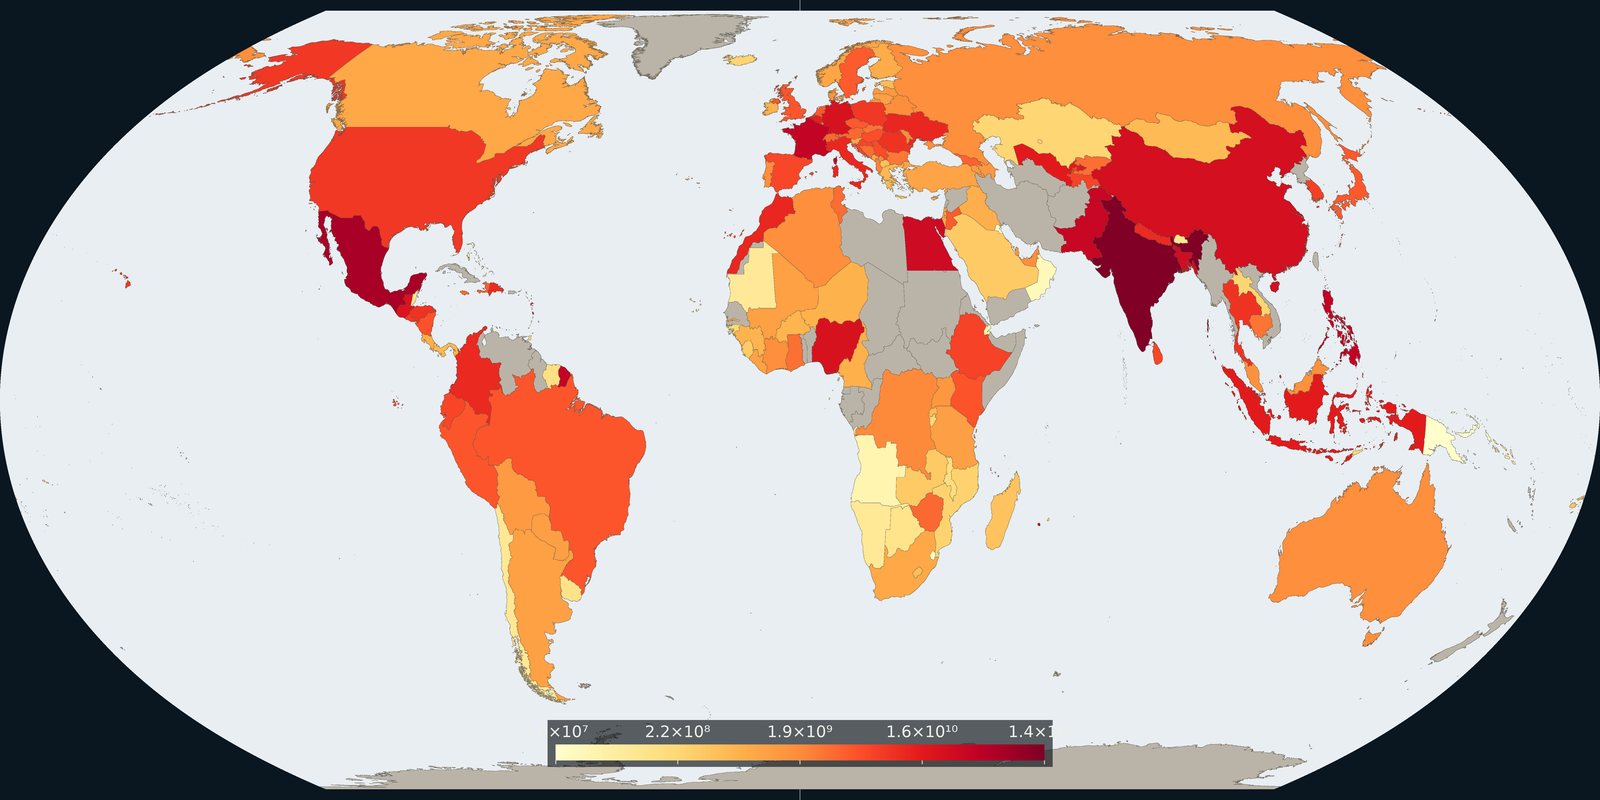
Map: Fix Planet from World Bank World Development Indicators, personal remittances received, current US dollars, 2024. The colour bar is US dollars per year on a logarithmic scale. Land without a 2024 figure stays grey. CC BY 4.0. Boundaries: Natural Earth.
Recipients · 2024 estimates
Where remittances arrive
138 billion US dollars, India on the 2024 map
Five countries were expected to receive the largest remittance inflows in 2024: India ~$129B, Mexico ~$68B, China ~$48B, the Philippines ~$40B, and Pakistan ~$33B.
- India, 2024 estimate
- ~$129 billion
- Mexico, 2024 estimate
- ~$68 billion
- China, 2024 estimate
- ~$48 billion
- Philippines, 2024 estimate
- ~$40 billion
- Pakistan, 2024 estimate
- ~$33 billion
Map: personal remittances received, 2024, World Bank World Development Indicators. These figures follow balance-of-payments definitions and differ from the estimates in the list.
Read entry → -
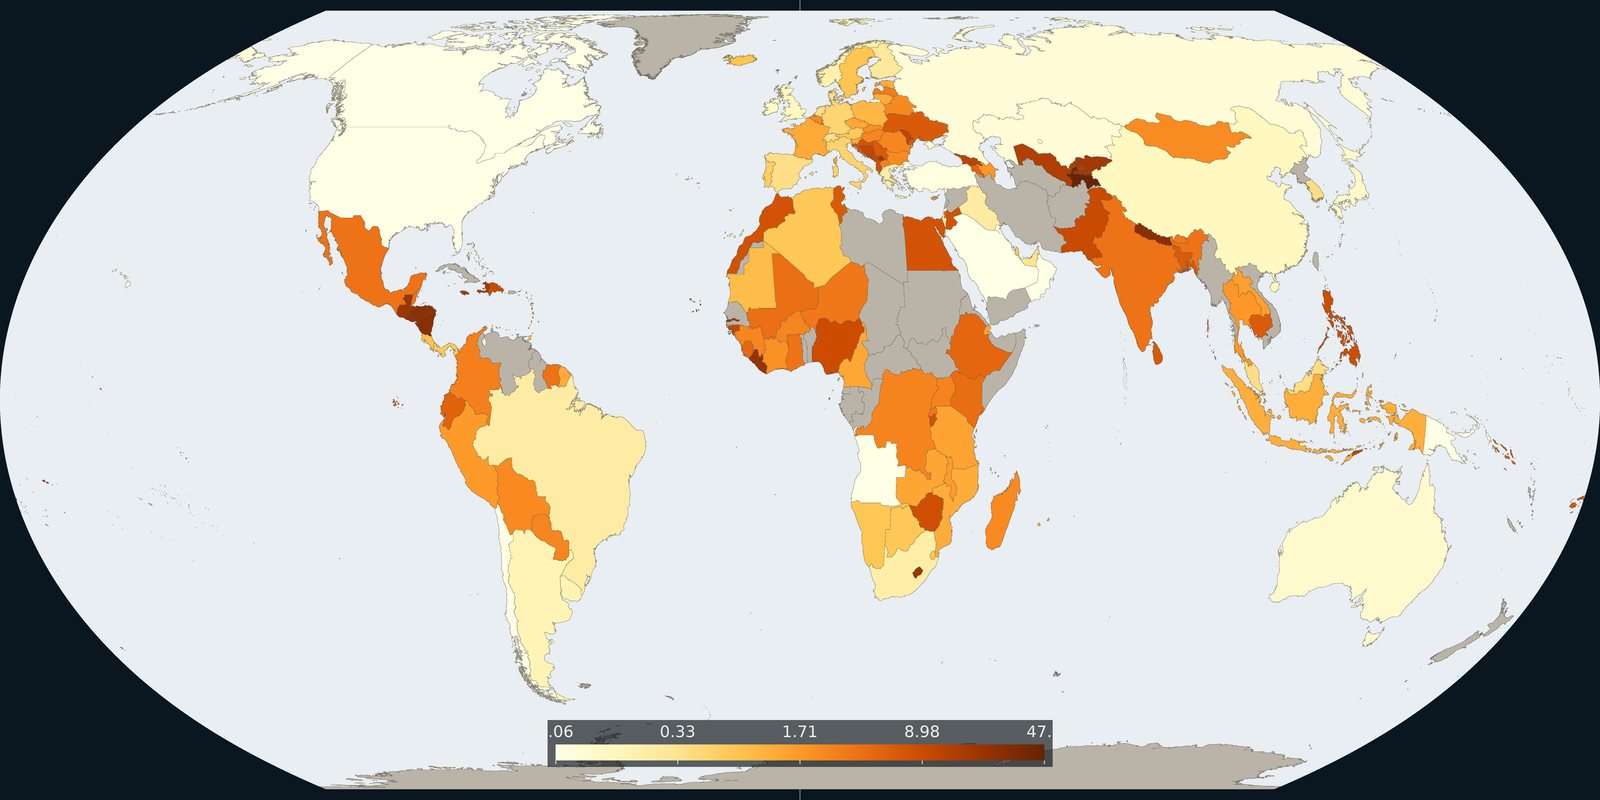
Map: Fix Planet from World Bank World Development Indicators, personal remittances received as a percentage of GDP, 2024. The colour bar is percent of GDP on a logarithmic scale. Land without a 2024 figure stays grey. CC BY 4.0. Boundaries: Natural Earth.
Dependence · 2024 estimates
Remittances as a share of GDP
47 percent of GDP, Tajikistan on the 2024 map
In smaller economies remittances can dwarf other finance: Tajikistan ~45% of GDP, Tonga ~38%, then Nicaragua, Lebanon, and Samoa around 26-27% in the 2024 estimates.
- Tajikistan, 2024 estimate
- ~45% of GDP
- Tonga, 2024 estimate
- ~38% of GDP
- Nicaragua, Lebanon, and Samoa, 2024 estimates
- about 26-27% of GDP
Map: personal remittances received as a share of GDP, 2024, World Bank World Development Indicators. These figures follow balance-of-payments definitions and differ from the estimates in the list.
Read entry → -
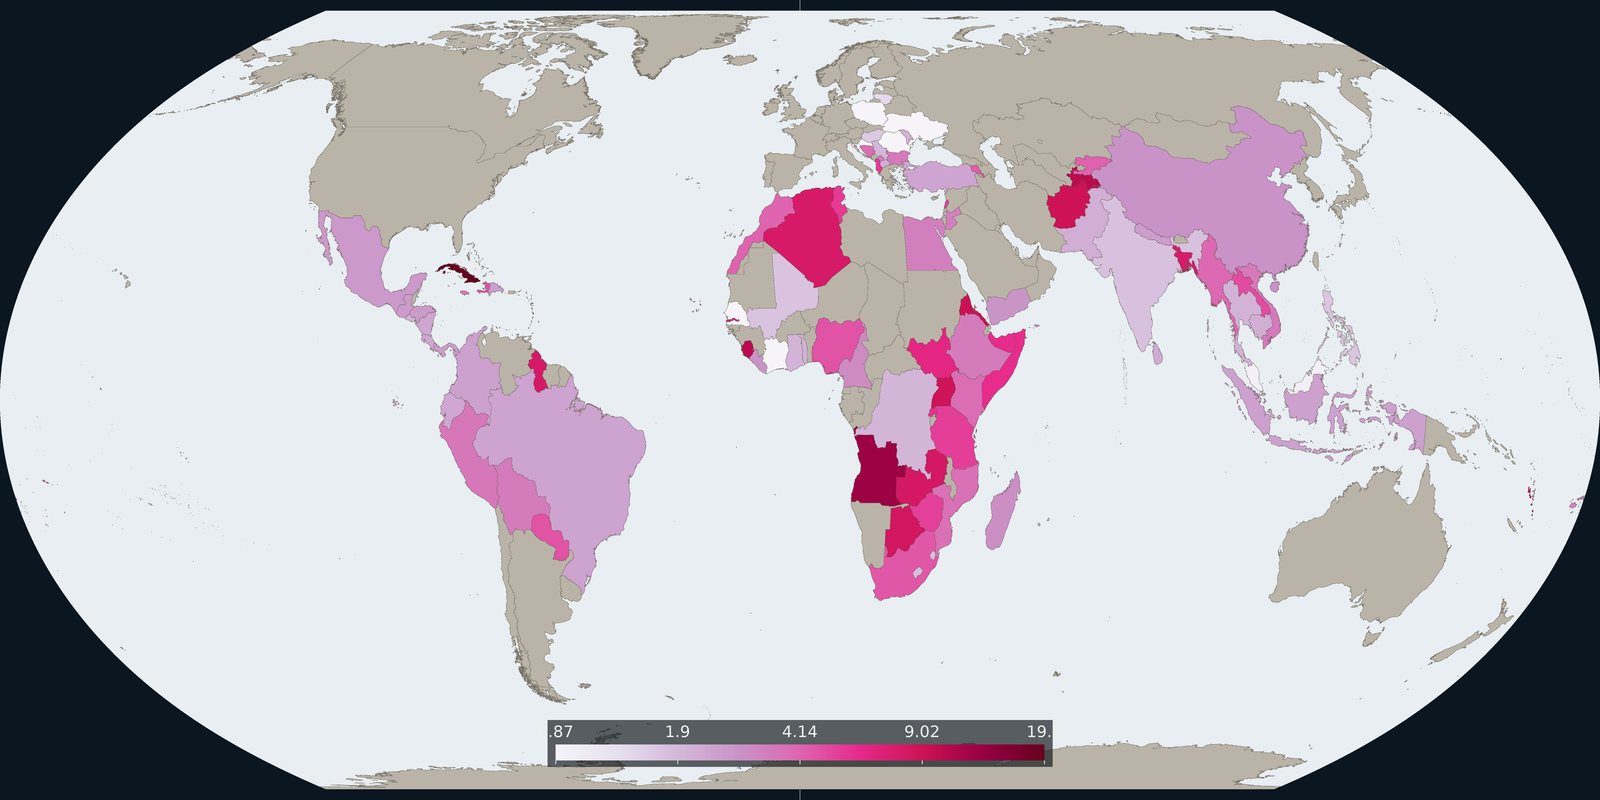
Map: Fix Planet from World Bank World Development Indicators, average cost of sending remittances to a country, as a percentage of the amount, 2023. The colour bar is percent on a logarithmic scale. Land without a positive 2023 figure stays grey. CC BY 4.0. Boundaries: Natural Earth.
Prices · RPW
Cost of sending money home
6.4 percent, global average, late 2023
Sending remittances still costs about 6.4% of the amount on a global average: more than double the Sustainable Development Goal (SDG) target of 3%, and the World Bank’s Remittance Prices Worldwide website, updated 18 August 2025, shows about 6.36%.
- Global average, fourth quarter 2023
- 6.4%
- Remittance Prices Worldwide, 18 August 2025
- about 6.36%
- Sustainable Development Goal target
- 3%
Map: average cost of sending remittances to a country, 2023, World Bank World Development Indicators. These figures differ from the global averages in the text.
Read entry →